

Key Insights
The global cellulose derivatives market, valued at $6.73 billion in 2025, is projected for substantial growth, anticipating a Compound Annual Growth Rate (CAGR) of 6.6% through 2033. Key growth drivers include increasing demand from the construction sector, propelled by infrastructure development and sustainable building initiatives. The expanding cosmetics and pharmaceuticals industries also significantly contribute, leveraging cellulose derivatives for thickening, stabilization, and film-forming properties. The food and beverage sector further fuels expansion through the use of these derivatives for texture modification and enhanced shelf life. Growth in paints and coatings, plastics, and textile applications also bolsters the market outlook. Despite potential challenges from supply chain disruptions and raw material price volatility, the market's trajectory remains positive due to the versatile applications and the rising preference for eco-friendly materials. Cellulose ethers and esters lead segmentations, with construction, cosmetics & pharmaceuticals, and food & beverage being the dominant end-user industries. Asia-Pacific, particularly China and India, is expected to exhibit strong growth, supported by consistent demand in North America and Europe. The competitive landscape features established multinational corporations and regional players, presenting opportunities for consolidation and innovation.
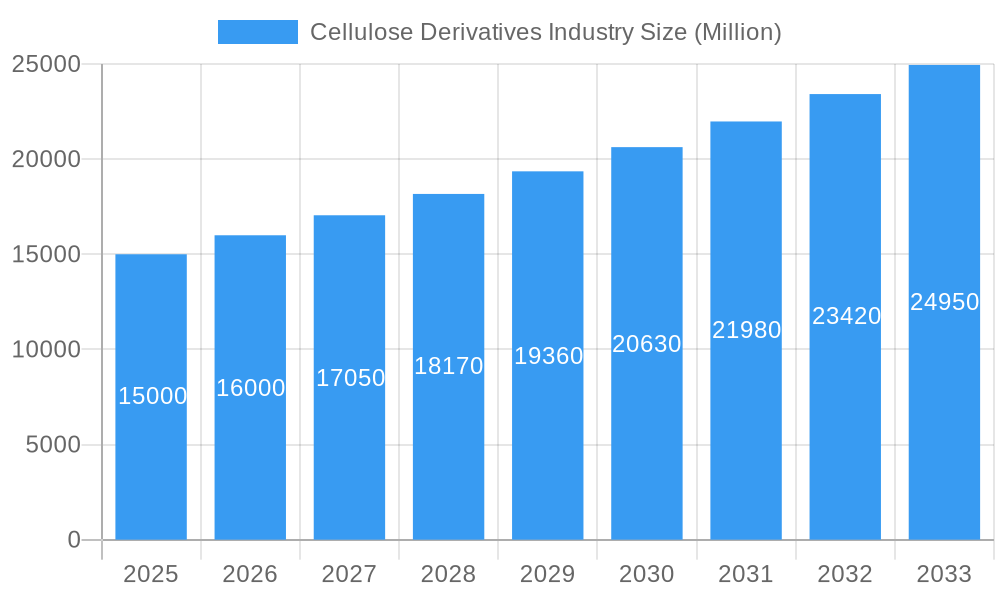
Cellulose Derivatives Industry Market Size (In Billion)
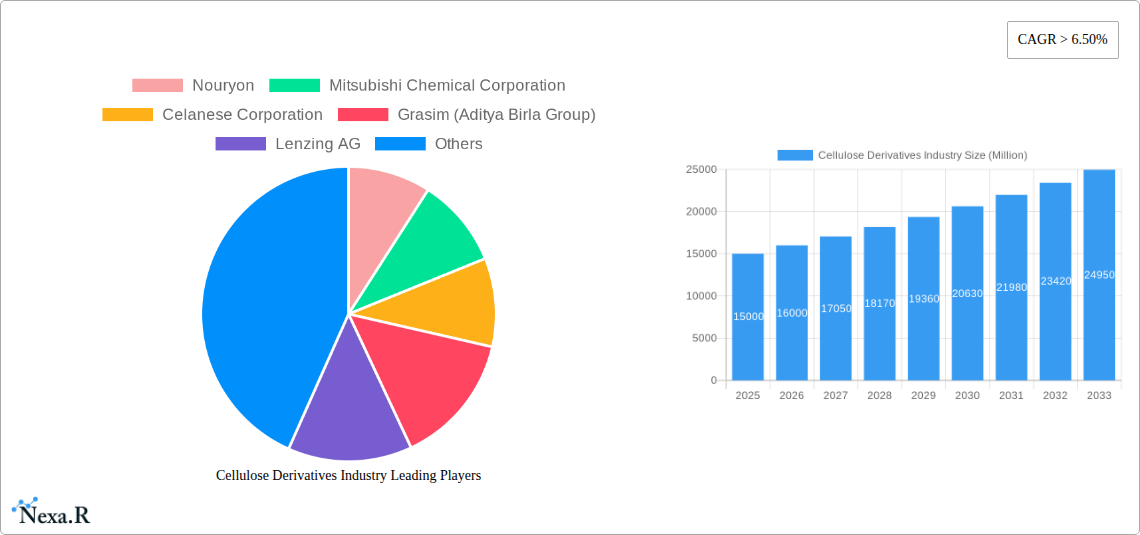
The competitive landscape is highly dynamic, with key players like Nouryon, Mitsubishi Chemical Corporation, and Celanese Corporation actively pursuing innovation and product portfolio expansion. Strategic collaborations, mergers, and acquisitions are anticipated to influence market dynamics. Regional growth variations are attributed to differing economic development, regulatory frameworks, and consumer preferences. Companies are prioritizing the development of sustainable and high-performance cellulose derivatives to address evolving industry needs. The market's future success depends on the sustained adoption of eco-friendly materials, advancements in production technologies, and effective management of supply chain complexities to meet escalating demand. The forecast period indicates continued market expansion, creating significant opportunities for businesses involved in the production, distribution, and application of cellulose derivatives.
Cellulose Derivatives Industry Company Market Share
Cellulose Derivatives Industry Market Report: 2019-2033
This comprehensive report provides a detailed analysis of the Cellulose Derivatives industry, encompassing market dynamics, growth trends, regional analysis, product landscape, key players, and future outlook. The report covers the period from 2019 to 2033, with 2025 as the base year. The global Cellulose Derivatives market is projected to reach xx Million by 2033, exhibiting a CAGR of xx% during the forecast period (2025-2033).
Cellulose Derivatives Industry Market Dynamics & Structure
The Cellulose Derivatives market is characterized by a moderately concentrated structure, with key players holding significant market shares. Nouryon, Mitsubishi Chemical Corporation, and Celanese Corporation are among the leading companies, collectively accounting for approximately xx% of the global market in 2025. Technological innovation, particularly in the development of sustainable and high-performance cellulose derivatives, is a key driver. Stringent environmental regulations are also shaping industry practices, promoting the adoption of eco-friendly production methods. The market faces competition from synthetic substitutes, but the inherent biodegradability and renewability of cellulose derivatives provide a significant competitive advantage. Mergers and acquisitions (M&A) activity has been moderate in recent years, with approximately xx deals recorded between 2019 and 2024, primarily focused on expanding product portfolios and geographical reach.
- Market Concentration: Moderately concentrated, with top 5 players holding xx% market share in 2025.
- Technological Innovation: Focus on bio-based and sustainable cellulose derivatives.
- Regulatory Landscape: Stringent environmental regulations driving sustainable production.
- Competitive Substitutes: Synthetic polymers pose a competitive threat.
- M&A Activity: Moderate activity, focused on expansion and diversification (xx deals 2019-2024).
- End-User Demographics: Growing demand from construction, pharmaceuticals, and food & beverage sectors.
Cellulose Derivatives Industry Growth Trends & Insights
The Cellulose Derivatives market has witnessed consistent growth over the historical period (2019-2024), driven by increasing demand from various end-user industries. The construction sector, fueled by infrastructure development globally, is a major driver, particularly for cellulose ethers used as construction additives. The cosmetics and pharmaceuticals industry also contributes significantly, leveraging the biocompatibility and functional properties of cellulose derivatives. Technological advancements, such as the development of novel cellulose derivatives with enhanced performance characteristics, are further stimulating market expansion. Consumer preference for sustainable and environmentally friendly products is also contributing to market growth. The market size is projected to reach xx Million in 2025, with a CAGR of xx% during the forecast period. Market penetration in emerging economies remains relatively low, presenting significant growth opportunities.
- Market Size (2025): xx Million
- CAGR (2025-2033): xx%
- Key Growth Drivers: Construction, pharmaceuticals, cosmetics, and consumer preference for sustainability.
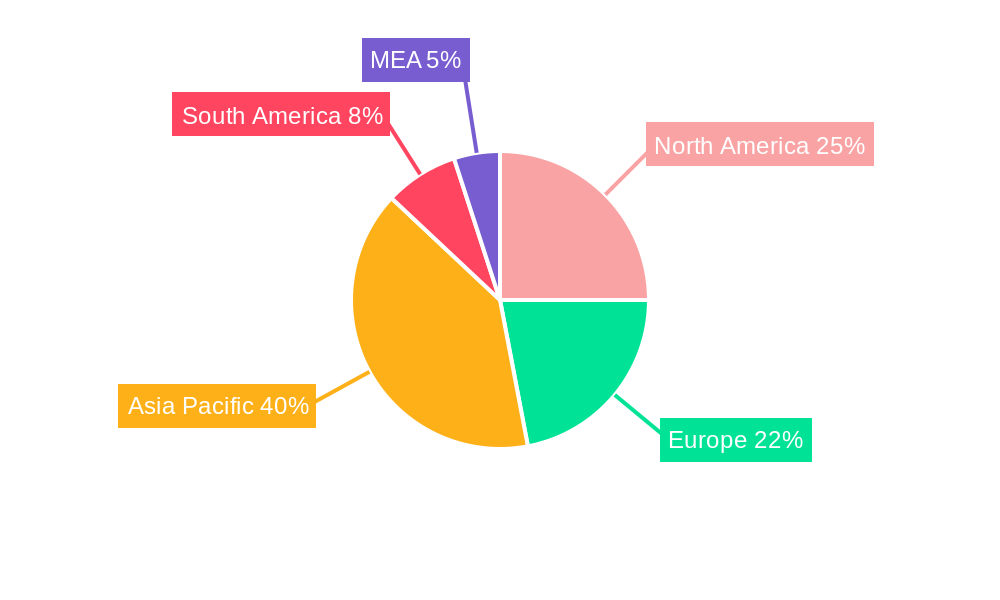
Dominant Regions, Countries, or Segments in Cellulose Derivatives Industry
North America and Europe currently dominate the global Cellulose Derivatives market, driven by strong demand from developed economies and well-established industry players. Within chemical types, Cellulose Ethers hold the largest market share, owing to their widespread applications in various end-user industries. The construction sector is the leading end-use segment, with significant demand for cellulose ethers in construction materials. Asia-Pacific is emerging as a high-growth region, fueled by rapid industrialization and infrastructure development. Key drivers include government initiatives promoting sustainable building practices and increasing consumer disposable income.
- Leading Region: North America
- Leading Chemical Type: Cellulose Ethers
- Leading End-Use Segment: Construction
- High-Growth Region: Asia-Pacific
- Key Drivers (Asia-Pacific): Infrastructure development, government initiatives, rising disposable income.
Cellulose Derivatives Industry Product Landscape
The Cellulose Derivatives market offers a diverse range of products, including cellulose esters (e.g., cellulose acetate, cellulose nitrate), cellulose ethers (e.g., methyl cellulose, hydroxyethyl cellulose), and regenerated cellulose (e.g., viscose, rayon). Recent innovations focus on developing high-performance derivatives with enhanced properties, such as improved solubility, viscosity, and biodegradability. These advancements are expanding the applications of cellulose derivatives into new sectors and enabling the development of novel products with superior performance and sustainability profiles.
Key Drivers, Barriers & Challenges in Cellulose Derivatives Industry
Key Drivers:
- Increasing demand from construction, pharmaceuticals, and food & beverage sectors.
- Growing consumer preference for sustainable and biodegradable materials.
- Technological advancements leading to improved product performance.
- Favorable government policies promoting the use of bio-based materials.
Key Challenges:
- Fluctuations in raw material prices (e.g., wood pulp).
- Stringent environmental regulations requiring compliance with sustainable production practices.
- Intense competition from synthetic polymer substitutes.
- Supply chain disruptions affecting production and distribution.
Emerging Opportunities in Cellulose Derivatives Industry
- Expansion into untapped markets in developing economies.
- Development of novel applications in emerging sectors (e.g., bioplastics, 3D printing).
- Growing demand for high-performance cellulose derivatives with specific functional properties.
- Increasing interest in sustainable and biodegradable packaging solutions.
Growth Accelerators in the Cellulose Derivatives Industry
Technological breakthroughs in cellulose derivative synthesis are paving the way for new products with enhanced functionality and sustainability profiles. Strategic partnerships between cellulose producers and end-user companies are fostering innovation and expanding market reach. Expansion into new geographical markets, particularly in developing economies, presents significant growth opportunities. Furthermore, the increasing focus on sustainable materials offers a strong impetus for the continued growth of the cellulose derivatives industry.
Key Players Shaping the Cellulose Derivatives Industry Market
- Nouryon
- Mitsubishi Chemical Corporation
- Celanese Corporation
- Grasim (Aditya Birla Group)
- Lenzing AG
- Futamura Chemical Co Ltd
- Ashland
- DuPont
- Dow
- Eastman Chemical Company
- Daicel Corporation
- FKuR
- Sappi Limited
- Shin-Etsu Chemical Co Ltd
- Xinjiang Zhongtai Chemical Co Ltd
- Cerdia International GmbH
Notable Milestones in Cellulose Derivatives Industry Sector
- 2020: Launch of a new biodegradable cellulose-based packaging material by [Company Name].
- 2021: Acquisition of [Company A] by [Company B], expanding market reach.
- 2022: Introduction of a novel cellulose derivative with enhanced performance characteristics by [Company Name].
- 2023: Significant investment in R&D for sustainable cellulose derivatives by [Company Name].
In-Depth Cellulose Derivatives Industry Market Outlook
The Cellulose Derivatives market is poised for continued growth over the forecast period, driven by robust demand from diverse end-user industries, technological innovations, and a growing focus on sustainability. Strategic partnerships, market expansion into emerging economies, and the development of novel applications will further propel market expansion. The market presents attractive opportunities for established players and new entrants alike, especially those focused on developing sustainable and high-performance cellulose-based products.
Cellulose Derivatives Industry Segmentation
-
1. Chemical Type
- 1.1. Cellulose Esters
- 1.2. Cellulose Ethers
- 1.3. Regenerated Cellulose
-
2. End-user Industry
- 2.1. Construction
- 2.2. Cosmetics & Pharmaceuricals
- 2.3. Food & Beverage
- 2.4. Paints & Coatings
- 2.5. Plastics
- 2.6. Textile
- 2.7. Other End-user Industries
Cellulose Derivatives Industry Segmentation By Geography
-
1. Asia Pacific
- 1.1. China
- 1.2. India
- 1.3. Japan
- 1.4. South Korea
- 1.5. Rest of Asia Pacific
-
2. North America
- 2.1. United States
- 2.2. Mexico
- 2.3. Canada
-
3. Europe
- 3.1. Germany
- 3.2. United Kingdom
- 3.3. Italy
- 3.4. France
- 3.5. Rest of Europe
-
4. South America
- 4.1. Brazil
- 4.2. Argentina
- 4.3. Rest of South America
-
5. Middle East & Africa
- 5.1. UAE
- 5.2. Saudi Arabia
- 5.3. South Africa
- 5.4. Rest of Middle East & Africa
Cellulose Derivatives Industry Regional Market Share
Geographic Coverage of Cellulose Derivatives Industry
Cellulose Derivatives Industry REPORT HIGHLIGHTS
| Aspects | Details |
|---|---|
| Study Period | 2020-2034 |
| Base Year | 2025 |
| Estimated Year | 2026 |
| Forecast Period | 2026-2034 |
| Historical Period | 2020-2025 |
| Growth Rate | CAGR of 6.6% from 2020-2034 |
| Segmentation |
|
Table of Contents
- 1. Introduction
- 1.1. Research Scope
- 1.2. Market Segmentation
- 1.3. Research Objective
- 1.4. Definitions and Assumptions
- 2. Executive Summary
- 2.1. Market Snapshot
- 3. Market Dynamics
- 3.1. Market Drivers
- 3.2. Market Restrains
- 3.3. Market Trends
- 3.4. Market Opportunities
- 4. Market Factor Analysis
- 4.1. Porters Five Forces
- 4.1.1. Bargaining Power of Suppliers
- 4.1.2. Bargaining Power of Buyers
- 4.1.3. Threat of New Entrants
- 4.1.4. Threat of Substitutes
- 4.1.5. Competitive Rivalry
- 4.2. PESTEL analysis
- 4.3. BCG Analysis
- 4.3.1. Stars (High Growth, High Market Share)
- 4.3.2. Cash Cows (Low Growth, High Market Share)
- 4.3.3. Question Mark (High Growth, Low Market Share)
- 4.3.4. Dogs (Low Growth, Low Market Share)
- 4.4. Ansoff Matrix Analysis
- 4.5. Supply Chain Analysis
- 4.6. Regulatory Landscape
- 4.7. Current Market Potential and Opportunity Assessment (TAM–SAM–SOM Framework)
- 4.8. NRP Analyst Note
- 4.1. Porters Five Forces
- 5. Market Analysis, Insights and Forecast 2021-2033
- 5.1. Market Analysis, Insights and Forecast - by Chemical Type
- 5.1.1. Cellulose Esters
- 5.1.2. Cellulose Ethers
- 5.1.3. Regenerated Cellulose
- 5.2. Market Analysis, Insights and Forecast - by End-user Industry
- 5.2.1. Construction
- 5.2.2. Cosmetics & Pharmaceuricals
- 5.2.3. Food & Beverage
- 5.2.4. Paints & Coatings
- 5.2.5. Plastics
- 5.2.6. Textile
- 5.2.7. Other End-user Industries
- 5.3. Market Analysis, Insights and Forecast - by Region
- 5.3.1. Asia Pacific
- 5.3.2. North America
- 5.3.3. Europe
- 5.3.4. South America
- 5.3.5. Middle East & Africa
- 5.1. Market Analysis, Insights and Forecast - by Chemical Type
- 6. Global Cellulose Derivatives Industry Analysis, Insights and Forecast, 2021-2033
- 6.1. Market Analysis, Insights and Forecast - by Chemical Type
- 6.1.1. Cellulose Esters
- 6.1.2. Cellulose Ethers
- 6.1.3. Regenerated Cellulose
- 6.2. Market Analysis, Insights and Forecast - by End-user Industry
- 6.2.1. Construction
- 6.2.2. Cosmetics & Pharmaceuricals
- 6.2.3. Food & Beverage
- 6.2.4. Paints & Coatings
- 6.2.5. Plastics
- 6.2.6. Textile
- 6.2.7. Other End-user Industries
- 6.1. Market Analysis, Insights and Forecast - by Chemical Type
- 7. Asia Pacific Cellulose Derivatives Industry Analysis, Insights and Forecast, 2020-2032
- 7.1. Market Analysis, Insights and Forecast - by Chemical Type
- 7.1.1. Cellulose Esters
- 7.1.2. Cellulose Ethers
- 7.1.3. Regenerated Cellulose
- 7.2. Market Analysis, Insights and Forecast - by End-user Industry
- 7.2.1. Construction
- 7.2.2. Cosmetics & Pharmaceuricals
- 7.2.3. Food & Beverage
- 7.2.4. Paints & Coatings
- 7.2.5. Plastics
- 7.2.6. Textile
- 7.2.7. Other End-user Industries
- 7.1. Market Analysis, Insights and Forecast - by Chemical Type
- 8. North America Cellulose Derivatives Industry Analysis, Insights and Forecast, 2020-2032
- 8.1. Market Analysis, Insights and Forecast - by Chemical Type
- 8.1.1. Cellulose Esters
- 8.1.2. Cellulose Ethers
- 8.1.3. Regenerated Cellulose
- 8.2. Market Analysis, Insights and Forecast - by End-user Industry
- 8.2.1. Construction
- 8.2.2. Cosmetics & Pharmaceuricals
- 8.2.3. Food & Beverage
- 8.2.4. Paints & Coatings
- 8.2.5. Plastics
- 8.2.6. Textile
- 8.2.7. Other End-user Industries
- 8.1. Market Analysis, Insights and Forecast - by Chemical Type
- 9. Europe Cellulose Derivatives Industry Analysis, Insights and Forecast, 2020-2032
- 9.1. Market Analysis, Insights and Forecast - by Chemical Type
- 9.1.1. Cellulose Esters
- 9.1.2. Cellulose Ethers
- 9.1.3. Regenerated Cellulose
- 9.2. Market Analysis, Insights and Forecast - by End-user Industry
- 9.2.1. Construction
- 9.2.2. Cosmetics & Pharmaceuricals
- 9.2.3. Food & Beverage
- 9.2.4. Paints & Coatings
- 9.2.5. Plastics
- 9.2.6. Textile
- 9.2.7. Other End-user Industries
- 9.1. Market Analysis, Insights and Forecast - by Chemical Type
- 10. South America Cellulose Derivatives Industry Analysis, Insights and Forecast, 2020-2032
- 10.1. Market Analysis, Insights and Forecast - by Chemical Type
- 10.1.1. Cellulose Esters
- 10.1.2. Cellulose Ethers
- 10.1.3. Regenerated Cellulose
- 10.2. Market Analysis, Insights and Forecast - by End-user Industry
- 10.2.1. Construction
- 10.2.2. Cosmetics & Pharmaceuricals
- 10.2.3. Food & Beverage
- 10.2.4. Paints & Coatings
- 10.2.5. Plastics
- 10.2.6. Textile
- 10.2.7. Other End-user Industries
- 10.1. Market Analysis, Insights and Forecast - by Chemical Type
- 11. Middle East & Africa Cellulose Derivatives Industry Analysis, Insights and Forecast, 2020-2032
- 11.1. Market Analysis, Insights and Forecast - by Chemical Type
- 11.1.1. Cellulose Esters
- 11.1.2. Cellulose Ethers
- 11.1.3. Regenerated Cellulose
- 11.2. Market Analysis, Insights and Forecast - by End-user Industry
- 11.2.1. Construction
- 11.2.2. Cosmetics & Pharmaceuricals
- 11.2.3. Food & Beverage
- 11.2.4. Paints & Coatings
- 11.2.5. Plastics
- 11.2.6. Textile
- 11.2.7. Other End-user Industries
- 11.1. Market Analysis, Insights and Forecast - by Chemical Type
- 12. Competitive Analysis
- 12.1. Company Profiles
- 12.1.1 Nouryon
- 12.1.1.1. Company Overview
- 12.1.1.2. Products
- 12.1.1.3. Company Financials
- 12.1.1.4. SWOT Analysis
- 12.1.2 Mitsubishi Chemical Corporation
- 12.1.2.1. Company Overview
- 12.1.2.2. Products
- 12.1.2.3. Company Financials
- 12.1.2.4. SWOT Analysis
- 12.1.3 Celanese Corporation
- 12.1.3.1. Company Overview
- 12.1.3.2. Products
- 12.1.3.3. Company Financials
- 12.1.3.4. SWOT Analysis
- 12.1.4 Grasim (Aditya Birla Group)
- 12.1.4.1. Company Overview
- 12.1.4.2. Products
- 12.1.4.3. Company Financials
- 12.1.4.4. SWOT Analysis
- 12.1.5 Lenzing AG
- 12.1.5.1. Company Overview
- 12.1.5.2. Products
- 12.1.5.3. Company Financials
- 12.1.5.4. SWOT Analysis
- 12.1.6 Futamura Chemical Co Ltd
- 12.1.6.1. Company Overview
- 12.1.6.2. Products
- 12.1.6.3. Company Financials
- 12.1.6.4. SWOT Analysis
- 12.1.7 Ashland
- 12.1.7.1. Company Overview
- 12.1.7.2. Products
- 12.1.7.3. Company Financials
- 12.1.7.4. SWOT Analysis
- 12.1.8 DuPont
- 12.1.8.1. Company Overview
- 12.1.8.2. Products
- 12.1.8.3. Company Financials
- 12.1.8.4. SWOT Analysis
- 12.1.9 Dow
- 12.1.9.1. Company Overview
- 12.1.9.2. Products
- 12.1.9.3. Company Financials
- 12.1.9.4. SWOT Analysis
- 12.1.10 Eastman Chemical Company
- 12.1.10.1. Company Overview
- 12.1.10.2. Products
- 12.1.10.3. Company Financials
- 12.1.10.4. SWOT Analysis
- 12.1.11 Daicel Corporation
- 12.1.11.1. Company Overview
- 12.1.11.2. Products
- 12.1.11.3. Company Financials
- 12.1.11.4. SWOT Analysis
- 12.1.12 FKuR
- 12.1.12.1. Company Overview
- 12.1.12.2. Products
- 12.1.12.3. Company Financials
- 12.1.12.4. SWOT Analysis
- 12.1.13 Sappi Limited
- 12.1.13.1. Company Overview
- 12.1.13.2. Products
- 12.1.13.3. Company Financials
- 12.1.13.4. SWOT Analysis
- 12.1.14 Shin-Etsu Chemical Co Ltd
- 12.1.14.1. Company Overview
- 12.1.14.2. Products
- 12.1.14.3. Company Financials
- 12.1.14.4. SWOT Analysis
- 12.1.15 Xinjiang Zhongtai Chemical Co Ltd
- 12.1.15.1. Company Overview
- 12.1.15.2. Products
- 12.1.15.3. Company Financials
- 12.1.15.4. SWOT Analysis
- 12.1.16 Cerdia International GmbH
- 12.1.16.1. Company Overview
- 12.1.16.2. Products
- 12.1.16.3. Company Financials
- 12.1.16.4. SWOT Analysis
- 12.1.1 Nouryon
- 12.2. Market Entropy
- 12.2.1 Company's Key Areas Served
- 12.2.2 Recent Developments
- 12.3. Company Market Share Analysis 2025
- 12.3.1 Top 5 Companies Market Share Analysis
- 12.3.2 Top 3 Companies Market Share Analysis
- 12.4. List of Potential Customers
- 13. Research Methodology
List of Figures
- Figure 1: Global Cellulose Derivatives Industry Revenue Breakdown (billion, %) by Region 2025 & 2033
- Figure 2: Global Cellulose Derivatives Industry Volume Breakdown (K Tons, %) by Region 2025 & 2033
- Figure 3: Asia Pacific Cellulose Derivatives Industry Revenue (billion), by Chemical Type 2025 & 2033
- Figure 4: Asia Pacific Cellulose Derivatives Industry Volume (K Tons), by Chemical Type 2025 & 2033
- Figure 5: Asia Pacific Cellulose Derivatives Industry Revenue Share (%), by Chemical Type 2025 & 2033
- Figure 6: Asia Pacific Cellulose Derivatives Industry Volume Share (%), by Chemical Type 2025 & 2033
- Figure 7: Asia Pacific Cellulose Derivatives Industry Revenue (billion), by End-user Industry 2025 & 2033
- Figure 8: Asia Pacific Cellulose Derivatives Industry Volume (K Tons), by End-user Industry 2025 & 2033
- Figure 9: Asia Pacific Cellulose Derivatives Industry Revenue Share (%), by End-user Industry 2025 & 2033
- Figure 10: Asia Pacific Cellulose Derivatives Industry Volume Share (%), by End-user Industry 2025 & 2033
- Figure 11: Asia Pacific Cellulose Derivatives Industry Revenue (billion), by Country 2025 & 2033
- Figure 12: Asia Pacific Cellulose Derivatives Industry Volume (K Tons), by Country 2025 & 2033
- Figure 13: Asia Pacific Cellulose Derivatives Industry Revenue Share (%), by Country 2025 & 2033
- Figure 14: Asia Pacific Cellulose Derivatives Industry Volume Share (%), by Country 2025 & 2033
- Figure 15: North America Cellulose Derivatives Industry Revenue (billion), by Chemical Type 2025 & 2033
- Figure 16: North America Cellulose Derivatives Industry Volume (K Tons), by Chemical Type 2025 & 2033
- Figure 17: North America Cellulose Derivatives Industry Revenue Share (%), by Chemical Type 2025 & 2033
- Figure 18: North America Cellulose Derivatives Industry Volume Share (%), by Chemical Type 2025 & 2033
- Figure 19: North America Cellulose Derivatives Industry Revenue (billion), by End-user Industry 2025 & 2033
- Figure 20: North America Cellulose Derivatives Industry Volume (K Tons), by End-user Industry 2025 & 2033
- Figure 21: North America Cellulose Derivatives Industry Revenue Share (%), by End-user Industry 2025 & 2033
- Figure 22: North America Cellulose Derivatives Industry Volume Share (%), by End-user Industry 2025 & 2033
- Figure 23: North America Cellulose Derivatives Industry Revenue (billion), by Country 2025 & 2033
- Figure 24: North America Cellulose Derivatives Industry Volume (K Tons), by Country 2025 & 2033
- Figure 25: North America Cellulose Derivatives Industry Revenue Share (%), by Country 2025 & 2033
- Figure 26: North America Cellulose Derivatives Industry Volume Share (%), by Country 2025 & 2033
- Figure 27: Europe Cellulose Derivatives Industry Revenue (billion), by Chemical Type 2025 & 2033
- Figure 28: Europe Cellulose Derivatives Industry Volume (K Tons), by Chemical Type 2025 & 2033
- Figure 29: Europe Cellulose Derivatives Industry Revenue Share (%), by Chemical Type 2025 & 2033
- Figure 30: Europe Cellulose Derivatives Industry Volume Share (%), by Chemical Type 2025 & 2033
- Figure 31: Europe Cellulose Derivatives Industry Revenue (billion), by End-user Industry 2025 & 2033
- Figure 32: Europe Cellulose Derivatives Industry Volume (K Tons), by End-user Industry 2025 & 2033
- Figure 33: Europe Cellulose Derivatives Industry Revenue Share (%), by End-user Industry 2025 & 2033
- Figure 34: Europe Cellulose Derivatives Industry Volume Share (%), by End-user Industry 2025 & 2033
- Figure 35: Europe Cellulose Derivatives Industry Revenue (billion), by Country 2025 & 2033
- Figure 36: Europe Cellulose Derivatives Industry Volume (K Tons), by Country 2025 & 2033
- Figure 37: Europe Cellulose Derivatives Industry Revenue Share (%), by Country 2025 & 2033
- Figure 38: Europe Cellulose Derivatives Industry Volume Share (%), by Country 2025 & 2033
- Figure 39: South America Cellulose Derivatives Industry Revenue (billion), by Chemical Type 2025 & 2033
- Figure 40: South America Cellulose Derivatives Industry Volume (K Tons), by Chemical Type 2025 & 2033
- Figure 41: South America Cellulose Derivatives Industry Revenue Share (%), by Chemical Type 2025 & 2033
- Figure 42: South America Cellulose Derivatives Industry Volume Share (%), by Chemical Type 2025 & 2033
- Figure 43: South America Cellulose Derivatives Industry Revenue (billion), by End-user Industry 2025 & 2033
- Figure 44: South America Cellulose Derivatives Industry Volume (K Tons), by End-user Industry 2025 & 2033
- Figure 45: South America Cellulose Derivatives Industry Revenue Share (%), by End-user Industry 2025 & 2033
- Figure 46: South America Cellulose Derivatives Industry Volume Share (%), by End-user Industry 2025 & 2033
- Figure 47: South America Cellulose Derivatives Industry Revenue (billion), by Country 2025 & 2033
- Figure 48: South America Cellulose Derivatives Industry Volume (K Tons), by Country 2025 & 2033
- Figure 49: South America Cellulose Derivatives Industry Revenue Share (%), by Country 2025 & 2033
- Figure 50: South America Cellulose Derivatives Industry Volume Share (%), by Country 2025 & 2033
- Figure 51: Middle East & Africa Cellulose Derivatives Industry Revenue (billion), by Chemical Type 2025 & 2033
- Figure 52: Middle East & Africa Cellulose Derivatives Industry Volume (K Tons), by Chemical Type 2025 & 2033
- Figure 53: Middle East & Africa Cellulose Derivatives Industry Revenue Share (%), by Chemical Type 2025 & 2033
- Figure 54: Middle East & Africa Cellulose Derivatives Industry Volume Share (%), by Chemical Type 2025 & 2033
- Figure 55: Middle East & Africa Cellulose Derivatives Industry Revenue (billion), by End-user Industry 2025 & 2033
- Figure 56: Middle East & Africa Cellulose Derivatives Industry Volume (K Tons), by End-user Industry 2025 & 2033
- Figure 57: Middle East & Africa Cellulose Derivatives Industry Revenue Share (%), by End-user Industry 2025 & 2033
- Figure 58: Middle East & Africa Cellulose Derivatives Industry Volume Share (%), by End-user Industry 2025 & 2033
- Figure 59: Middle East & Africa Cellulose Derivatives Industry Revenue (billion), by Country 2025 & 2033
- Figure 60: Middle East & Africa Cellulose Derivatives Industry Volume (K Tons), by Country 2025 & 2033
- Figure 61: Middle East & Africa Cellulose Derivatives Industry Revenue Share (%), by Country 2025 & 2033
- Figure 62: Middle East & Africa Cellulose Derivatives Industry Volume Share (%), by Country 2025 & 2033
List of Tables
- Table 1: Global Cellulose Derivatives Industry Revenue billion Forecast, by Chemical Type 2020 & 2033
- Table 2: Global Cellulose Derivatives Industry Volume K Tons Forecast, by Chemical Type 2020 & 2033
- Table 3: Global Cellulose Derivatives Industry Revenue billion Forecast, by End-user Industry 2020 & 2033
- Table 4: Global Cellulose Derivatives Industry Volume K Tons Forecast, by End-user Industry 2020 & 2033
- Table 5: Global Cellulose Derivatives Industry Revenue billion Forecast, by Region 2020 & 2033
- Table 6: Global Cellulose Derivatives Industry Volume K Tons Forecast, by Region 2020 & 2033
- Table 7: Global Cellulose Derivatives Industry Revenue billion Forecast, by Chemical Type 2020 & 2033
- Table 8: Global Cellulose Derivatives Industry Volume K Tons Forecast, by Chemical Type 2020 & 2033
- Table 9: Global Cellulose Derivatives Industry Revenue billion Forecast, by End-user Industry 2020 & 2033
- Table 10: Global Cellulose Derivatives Industry Volume K Tons Forecast, by End-user Industry 2020 & 2033
- Table 11: Global Cellulose Derivatives Industry Revenue billion Forecast, by Country 2020 & 2033
- Table 12: Global Cellulose Derivatives Industry Volume K Tons Forecast, by Country 2020 & 2033
- Table 13: China Cellulose Derivatives Industry Revenue (billion) Forecast, by Application 2020 & 2033
- Table 14: China Cellulose Derivatives Industry Volume (K Tons) Forecast, by Application 2020 & 2033
- Table 15: India Cellulose Derivatives Industry Revenue (billion) Forecast, by Application 2020 & 2033
- Table 16: India Cellulose Derivatives Industry Volume (K Tons) Forecast, by Application 2020 & 2033
- Table 17: Japan Cellulose Derivatives Industry Revenue (billion) Forecast, by Application 2020 & 2033
- Table 18: Japan Cellulose Derivatives Industry Volume (K Tons) Forecast, by Application 2020 & 2033
- Table 19: South Korea Cellulose Derivatives Industry Revenue (billion) Forecast, by Application 2020 & 2033
- Table 20: South Korea Cellulose Derivatives Industry Volume (K Tons) Forecast, by Application 2020 & 2033
- Table 21: Rest of Asia Pacific Cellulose Derivatives Industry Revenue (billion) Forecast, by Application 2020 & 2033
- Table 22: Rest of Asia Pacific Cellulose Derivatives Industry Volume (K Tons) Forecast, by Application 2020 & 2033
- Table 23: Global Cellulose Derivatives Industry Revenue billion Forecast, by Chemical Type 2020 & 2033
- Table 24: Global Cellulose Derivatives Industry Volume K Tons Forecast, by Chemical Type 2020 & 2033
- Table 25: Global Cellulose Derivatives Industry Revenue billion Forecast, by End-user Industry 2020 & 2033
- Table 26: Global Cellulose Derivatives Industry Volume K Tons Forecast, by End-user Industry 2020 & 2033
- Table 27: Global Cellulose Derivatives Industry Revenue billion Forecast, by Country 2020 & 2033
- Table 28: Global Cellulose Derivatives Industry Volume K Tons Forecast, by Country 2020 & 2033
- Table 29: United States Cellulose Derivatives Industry Revenue (billion) Forecast, by Application 2020 & 2033
- Table 30: United States Cellulose Derivatives Industry Volume (K Tons) Forecast, by Application 2020 & 2033
- Table 31: Mexico Cellulose Derivatives Industry Revenue (billion) Forecast, by Application 2020 & 2033
- Table 32: Mexico Cellulose Derivatives Industry Volume (K Tons) Forecast, by Application 2020 & 2033
- Table 33: Canada Cellulose Derivatives Industry Revenue (billion) Forecast, by Application 2020 & 2033
- Table 34: Canada Cellulose Derivatives Industry Volume (K Tons) Forecast, by Application 2020 & 2033
- Table 35: Global Cellulose Derivatives Industry Revenue billion Forecast, by Chemical Type 2020 & 2033
- Table 36: Global Cellulose Derivatives Industry Volume K Tons Forecast, by Chemical Type 2020 & 2033
- Table 37: Global Cellulose Derivatives Industry Revenue billion Forecast, by End-user Industry 2020 & 2033
- Table 38: Global Cellulose Derivatives Industry Volume K Tons Forecast, by End-user Industry 2020 & 2033
- Table 39: Global Cellulose Derivatives Industry Revenue billion Forecast, by Country 2020 & 2033
- Table 40: Global Cellulose Derivatives Industry Volume K Tons Forecast, by Country 2020 & 2033
- Table 41: Germany Cellulose Derivatives Industry Revenue (billion) Forecast, by Application 2020 & 2033
- Table 42: Germany Cellulose Derivatives Industry Volume (K Tons) Forecast, by Application 2020 & 2033
- Table 43: United Kingdom Cellulose Derivatives Industry Revenue (billion) Forecast, by Application 2020 & 2033
- Table 44: United Kingdom Cellulose Derivatives Industry Volume (K Tons) Forecast, by Application 2020 & 2033
- Table 45: Italy Cellulose Derivatives Industry Revenue (billion) Forecast, by Application 2020 & 2033
- Table 46: Italy Cellulose Derivatives Industry Volume (K Tons) Forecast, by Application 2020 & 2033
- Table 47: France Cellulose Derivatives Industry Revenue (billion) Forecast, by Application 2020 & 2033
- Table 48: France Cellulose Derivatives Industry Volume (K Tons) Forecast, by Application 2020 & 2033
- Table 49: Rest of Europe Cellulose Derivatives Industry Revenue (billion) Forecast, by Application 2020 & 2033
- Table 50: Rest of Europe Cellulose Derivatives Industry Volume (K Tons) Forecast, by Application 2020 & 2033
- Table 51: Global Cellulose Derivatives Industry Revenue billion Forecast, by Chemical Type 2020 & 2033
- Table 52: Global Cellulose Derivatives Industry Volume K Tons Forecast, by Chemical Type 2020 & 2033
- Table 53: Global Cellulose Derivatives Industry Revenue billion Forecast, by End-user Industry 2020 & 2033
- Table 54: Global Cellulose Derivatives Industry Volume K Tons Forecast, by End-user Industry 2020 & 2033
- Table 55: Global Cellulose Derivatives Industry Revenue billion Forecast, by Country 2020 & 2033
- Table 56: Global Cellulose Derivatives Industry Volume K Tons Forecast, by Country 2020 & 2033
- Table 57: Brazil Cellulose Derivatives Industry Revenue (billion) Forecast, by Application 2020 & 2033
- Table 58: Brazil Cellulose Derivatives Industry Volume (K Tons) Forecast, by Application 2020 & 2033
- Table 59: Argentina Cellulose Derivatives Industry Revenue (billion) Forecast, by Application 2020 & 2033
- Table 60: Argentina Cellulose Derivatives Industry Volume (K Tons) Forecast, by Application 2020 & 2033
- Table 61: Rest of South America Cellulose Derivatives Industry Revenue (billion) Forecast, by Application 2020 & 2033
- Table 62: Rest of South America Cellulose Derivatives Industry Volume (K Tons) Forecast, by Application 2020 & 2033
- Table 63: Global Cellulose Derivatives Industry Revenue billion Forecast, by Chemical Type 2020 & 2033
- Table 64: Global Cellulose Derivatives Industry Volume K Tons Forecast, by Chemical Type 2020 & 2033
- Table 65: Global Cellulose Derivatives Industry Revenue billion Forecast, by End-user Industry 2020 & 2033
- Table 66: Global Cellulose Derivatives Industry Volume K Tons Forecast, by End-user Industry 2020 & 2033
- Table 67: Global Cellulose Derivatives Industry Revenue billion Forecast, by Country 2020 & 2033
- Table 68: Global Cellulose Derivatives Industry Volume K Tons Forecast, by Country 2020 & 2033
- Table 69: UAE Cellulose Derivatives Industry Revenue (billion) Forecast, by Application 2020 & 2033
- Table 70: UAE Cellulose Derivatives Industry Volume (K Tons) Forecast, by Application 2020 & 2033
- Table 71: Saudi Arabia Cellulose Derivatives Industry Revenue (billion) Forecast, by Application 2020 & 2033
- Table 72: Saudi Arabia Cellulose Derivatives Industry Volume (K Tons) Forecast, by Application 2020 & 2033
- Table 73: South Africa Cellulose Derivatives Industry Revenue (billion) Forecast, by Application 2020 & 2033
- Table 74: South Africa Cellulose Derivatives Industry Volume (K Tons) Forecast, by Application 2020 & 2033
- Table 75: Rest of Middle East & Africa Cellulose Derivatives Industry Revenue (billion) Forecast, by Application 2020 & 2033
- Table 76: Rest of Middle East & Africa Cellulose Derivatives Industry Volume (K Tons) Forecast, by Application 2020 & 2033
Frequently Asked Questions
1. What is the projected Compound Annual Growth Rate (CAGR) of the Cellulose Derivatives Industry?
The projected CAGR is approximately 6.6%.
2. Which companies are prominent players in the Cellulose Derivatives Industry?
Key companies in the market include Nouryon, Mitsubishi Chemical Corporation, Celanese Corporation, Grasim (Aditya Birla Group), Lenzing AG, Futamura Chemical Co Ltd, Ashland, DuPont, Dow, Eastman Chemical Company, Daicel Corporation, FKuR, Sappi Limited, Shin-Etsu Chemical Co Ltd, Xinjiang Zhongtai Chemical Co Ltd, Cerdia International GmbH.
3. What are the main segments of the Cellulose Derivatives Industry?
The market segments include Chemical Type, End-user Industry.
4. Can you provide details about the market size?
The market size is estimated to be USD 6.73 billion as of 2022.
5. What are some drivers contributing to market growth?
Increasing Demand from Pharmaceutical Industry; Increasing Use of Cellulose Ether in Building and Construction Industry; Other Drivers.
6. What are the notable trends driving market growth?
Food and Beverage Industry to Dominate the Market.
7. Are there any restraints impacting market growth?
Competition of Regenerated Cellulose Fibers from Synthetic Fibers and Other Protein-based Fibers; Other Restraints.
8. Can you provide examples of recent developments in the market?
N/A
9. What pricing options are available for accessing the report?
Pricing options include single-user, multi-user, and enterprise licenses priced at USD 4750, USD 5250, and USD 8750 respectively.
10. Is the market size provided in terms of value or volume?
The market size is provided in terms of value, measured in billion and volume, measured in K Tons.
11. Are there any specific market keywords associated with the report?
Yes, the market keyword associated with the report is "Cellulose Derivatives Industry," which aids in identifying and referencing the specific market segment covered.
12. How do I determine which pricing option suits my needs best?
The pricing options vary based on user requirements and access needs. Individual users may opt for single-user licenses, while businesses requiring broader access may choose multi-user or enterprise licenses for cost-effective access to the report.
13. Are there any additional resources or data provided in the Cellulose Derivatives Industry report?
While the report offers comprehensive insights, it's advisable to review the specific contents or supplementary materials provided to ascertain if additional resources or data are available.
14. How can I stay updated on further developments or reports in the Cellulose Derivatives Industry?
To stay informed about further developments, trends, and reports in the Cellulose Derivatives Industry, consider subscribing to industry newsletters, following relevant companies and organizations, or regularly checking reputable industry news sources and publications.
Methodology
Step 1 - Identification of Relevant Samples Size from Population Database


Step 2 - Approaches for Defining Global Market Size (Value, Volume* & Price*)

Note*: In applicable scenarios
Step 3 - Data Sources
Primary Research
- Web Analytics
- Survey Reports
- Research Institute
- Latest Research Reports
- Opinion Leaders
Secondary Research
- Annual Reports
- White Paper
- Latest Press Release
- Industry Association
- Paid Database
- Investor Presentations

Step 4 - Data Triangulation
Involves using different sources of information in order to increase the validity of a study
These sources are likely to be stakeholders in a program - participants, other researchers, program staff, other community members, and so on.
Then we put all data in single framework & apply various statistical tools to find out the dynamic on the market.
During the analysis stage, feedback from the stakeholder groups would be compared to determine areas of agreement as well as areas of divergence