

Key Insights
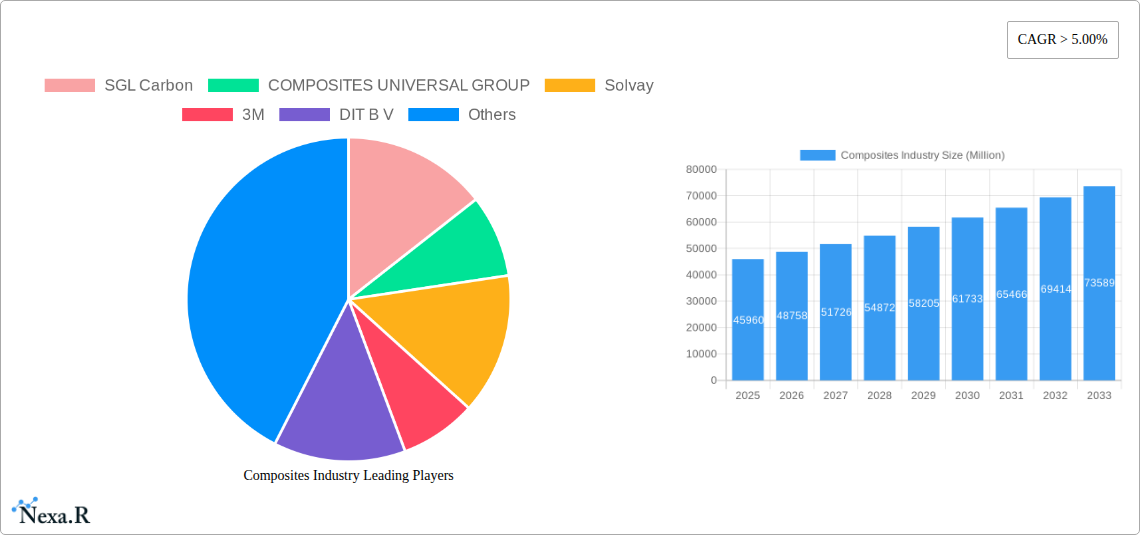
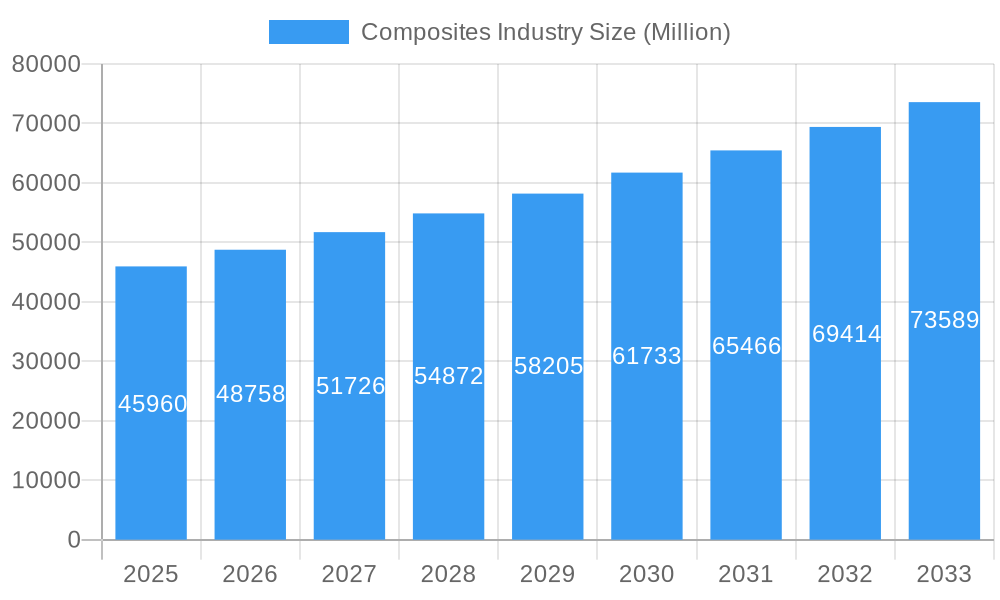
The global composites market, valued at $45.96 billion in 2025, is projected to experience robust growth, driven by a compound annual growth rate (CAGR) exceeding 5.00% from 2025 to 2033. This expansion is fueled by several key factors. The increasing demand for lightweight yet high-strength materials across diverse sectors, such as automotive, aerospace, and wind energy, is a primary driver. The automotive industry's push for fuel efficiency and reduced emissions is significantly boosting the adoption of composite materials in vehicle manufacturing, leading to lighter vehicles and improved mileage. Similarly, the aerospace sector's focus on reducing aircraft weight for enhanced fuel efficiency and payload capacity is propelling demand for advanced composites. The burgeoning renewable energy sector, particularly wind energy, also represents a significant growth opportunity, with composites playing a crucial role in the construction of wind turbine blades. Further growth is anticipated due to advancements in material science leading to the development of more durable, versatile, and cost-effective composite materials. This includes innovations in resin systems and fiber reinforcements, expanding the applications and performance capabilities of composite products.
Composites Industry Market Size (In Billion)
Despite these positive drivers, the composites market faces certain challenges. High initial investment costs associated with composite manufacturing and the relatively complex processing techniques can hinder wider adoption, particularly in cost-sensitive industries. Furthermore, concerns related to the recyclability and environmental impact of some composite materials are also emerging, requiring the development of sustainable manufacturing and end-of-life solutions. However, ongoing research and development efforts are actively addressing these limitations, focusing on developing more sustainable composite materials and improved recycling technologies. The market segmentation reveals a diverse landscape, with polymer matrix composites (PMCs) currently dominating the matrix material segment, while carbon fiber is a leading reinforcement fiber. Geographically, North America and Europe currently hold significant market shares, but rapid industrialization and infrastructure development in the Asia-Pacific region are expected to drive substantial growth in this area over the forecast period. The continuous evolution of composite materials and their expanding applications across diverse sectors suggest a promising outlook for the composites market in the coming years.
Composites Industry Company Market Share
Composites Industry Market Report: 2019-2033
This comprehensive report provides an in-depth analysis of the global composites industry, encompassing market dynamics, growth trends, regional analysis, product landscape, key players, and future outlook. The study period spans from 2019 to 2033, with 2025 as the base and estimated year. The report is invaluable for industry professionals, investors, and researchers seeking to understand and capitalize on opportunities within this dynamic market. The report value is in Million units.
Composites Industry Market Dynamics & Structure
The global composites market, valued at xx Million in 2024, is characterized by moderate concentration with several major players holding significant market share. Technological innovation, driven by the need for lighter, stronger, and more sustainable materials, is a key driver. Stringent environmental regulations are also influencing material choices and manufacturing processes. The industry faces competition from traditional materials like steel and aluminum, but composites' superior properties are steadily increasing adoption rates. Mergers and acquisitions (M&A) are common, indicating consolidation and expansion within the sector. Recent activity, as shown below, underscores a push for vertical integration and expansion into new applications.
- Market Concentration: Moderately concentrated, with the top 5 players holding approximately xx% market share in 2024.
- Technological Innovation: Focus on lightweighting, high-strength materials, and sustainable manufacturing processes.
- Regulatory Framework: Growing emphasis on environmental regulations impacting material selection and waste management.
- Competitive Substitutes: Steel, aluminum, and other traditional materials.
- End-User Demographics: Automotive, aerospace, and wind energy are key end-use segments.
- M&A Trends: Increasing M&A activity focused on expanding product portfolios and market reach, with xx major deals recorded between 2019 and 2024. Examples include Owens Corning's acquisition of Masonite and Solvay's collaboration with Spirit AeroSystems.
Composites Industry Growth Trends & Insights
The global composites market has exhibited consistent growth throughout the historical period (2019-2024), driven by increasing demand from key end-use sectors. The market is expected to maintain a healthy Compound Annual Growth Rate (CAGR) of xx% during the forecast period (2025-2033), reaching an estimated value of xx Million by 2033. This growth is fueled by technological advancements, leading to improved material properties and manufacturing processes. A shift in consumer preferences towards lightweight, fuel-efficient vehicles and sustainable infrastructure projects is also contributing to market expansion. Market penetration is increasing across various sectors, with particular focus on automotive and renewable energy applications. Technological disruptions, such as the introduction of advanced fiber-reinforced polymers and bio-based composites, are further driving market growth. The adoption of Industry 4.0 technologies within manufacturing processes adds additional growth momentum.
Dominant Regions, Countries, or Segments in Composites Industry
The North American region currently holds the largest market share in the composites industry, driven by strong demand from the aerospace and automotive sectors. However, the Asia-Pacific region is projected to witness the fastest growth during the forecast period due to rapid industrialization and infrastructure development, particularly in China and India. Within the segments, Polymer Matrix Composites (PMC) dominate the matrix material market due to their versatility and cost-effectiveness. Carbon fiber continues to be the leading reinforcement fiber, although glass fiber maintains a significant market share due to its lower cost. The automotive and transportation segment is the largest end-use application, driven by the increasing adoption of lightweight composites to improve fuel efficiency.
Key Regional Drivers:
- North America: Strong aerospace and automotive industries.
- Asia-Pacific: Rapid industrialization and infrastructure development.
- Europe: Focus on sustainable technologies and renewable energy.
Key Segment Drivers:
- Polymer Matrix Composites (PMC): Cost-effectiveness and versatility.
- Carbon Fiber: High strength-to-weight ratio.
- Automotive & Transportation: Demand for lightweight vehicles.
- Wind Energy: Requirement for lightweight and durable materials for wind turbine blades.
Composites Industry Product Landscape
The composites industry offers a diverse range of products, characterized by continuous innovation in material composition, manufacturing processes, and performance characteristics. Recent advancements include the development of high-performance thermoplastic composites, bio-based composites, and self-healing materials. These innovations improve material properties such as strength, stiffness, durability, and sustainability, leading to enhanced product performance and broadened applications across various sectors. Unique selling propositions often emphasize weight reduction, improved mechanical properties, and enhanced design flexibility.
Key Drivers, Barriers & Challenges in Composites Industry
Key Drivers:
- Technological advancements leading to improved material properties and manufacturing processes.
- Growing demand from key end-use sectors such as automotive, aerospace, and wind energy.
- Increasing focus on lightweighting and sustainability.
Key Barriers & Challenges:
- High material costs compared to traditional materials.
- Complex manufacturing processes.
- Supply chain disruptions affecting raw material availability and pricing.
- Potential environmental concerns related to manufacturing and disposal.
Emerging Opportunities in Composites Industry
Emerging opportunities lie in the development and adoption of sustainable and bio-based composites. Growing demand for lightweight materials in electric vehicles presents a significant opportunity. Advancements in additive manufacturing (3D printing) for composites offer potential for customized designs and reduced waste. Untapped markets in emerging economies also present substantial growth potential.
Growth Accelerators in the Composites Industry Industry
Long-term growth in the composites industry will be fueled by continued technological breakthroughs in material science and manufacturing. Strategic partnerships and collaborations between material suppliers, manufacturers, and end-users will accelerate innovation and market penetration. Expansion into new and emerging applications, such as infrastructure and biomedical devices, will further drive market growth.
Key Players Shaping the Composites Industry Market
- SGL Carbon
- COMPOSITES UNIVERSAL GROUP
- Solvay
- 3M
- DIT B V
- Owens Corning
- DuPont
- TORAY INDUSTRIES INC
- Mitsubishi Chemical Group Corporation
- Hexcel Corporation
- TEIJIN LIMITED
- Materion Corporation
Notable Milestones in Composites Industry Sector
- June 2023: Solvay collaborates with Spirit AeroSystems on composite development for sustainable aircraft technologies.
- February 2024: Owens Corning acquires Masonite for USD 3.9 billion, strengthening its position in building and construction materials and glass reinforcement.
In-Depth Composites Industry Market Outlook
The composites industry is poised for significant growth over the next decade, driven by technological advancements, increasing demand from key end-use sectors, and a growing focus on sustainability. Strategic opportunities exist in developing innovative materials and manufacturing processes, expanding into new applications, and establishing strategic partnerships to capitalize on market expansion in developing economies. The market's future potential is substantial, offering significant returns for businesses that can adapt to evolving market demands and technological advancements.
Composites Industry Segmentation
-
1. Matrix Material
-
1.1. Polymer Matrix Composites (PMC)
- 1.1.1. Thermoset Resins
- 1.1.2. Thermoplastic Resins
- 1.2. Ceramic/Carbon Matrix Composites (CMCs)
- 1.3. Other Matrices (Metal Matrix Composites)
-
1.1. Polymer Matrix Composites (PMC)
-
2. Reinforcement Fiber
- 2.1. Glass Fiber
- 2.2. Carbon Fiber
- 2.3. Aramid Fiber
- 2.4. Other Fibers
-
3. End-use Application
- 3.1. Automotive and Transportation
- 3.2. Wind Energy
- 3.3. Aerospace and Defense
- 3.4. Pipes and Tanks
- 3.5. Construction
- 3.6. Electrical and Electronics
- 3.7. Sports and Recreation
- 3.8. Other End-use Applications
Composites Industry Segmentation By Geography
-
1. Asia Pacific
- 1.1. China
- 1.2. India
- 1.3. Japan
- 1.4. South Korea
- 1.5. Thailand
- 1.6. Malaysia
- 1.7. Indonesia
- 1.8. Vietnam
- 1.9. Rest of Asia Pacific
-
2. North America
- 2.1. United States
- 2.2. Canada
- 2.3. Mexico
-
3. Europe
- 3.1. Germany
- 3.2. United Kingdom
- 3.3. France
- 3.4. Italy
- 3.5. Spain
- 3.6. Russia
- 3.7. NORDIC Countries
- 3.8. Turkey
- 3.9. Rest of Europe
-
4. South America
- 4.1. Brazil
- 4.2. Argentina
- 4.3. Colombia
- 4.4. Rest of South America
-
5. Middle East and Africa
- 5.1. Saudi Arabia
- 5.2. South Africa
- 5.3. Nigeria
- 5.4. Qatar
- 5.5. Egypt
- 5.6. United Arab Emirates
- 5.7. Rest of Middle East and Africa
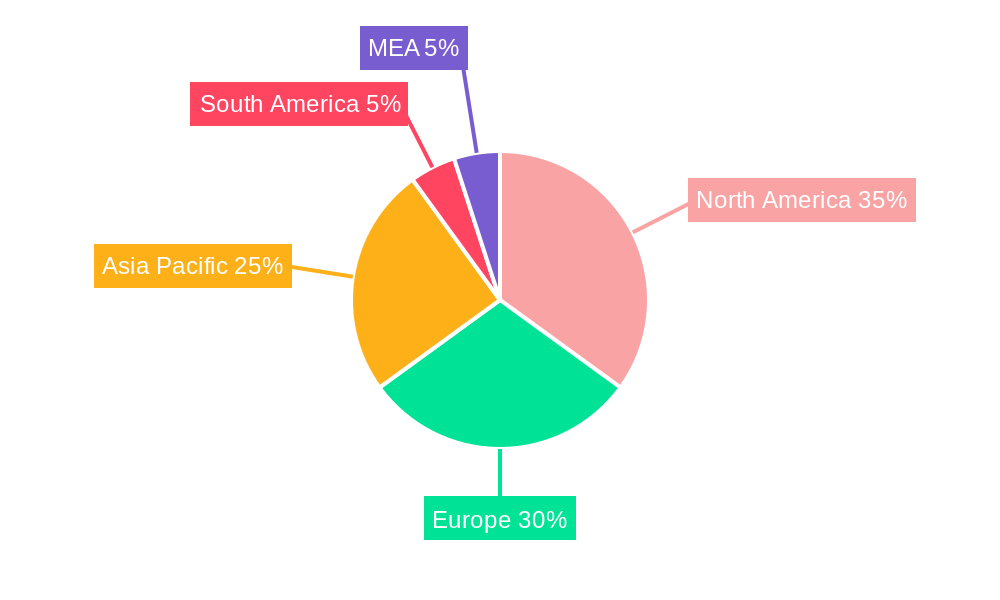
Composites Industry Regional Market Share
Geographic Coverage of Composites Industry
Composites Industry REPORT HIGHLIGHTS
| Aspects | Details |
|---|---|
| Study Period | 2020-2034 |
| Base Year | 2025 |
| Estimated Year | 2026 |
| Forecast Period | 2026-2034 |
| Historical Period | 2020-2025 |
| Growth Rate | CAGR of > 5.00% from 2020-2034 |
| Segmentation |
|
Table of Contents
- 1. Introduction
- 1.1. Research Scope
- 1.2. Market Segmentation
- 1.3. Research Objective
- 1.4. Definitions and Assumptions
- 2. Executive Summary
- 2.1. Market Snapshot
- 3. Market Dynamics
- 3.1. Market Drivers
- 3.2. Market Restrains
- 3.3. Market Trends
- 3.4. Market Opportunities
- 4. Market Factor Analysis
- 4.1. Porters Five Forces
- 4.1.1. Bargaining Power of Suppliers
- 4.1.2. Bargaining Power of Buyers
- 4.1.3. Threat of New Entrants
- 4.1.4. Threat of Substitutes
- 4.1.5. Competitive Rivalry
- 4.2. PESTEL analysis
- 4.3. BCG Analysis
- 4.3.1. Stars (High Growth, High Market Share)
- 4.3.2. Cash Cows (Low Growth, High Market Share)
- 4.3.3. Question Mark (High Growth, Low Market Share)
- 4.3.4. Dogs (Low Growth, Low Market Share)
- 4.4. Ansoff Matrix Analysis
- 4.5. Supply Chain Analysis
- 4.6. Regulatory Landscape
- 4.7. Current Market Potential and Opportunity Assessment (TAM–SAM–SOM Framework)
- 4.8. NRP Analyst Note
- 4.1. Porters Five Forces
- 5. Market Analysis, Insights and Forecast 2021-2033
- 5.1. Market Analysis, Insights and Forecast - by Matrix Material
- 5.1.1. Polymer Matrix Composites (PMC)
- 5.1.1.1. Thermoset Resins
- 5.1.1.2. Thermoplastic Resins
- 5.1.2. Ceramic/Carbon Matrix Composites (CMCs)
- 5.1.3. Other Matrices (Metal Matrix Composites)
- 5.1.1. Polymer Matrix Composites (PMC)
- 5.2. Market Analysis, Insights and Forecast - by Reinforcement Fiber
- 5.2.1. Glass Fiber
- 5.2.2. Carbon Fiber
- 5.2.3. Aramid Fiber
- 5.2.4. Other Fibers
- 5.3. Market Analysis, Insights and Forecast - by End-use Application
- 5.3.1. Automotive and Transportation
- 5.3.2. Wind Energy
- 5.3.3. Aerospace and Defense
- 5.3.4. Pipes and Tanks
- 5.3.5. Construction
- 5.3.6. Electrical and Electronics
- 5.3.7. Sports and Recreation
- 5.3.8. Other End-use Applications
- 5.4. Market Analysis, Insights and Forecast - by Region
- 5.4.1. Asia Pacific
- 5.4.2. North America
- 5.4.3. Europe
- 5.4.4. South America
- 5.4.5. Middle East and Africa
- 5.1. Market Analysis, Insights and Forecast - by Matrix Material
- 6. Global Composites Industry Analysis, Insights and Forecast, 2021-2033
- 6.1. Market Analysis, Insights and Forecast - by Matrix Material
- 6.1.1. Polymer Matrix Composites (PMC)
- 6.1.1.1. Thermoset Resins
- 6.1.1.2. Thermoplastic Resins
- 6.1.2. Ceramic/Carbon Matrix Composites (CMCs)
- 6.1.3. Other Matrices (Metal Matrix Composites)
- 6.1.1. Polymer Matrix Composites (PMC)
- 6.2. Market Analysis, Insights and Forecast - by Reinforcement Fiber
- 6.2.1. Glass Fiber
- 6.2.2. Carbon Fiber
- 6.2.3. Aramid Fiber
- 6.2.4. Other Fibers
- 6.3. Market Analysis, Insights and Forecast - by End-use Application
- 6.3.1. Automotive and Transportation
- 6.3.2. Wind Energy
- 6.3.3. Aerospace and Defense
- 6.3.4. Pipes and Tanks
- 6.3.5. Construction
- 6.3.6. Electrical and Electronics
- 6.3.7. Sports and Recreation
- 6.3.8. Other End-use Applications
- 6.1. Market Analysis, Insights and Forecast - by Matrix Material
- 7. Asia Pacific Composites Industry Analysis, Insights and Forecast, 2020-2032
- 7.1. Market Analysis, Insights and Forecast - by Matrix Material
- 7.1.1. Polymer Matrix Composites (PMC)
- 7.1.1.1. Thermoset Resins
- 7.1.1.2. Thermoplastic Resins
- 7.1.2. Ceramic/Carbon Matrix Composites (CMCs)
- 7.1.3. Other Matrices (Metal Matrix Composites)
- 7.1.1. Polymer Matrix Composites (PMC)
- 7.2. Market Analysis, Insights and Forecast - by Reinforcement Fiber
- 7.2.1. Glass Fiber
- 7.2.2. Carbon Fiber
- 7.2.3. Aramid Fiber
- 7.2.4. Other Fibers
- 7.3. Market Analysis, Insights and Forecast - by End-use Application
- 7.3.1. Automotive and Transportation
- 7.3.2. Wind Energy
- 7.3.3. Aerospace and Defense
- 7.3.4. Pipes and Tanks
- 7.3.5. Construction
- 7.3.6. Electrical and Electronics
- 7.3.7. Sports and Recreation
- 7.3.8. Other End-use Applications
- 7.1. Market Analysis, Insights and Forecast - by Matrix Material
- 8. North America Composites Industry Analysis, Insights and Forecast, 2020-2032
- 8.1. Market Analysis, Insights and Forecast - by Matrix Material
- 8.1.1. Polymer Matrix Composites (PMC)
- 8.1.1.1. Thermoset Resins
- 8.1.1.2. Thermoplastic Resins
- 8.1.2. Ceramic/Carbon Matrix Composites (CMCs)
- 8.1.3. Other Matrices (Metal Matrix Composites)
- 8.1.1. Polymer Matrix Composites (PMC)
- 8.2. Market Analysis, Insights and Forecast - by Reinforcement Fiber
- 8.2.1. Glass Fiber
- 8.2.2. Carbon Fiber
- 8.2.3. Aramid Fiber
- 8.2.4. Other Fibers
- 8.3. Market Analysis, Insights and Forecast - by End-use Application
- 8.3.1. Automotive and Transportation
- 8.3.2. Wind Energy
- 8.3.3. Aerospace and Defense
- 8.3.4. Pipes and Tanks
- 8.3.5. Construction
- 8.3.6. Electrical and Electronics
- 8.3.7. Sports and Recreation
- 8.3.8. Other End-use Applications
- 8.1. Market Analysis, Insights and Forecast - by Matrix Material
- 9. Europe Composites Industry Analysis, Insights and Forecast, 2020-2032
- 9.1. Market Analysis, Insights and Forecast - by Matrix Material
- 9.1.1. Polymer Matrix Composites (PMC)
- 9.1.1.1. Thermoset Resins
- 9.1.1.2. Thermoplastic Resins
- 9.1.2. Ceramic/Carbon Matrix Composites (CMCs)
- 9.1.3. Other Matrices (Metal Matrix Composites)
- 9.1.1. Polymer Matrix Composites (PMC)
- 9.2. Market Analysis, Insights and Forecast - by Reinforcement Fiber
- 9.2.1. Glass Fiber
- 9.2.2. Carbon Fiber
- 9.2.3. Aramid Fiber
- 9.2.4. Other Fibers
- 9.3. Market Analysis, Insights and Forecast - by End-use Application
- 9.3.1. Automotive and Transportation
- 9.3.2. Wind Energy
- 9.3.3. Aerospace and Defense
- 9.3.4. Pipes and Tanks
- 9.3.5. Construction
- 9.3.6. Electrical and Electronics
- 9.3.7. Sports and Recreation
- 9.3.8. Other End-use Applications
- 9.1. Market Analysis, Insights and Forecast - by Matrix Material
- 10. South America Composites Industry Analysis, Insights and Forecast, 2020-2032
- 10.1. Market Analysis, Insights and Forecast - by Matrix Material
- 10.1.1. Polymer Matrix Composites (PMC)
- 10.1.1.1. Thermoset Resins
- 10.1.1.2. Thermoplastic Resins
- 10.1.2. Ceramic/Carbon Matrix Composites (CMCs)
- 10.1.3. Other Matrices (Metal Matrix Composites)
- 10.1.1. Polymer Matrix Composites (PMC)
- 10.2. Market Analysis, Insights and Forecast - by Reinforcement Fiber
- 10.2.1. Glass Fiber
- 10.2.2. Carbon Fiber
- 10.2.3. Aramid Fiber
- 10.2.4. Other Fibers
- 10.3. Market Analysis, Insights and Forecast - by End-use Application
- 10.3.1. Automotive and Transportation
- 10.3.2. Wind Energy
- 10.3.3. Aerospace and Defense
- 10.3.4. Pipes and Tanks
- 10.3.5. Construction
- 10.3.6. Electrical and Electronics
- 10.3.7. Sports and Recreation
- 10.3.8. Other End-use Applications
- 10.1. Market Analysis, Insights and Forecast - by Matrix Material
- 11. Middle East and Africa Composites Industry Analysis, Insights and Forecast, 2020-2032
- 11.1. Market Analysis, Insights and Forecast - by Matrix Material
- 11.1.1. Polymer Matrix Composites (PMC)
- 11.1.1.1. Thermoset Resins
- 11.1.1.2. Thermoplastic Resins
- 11.1.2. Ceramic/Carbon Matrix Composites (CMCs)
- 11.1.3. Other Matrices (Metal Matrix Composites)
- 11.1.1. Polymer Matrix Composites (PMC)
- 11.2. Market Analysis, Insights and Forecast - by Reinforcement Fiber
- 11.2.1. Glass Fiber
- 11.2.2. Carbon Fiber
- 11.2.3. Aramid Fiber
- 11.2.4. Other Fibers
- 11.3. Market Analysis, Insights and Forecast - by End-use Application
- 11.3.1. Automotive and Transportation
- 11.3.2. Wind Energy
- 11.3.3. Aerospace and Defense
- 11.3.4. Pipes and Tanks
- 11.3.5. Construction
- 11.3.6. Electrical and Electronics
- 11.3.7. Sports and Recreation
- 11.3.8. Other End-use Applications
- 11.1. Market Analysis, Insights and Forecast - by Matrix Material
- 12. Competitive Analysis
- 12.1. Company Profiles
- 12.1.1 SGL Carbon
- 12.1.1.1. Company Overview
- 12.1.1.2. Products
- 12.1.1.3. Company Financials
- 12.1.1.4. SWOT Analysis
- 12.1.2 COMPOSITES UNIVERSAL GROUP
- 12.1.2.1. Company Overview
- 12.1.2.2. Products
- 12.1.2.3. Company Financials
- 12.1.2.4. SWOT Analysis
- 12.1.3 Solvay
- 12.1.3.1. Company Overview
- 12.1.3.2. Products
- 12.1.3.3. Company Financials
- 12.1.3.4. SWOT Analysis
- 12.1.4 3M
- 12.1.4.1. Company Overview
- 12.1.4.2. Products
- 12.1.4.3. Company Financials
- 12.1.4.4. SWOT Analysis
- 12.1.5 DIT B V
- 12.1.5.1. Company Overview
- 12.1.5.2. Products
- 12.1.5.3. Company Financials
- 12.1.5.4. SWOT Analysis
- 12.1.6 Owens Corning
- 12.1.6.1. Company Overview
- 12.1.6.2. Products
- 12.1.6.3. Company Financials
- 12.1.6.4. SWOT Analysis
- 12.1.7 DuPont
- 12.1.7.1. Company Overview
- 12.1.7.2. Products
- 12.1.7.3. Company Financials
- 12.1.7.4. SWOT Analysis
- 12.1.8 TORAY INDUSTRIES INC *List Not Exhaustive
- 12.1.8.1. Company Overview
- 12.1.8.2. Products
- 12.1.8.3. Company Financials
- 12.1.8.4. SWOT Analysis
- 12.1.9 Mitsubishi Chemical Group Corporation
- 12.1.9.1. Company Overview
- 12.1.9.2. Products
- 12.1.9.3. Company Financials
- 12.1.9.4. SWOT Analysis
- 12.1.10 Hexcel Corporation
- 12.1.10.1. Company Overview
- 12.1.10.2. Products
- 12.1.10.3. Company Financials
- 12.1.10.4. SWOT Analysis
- 12.1.11 TEIJIN LIMITED
- 12.1.11.1. Company Overview
- 12.1.11.2. Products
- 12.1.11.3. Company Financials
- 12.1.11.4. SWOT Analysis
- 12.1.12 Materion Corporation
- 12.1.12.1. Company Overview
- 12.1.12.2. Products
- 12.1.12.3. Company Financials
- 12.1.12.4. SWOT Analysis
- 12.1.1 SGL Carbon
- 12.2. Market Entropy
- 12.2.1 Company's Key Areas Served
- 12.2.2 Recent Developments
- 12.3. Company Market Share Analysis 2025
- 12.3.1 Top 5 Companies Market Share Analysis
- 12.3.2 Top 3 Companies Market Share Analysis
- 12.4. List of Potential Customers
- 13. Research Methodology
List of Figures
- Figure 1: Global Composites Industry Revenue Breakdown (Million, %) by Region 2025 & 2033
- Figure 2: Asia Pacific Composites Industry Revenue (Million), by Matrix Material 2025 & 2033
- Figure 3: Asia Pacific Composites Industry Revenue Share (%), by Matrix Material 2025 & 2033
- Figure 4: Asia Pacific Composites Industry Revenue (Million), by Reinforcement Fiber 2025 & 2033
- Figure 5: Asia Pacific Composites Industry Revenue Share (%), by Reinforcement Fiber 2025 & 2033
- Figure 6: Asia Pacific Composites Industry Revenue (Million), by End-use Application 2025 & 2033
- Figure 7: Asia Pacific Composites Industry Revenue Share (%), by End-use Application 2025 & 2033
- Figure 8: Asia Pacific Composites Industry Revenue (Million), by Country 2025 & 2033
- Figure 9: Asia Pacific Composites Industry Revenue Share (%), by Country 2025 & 2033
- Figure 10: North America Composites Industry Revenue (Million), by Matrix Material 2025 & 2033
- Figure 11: North America Composites Industry Revenue Share (%), by Matrix Material 2025 & 2033
- Figure 12: North America Composites Industry Revenue (Million), by Reinforcement Fiber 2025 & 2033
- Figure 13: North America Composites Industry Revenue Share (%), by Reinforcement Fiber 2025 & 2033
- Figure 14: North America Composites Industry Revenue (Million), by End-use Application 2025 & 2033
- Figure 15: North America Composites Industry Revenue Share (%), by End-use Application 2025 & 2033
- Figure 16: North America Composites Industry Revenue (Million), by Country 2025 & 2033
- Figure 17: North America Composites Industry Revenue Share (%), by Country 2025 & 2033
- Figure 18: Europe Composites Industry Revenue (Million), by Matrix Material 2025 & 2033
- Figure 19: Europe Composites Industry Revenue Share (%), by Matrix Material 2025 & 2033
- Figure 20: Europe Composites Industry Revenue (Million), by Reinforcement Fiber 2025 & 2033
- Figure 21: Europe Composites Industry Revenue Share (%), by Reinforcement Fiber 2025 & 2033
- Figure 22: Europe Composites Industry Revenue (Million), by End-use Application 2025 & 2033
- Figure 23: Europe Composites Industry Revenue Share (%), by End-use Application 2025 & 2033
- Figure 24: Europe Composites Industry Revenue (Million), by Country 2025 & 2033
- Figure 25: Europe Composites Industry Revenue Share (%), by Country 2025 & 2033
- Figure 26: South America Composites Industry Revenue (Million), by Matrix Material 2025 & 2033
- Figure 27: South America Composites Industry Revenue Share (%), by Matrix Material 2025 & 2033
- Figure 28: South America Composites Industry Revenue (Million), by Reinforcement Fiber 2025 & 2033
- Figure 29: South America Composites Industry Revenue Share (%), by Reinforcement Fiber 2025 & 2033
- Figure 30: South America Composites Industry Revenue (Million), by End-use Application 2025 & 2033
- Figure 31: South America Composites Industry Revenue Share (%), by End-use Application 2025 & 2033
- Figure 32: South America Composites Industry Revenue (Million), by Country 2025 & 2033
- Figure 33: South America Composites Industry Revenue Share (%), by Country 2025 & 2033
- Figure 34: Middle East and Africa Composites Industry Revenue (Million), by Matrix Material 2025 & 2033
- Figure 35: Middle East and Africa Composites Industry Revenue Share (%), by Matrix Material 2025 & 2033
- Figure 36: Middle East and Africa Composites Industry Revenue (Million), by Reinforcement Fiber 2025 & 2033
- Figure 37: Middle East and Africa Composites Industry Revenue Share (%), by Reinforcement Fiber 2025 & 2033
- Figure 38: Middle East and Africa Composites Industry Revenue (Million), by End-use Application 2025 & 2033
- Figure 39: Middle East and Africa Composites Industry Revenue Share (%), by End-use Application 2025 & 2033
- Figure 40: Middle East and Africa Composites Industry Revenue (Million), by Country 2025 & 2033
- Figure 41: Middle East and Africa Composites Industry Revenue Share (%), by Country 2025 & 2033
List of Tables
- Table 1: Global Composites Industry Revenue Million Forecast, by Matrix Material 2020 & 2033
- Table 2: Global Composites Industry Revenue Million Forecast, by Reinforcement Fiber 2020 & 2033
- Table 3: Global Composites Industry Revenue Million Forecast, by End-use Application 2020 & 2033
- Table 4: Global Composites Industry Revenue Million Forecast, by Region 2020 & 2033
- Table 5: Global Composites Industry Revenue Million Forecast, by Matrix Material 2020 & 2033
- Table 6: Global Composites Industry Revenue Million Forecast, by Reinforcement Fiber 2020 & 2033
- Table 7: Global Composites Industry Revenue Million Forecast, by End-use Application 2020 & 2033
- Table 8: Global Composites Industry Revenue Million Forecast, by Country 2020 & 2033
- Table 9: China Composites Industry Revenue (Million) Forecast, by Application 2020 & 2033
- Table 10: India Composites Industry Revenue (Million) Forecast, by Application 2020 & 2033
- Table 11: Japan Composites Industry Revenue (Million) Forecast, by Application 2020 & 2033
- Table 12: South Korea Composites Industry Revenue (Million) Forecast, by Application 2020 & 2033
- Table 13: Thailand Composites Industry Revenue (Million) Forecast, by Application 2020 & 2033
- Table 14: Malaysia Composites Industry Revenue (Million) Forecast, by Application 2020 & 2033
- Table 15: Indonesia Composites Industry Revenue (Million) Forecast, by Application 2020 & 2033
- Table 16: Vietnam Composites Industry Revenue (Million) Forecast, by Application 2020 & 2033
- Table 17: Rest of Asia Pacific Composites Industry Revenue (Million) Forecast, by Application 2020 & 2033
- Table 18: Global Composites Industry Revenue Million Forecast, by Matrix Material 2020 & 2033
- Table 19: Global Composites Industry Revenue Million Forecast, by Reinforcement Fiber 2020 & 2033
- Table 20: Global Composites Industry Revenue Million Forecast, by End-use Application 2020 & 2033
- Table 21: Global Composites Industry Revenue Million Forecast, by Country 2020 & 2033
- Table 22: United States Composites Industry Revenue (Million) Forecast, by Application 2020 & 2033
- Table 23: Canada Composites Industry Revenue (Million) Forecast, by Application 2020 & 2033
- Table 24: Mexico Composites Industry Revenue (Million) Forecast, by Application 2020 & 2033
- Table 25: Global Composites Industry Revenue Million Forecast, by Matrix Material 2020 & 2033
- Table 26: Global Composites Industry Revenue Million Forecast, by Reinforcement Fiber 2020 & 2033
- Table 27: Global Composites Industry Revenue Million Forecast, by End-use Application 2020 & 2033
- Table 28: Global Composites Industry Revenue Million Forecast, by Country 2020 & 2033
- Table 29: Germany Composites Industry Revenue (Million) Forecast, by Application 2020 & 2033
- Table 30: United Kingdom Composites Industry Revenue (Million) Forecast, by Application 2020 & 2033
- Table 31: France Composites Industry Revenue (Million) Forecast, by Application 2020 & 2033
- Table 32: Italy Composites Industry Revenue (Million) Forecast, by Application 2020 & 2033
- Table 33: Spain Composites Industry Revenue (Million) Forecast, by Application 2020 & 2033
- Table 34: Russia Composites Industry Revenue (Million) Forecast, by Application 2020 & 2033
- Table 35: NORDIC Countries Composites Industry Revenue (Million) Forecast, by Application 2020 & 2033
- Table 36: Turkey Composites Industry Revenue (Million) Forecast, by Application 2020 & 2033
- Table 37: Rest of Europe Composites Industry Revenue (Million) Forecast, by Application 2020 & 2033
- Table 38: Global Composites Industry Revenue Million Forecast, by Matrix Material 2020 & 2033
- Table 39: Global Composites Industry Revenue Million Forecast, by Reinforcement Fiber 2020 & 2033
- Table 40: Global Composites Industry Revenue Million Forecast, by End-use Application 2020 & 2033
- Table 41: Global Composites Industry Revenue Million Forecast, by Country 2020 & 2033
- Table 42: Brazil Composites Industry Revenue (Million) Forecast, by Application 2020 & 2033
- Table 43: Argentina Composites Industry Revenue (Million) Forecast, by Application 2020 & 2033
- Table 44: Colombia Composites Industry Revenue (Million) Forecast, by Application 2020 & 2033
- Table 45: Rest of South America Composites Industry Revenue (Million) Forecast, by Application 2020 & 2033
- Table 46: Global Composites Industry Revenue Million Forecast, by Matrix Material 2020 & 2033
- Table 47: Global Composites Industry Revenue Million Forecast, by Reinforcement Fiber 2020 & 2033
- Table 48: Global Composites Industry Revenue Million Forecast, by End-use Application 2020 & 2033
- Table 49: Global Composites Industry Revenue Million Forecast, by Country 2020 & 2033
- Table 50: Saudi Arabia Composites Industry Revenue (Million) Forecast, by Application 2020 & 2033
- Table 51: South Africa Composites Industry Revenue (Million) Forecast, by Application 2020 & 2033
- Table 52: Nigeria Composites Industry Revenue (Million) Forecast, by Application 2020 & 2033
- Table 53: Qatar Composites Industry Revenue (Million) Forecast, by Application 2020 & 2033
- Table 54: Egypt Composites Industry Revenue (Million) Forecast, by Application 2020 & 2033
- Table 55: United Arab Emirates Composites Industry Revenue (Million) Forecast, by Application 2020 & 2033
- Table 56: Rest of Middle East and Africa Composites Industry Revenue (Million) Forecast, by Application 2020 & 2033
Frequently Asked Questions
1. What is the projected Compound Annual Growth Rate (CAGR) of the Composites Industry?
The projected CAGR is approximately > 5.00%.
2. Which companies are prominent players in the Composites Industry?
Key companies in the market include SGL Carbon, COMPOSITES UNIVERSAL GROUP, Solvay, 3M, DIT B V, Owens Corning, DuPont, TORAY INDUSTRIES INC *List Not Exhaustive, Mitsubishi Chemical Group Corporation, Hexcel Corporation, TEIJIN LIMITED, Materion Corporation.
3. What are the main segments of the Composites Industry?
The market segments include Matrix Material, Reinforcement Fiber, End-use Application.
4. Can you provide details about the market size?
The market size is estimated to be USD 45.96 Million as of 2022.
5. What are some drivers contributing to market growth?
Technological Advancement in the Field of Material Science; Increasing Use of Composites in the Aerospace and Defense Industry; Other Drivers.
6. What are the notable trends driving market growth?
Rising Demand from Transportation sector.
7. Are there any restraints impacting market growth?
High Cost of Composite Materials.
8. Can you provide examples of recent developments in the market?
February 2024 - Owens Corning acquired USD 3.9 billion of Masonite. This acquisition would strengthen the company's position in building and construction materials and the glass reinforcement business within its Composites segment.
9. What pricing options are available for accessing the report?
Pricing options include single-user, multi-user, and enterprise licenses priced at USD 4750, USD 5250, and USD 8750 respectively.
10. Is the market size provided in terms of value or volume?
The market size is provided in terms of value, measured in Million.
11. Are there any specific market keywords associated with the report?
Yes, the market keyword associated with the report is "Composites Industry," which aids in identifying and referencing the specific market segment covered.
12. How do I determine which pricing option suits my needs best?
The pricing options vary based on user requirements and access needs. Individual users may opt for single-user licenses, while businesses requiring broader access may choose multi-user or enterprise licenses for cost-effective access to the report.
13. Are there any additional resources or data provided in the Composites Industry report?
While the report offers comprehensive insights, it's advisable to review the specific contents or supplementary materials provided to ascertain if additional resources or data are available.
14. How can I stay updated on further developments or reports in the Composites Industry?
To stay informed about further developments, trends, and reports in the Composites Industry, consider subscribing to industry newsletters, following relevant companies and organizations, or regularly checking reputable industry news sources and publications.
Methodology
Step 1 - Identification of Relevant Samples Size from Population Database


Step 2 - Approaches for Defining Global Market Size (Value, Volume* & Price*)

Note*: In applicable scenarios
Step 3 - Data Sources
Primary Research
- Web Analytics
- Survey Reports
- Research Institute
- Latest Research Reports
- Opinion Leaders
Secondary Research
- Annual Reports
- White Paper
- Latest Press Release
- Industry Association
- Paid Database
- Investor Presentations

Step 4 - Data Triangulation
Involves using different sources of information in order to increase the validity of a study
These sources are likely to be stakeholders in a program - participants, other researchers, program staff, other community members, and so on.
Then we put all data in single framework & apply various statistical tools to find out the dynamic on the market.
During the analysis stage, feedback from the stakeholder groups would be compared to determine areas of agreement as well as areas of divergence