

Key Insights
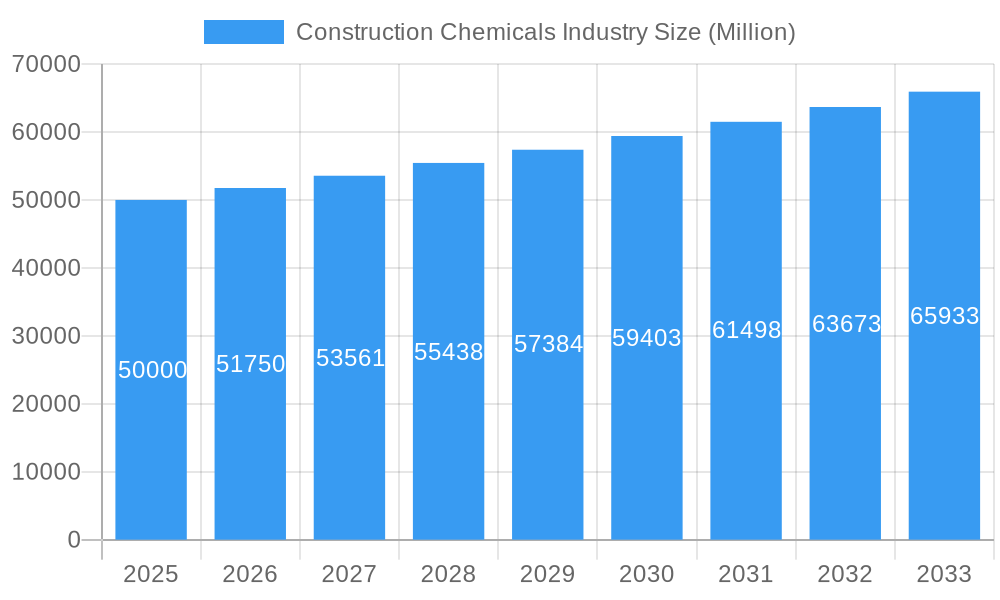
The global construction chemicals market is forecasted to reach $11411.4 million by 2025, with a projected Compound Annual Growth Rate (CAGR) of 5.27% from 2025 to 2033. This robust growth is driven by extensive infrastructure development worldwide, particularly in rapidly urbanizing and industrializing emerging economies. Increased government investment in infrastructure projects, alongside a growing demand for sustainable and high-performance building materials, is fueling market expansion. Technological innovations are introducing novel, eco-friendly, and high-performance construction chemicals, such as smart concrete, advanced polymers, and bio-based alternatives, enhancing both construction efficiency and environmental sustainability. The residential sector also presents significant opportunities, supported by population growth and rising disposable incomes. However, volatility in raw material prices and economic downturns may pose market challenges. The market is segmented by end-use (commercial, industrial & institutional, infrastructure, residential) and product type (adhesives, membranes, sealants, coatings, concrete additives). Leading companies including Henkel, Arkema, Saint-Gobain, and Sika are strategically positioned to capitalize on this growth through their extensive product portfolios and global presence. Asia-Pacific is anticipated to be a key growth engine due to its significant construction activity.
Construction Chemicals Industry Market Size (In Billion)
The competitive environment features both large multinational corporations and regional entities. Mergers, acquisitions, and a strong emphasis on research and development will likely shape future market dynamics. Companies are focusing on product differentiation through innovation, sustainability, and supply chain resilience to maintain a competitive advantage. The market's future trajectory is contingent upon global economic stability, infrastructure investment levels, and continuous technological advancements within the construction chemicals sector. The imperative shift towards sustainable and environmentally friendly products presents a substantial opportunity for agile and innovative market participants poised to meet the evolving demands of the construction industry.
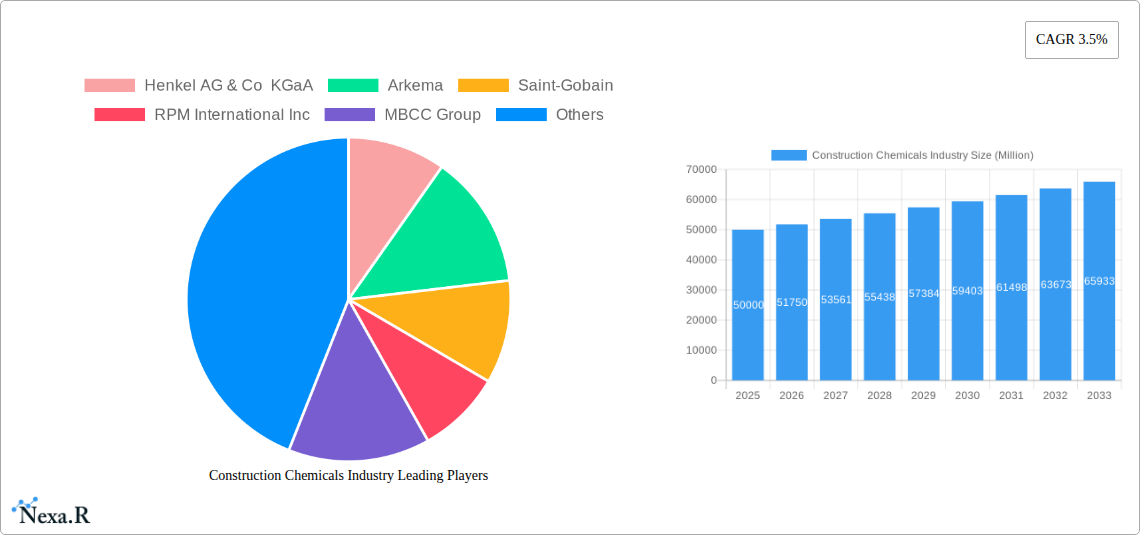
Construction Chemicals Industry Company Market Share
Construction Chemicals Industry Market Report: 2019-2033
This comprehensive report provides an in-depth analysis of the Construction Chemicals industry, encompassing market dynamics, growth trends, regional dominance, product landscape, and key players shaping the future. With a study period spanning 2019-2033, a base year of 2025, and a forecast period of 2025-2033, this report offers invaluable insights for industry professionals, investors, and stakeholders. The report's detailed segmentation covers key end-use sectors (Commercial, Industrial & Institutional, Infrastructure, Residential) and product categories (Adhesives, Membranes, Sealants, Coatings, Concrete Additives). The global market size in 2025 is estimated at XX Million.
Construction Chemicals Industry Market Dynamics & Structure
The construction chemicals market is characterized by moderate concentration, with key players like Henkel, Sika, and Saint-Gobain holding significant market share. Technological innovation, driven by the demand for sustainable and high-performance materials, is a major driver. Stringent regulatory frameworks concerning environmental impact and safety standards significantly influence product development and market entry. Competitive pressures from substitutes, such as bio-based alternatives, are also notable. The market is further shaped by end-user demographics, with a growing focus on infrastructure projects in developing economies. M&A activity has been robust, illustrated by Sika's acquisition of MBCC Group in 2023.
- Market Concentration: Highly concentrated, with the top 5 players holding approximately xx% market share in 2025.
- Technological Innovation: Focus on sustainable, high-performance materials, driven by environmental regulations and demand for improved efficiency.
- Regulatory Landscape: Stringent environmental and safety standards influence product formulations and manufacturing processes.
- Competitive Substitutes: Emergence of bio-based alternatives and recycled materials is creating competition.
- M&A Activity: Significant M&A activity, including Sika's acquisition of MBCC Group, shaping market consolidation and competitive landscape. Total M&A deal value in 2024 estimated at xx Million.
Construction Chemicals Industry Growth Trends & Insights
The construction chemicals market experienced robust growth during the historical period (2019-2024), driven by increasing construction activity globally. The market is projected to continue its expansion, with a Compound Annual Growth Rate (CAGR) of xx% during the forecast period (2025-2033). This growth is fueled by rising urbanization, infrastructure development, and increasing demand for energy-efficient and sustainable buildings. Technological advancements such as the introduction of smart concrete and self-healing materials are disrupting traditional construction methods, driving adoption of innovative construction chemicals. Consumer behavior is shifting towards eco-friendly and high-performance products, creating opportunities for manufacturers to offer sustainable solutions. Market penetration of advanced construction chemicals in developing economies remains relatively low, offering significant growth potential.
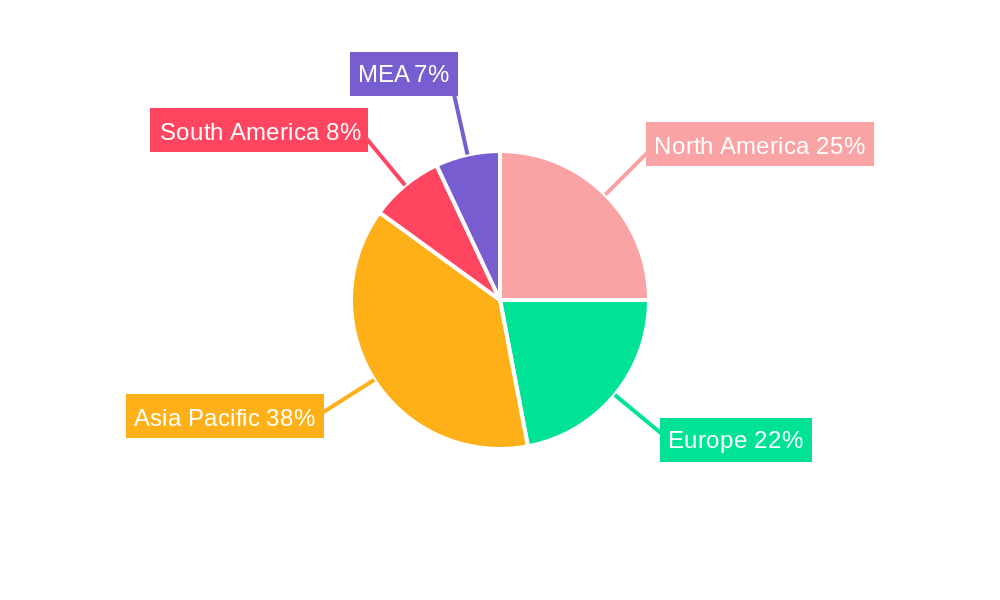
Dominant Regions, Countries, or Segments in Construction Chemicals Industry
The Asia-Pacific region is projected to be the leading market for construction chemicals during the forecast period, driven by rapid urbanization and significant infrastructure investments. China and India are key contributors to this growth. The infrastructure segment holds significant market share, driven by large-scale government investments in transportation, energy, and water management projects. The adhesives and sealants segments are also experiencing high demand due to their crucial role in various construction applications.
Key Regional Drivers:
- Asia-Pacific: Rapid urbanization, robust infrastructure development, and increasing construction activity.
- North America: Renovation projects and investments in sustainable building technologies.
- Europe: Focus on energy efficiency and sustainable construction practices.
Dominant Segments:
- Infrastructure: Large-scale projects driving high demand for construction chemicals.
- Adhesives: Wide range of applications in construction and increasing demand for high-performance adhesives.
- Sealants: Essential for waterproofing and weatherproofing applications.
Construction Chemicals Industry Product Landscape
The construction chemicals market offers a diverse range of products tailored to specific applications. Innovation focuses on enhanced performance, durability, and sustainability. Products like self-leveling compounds, high-performance grouts, and waterproof membranes highlight the technological advancements. Key selling propositions include improved strength, reduced curing time, and enhanced resistance to environmental factors.
Key Drivers, Barriers & Challenges in Construction Chemicals Industry
Key Drivers:
- Rising global construction activity
- Increasing demand for sustainable and energy-efficient buildings
- Technological advancements leading to improved product performance.
- Government initiatives promoting infrastructure development.
Challenges & Restraints:
- Fluctuations in raw material prices
- Stringent environmental regulations impacting manufacturing processes
- Intense competition among established players and new entrants.
- Supply chain disruptions and logistical challenges. Estimated impact on market growth in 2024: xx Million.
Emerging Opportunities in Construction Chemicals Industry
- Growing demand for green building materials and sustainable construction practices.
- Expansion into untapped markets in developing countries.
- Development of innovative products with enhanced functionality and performance characteristics.
- Adoption of digital technologies, such as 3D printing, to optimize construction processes.
Growth Accelerators in the Construction Chemicals Industry
Technological advancements, strategic partnerships (such as Oriental Yuhong's collaboration), and expansion into new geographical markets are key growth accelerators. The focus on sustainable and high-performance materials will drive future growth. Government policies promoting infrastructure development in developing economies also contribute.
Key Players Shaping the Construction Chemicals Industry Market
- Henkel AG & Co KGaA
- Arkema
- Saint-Gobain
- RPM International Inc
- MBCC Group
- LATICRETE International Inc
- H B Fuller Company
- Fosroc Inc
- CEMEX S A B de C V
- Ardex Group
- Sika A
- MAPEI S p A
- Oriental Yuhong
- MC-Bauchemie
- Jiangsu Subote New Material Co Ltd
Notable Milestones in Construction Chemicals Industry Sector
- May 2023: Oriental Yuhong signed a strategic cooperation agreement with Hebei Aorun Shunda Group, expanding its research capabilities in waterproofing and thermal insulation.
- May 2023: Sika acquired MBCC Group, significantly expanding its market share and product portfolio.
- April 2023: Flowcrete (RPM International Inc.) extended the shelf life of its epoxy flooring resins, improving product efficiency and reducing waste.
In-Depth Construction Chemicals Industry Market Outlook
The construction chemicals market is poised for continued growth, driven by the factors outlined above. Strategic investments in R&D, focus on sustainability, and expansion into emerging markets will be crucial for success. Opportunities exist in developing innovative solutions for smart cities, sustainable infrastructure, and resilient buildings. The market's future trajectory is positive, with significant potential for expansion and innovation.
Construction Chemicals Industry Segmentation
-
1. End Use Sector
- 1.1. Commercial
- 1.2. Industrial and Institutional
- 1.3. Infrastructure
- 1.4. Residential
-
2. Product
-
2.1. Adhesives
-
2.1.1. By Sub Product
- 2.1.1.1. Hot Melt
- 2.1.1.2. Reactive
- 2.1.1.3. Solvent-borne
- 2.1.1.4. Water-borne
-
2.1.1. By Sub Product
-
2.2. Anchors and Grouts
- 2.2.1. Cementitious Fixing
- 2.2.2. Resin Fixing
- 2.2.3. Other Types
-
2.3. Concrete Admixtures
- 2.3.1. Accelerator
- 2.3.2. Air Entraining Admixture
- 2.3.3. High Range Water Reducer (Super Plasticizer)
- 2.3.4. Retarder
- 2.3.5. Shrinkage Reducing Admixture
- 2.3.6. Viscosity Modifier
- 2.3.7. Water Reducer (Plasticizer)
-
2.4. Concrete Protective Coatings
- 2.4.1. Acrylic
- 2.4.2. Alkyd
- 2.4.3. Epoxy
- 2.4.4. Polyurethane
- 2.4.5. Other Resin Types
-
2.5. Flooring Resins
- 2.5.1. Polyaspartic
-
2.6. Repair and Rehabilitation Chemicals
- 2.6.1. Fiber Wrapping Systems
- 2.6.2. Injection Grouting Materials
- 2.6.3. Micro-concrete Mortars
- 2.6.4. Modified Mortars
- 2.6.5. Rebar Protectors
-
2.7. Sealants
- 2.7.1. Silicone
-
2.8. Surface Treatment Chemicals
- 2.8.1. Curing Compounds
- 2.8.2. Mold Release Agents
- 2.8.3. Other Product Types
-
2.9. Waterproofing Solutions
- 2.9.1. Membranes
-
2.1. Adhesives
Construction Chemicals Industry Segmentation By Geography
-
1. North America
- 1.1. United States
- 1.2. Canada
- 1.3. Mexico
-
2. South America
- 2.1. Brazil
- 2.2. Argentina
- 2.3. Rest of South America
-
3. Europe
- 3.1. United Kingdom
- 3.2. Germany
- 3.3. France
- 3.4. Italy
- 3.5. Spain
- 3.6. Russia
- 3.7. Benelux
- 3.8. Nordics
- 3.9. Rest of Europe
-
4. Middle East & Africa
- 4.1. Turkey
- 4.2. Israel
- 4.3. GCC
- 4.4. North Africa
- 4.5. South Africa
- 4.6. Rest of Middle East & Africa
-
5. Asia Pacific
- 5.1. China
- 5.2. India
- 5.3. Japan
- 5.4. South Korea
- 5.5. ASEAN
- 5.6. Oceania
- 5.7. Rest of Asia Pacific
Construction Chemicals Industry Regional Market Share
Geographic Coverage of Construction Chemicals Industry
Construction Chemicals Industry REPORT HIGHLIGHTS
| Aspects | Details |
|---|---|
| Study Period | 2020-2034 |
| Base Year | 2025 |
| Estimated Year | 2026 |
| Forecast Period | 2026-2034 |
| Historical Period | 2020-2025 |
| Growth Rate | CAGR of 5.27% from 2020-2034 |
| Segmentation |
|
Table of Contents
- 1. Introduction
- 1.1. Research Scope
- 1.2. Market Segmentation
- 1.3. Research Objective
- 1.4. Definitions and Assumptions
- 2. Executive Summary
- 2.1. Market Snapshot
- 3. Market Dynamics
- 3.1. Market Drivers
- 3.2. Market Restrains
- 3.3. Market Trends
- 3.4. Market Opportunities
- 4. Market Factor Analysis
- 4.1. Porters Five Forces
- 4.1.1. Bargaining Power of Suppliers
- 4.1.2. Bargaining Power of Buyers
- 4.1.3. Threat of New Entrants
- 4.1.4. Threat of Substitutes
- 4.1.5. Competitive Rivalry
- 4.2. PESTEL analysis
- 4.3. BCG Analysis
- 4.3.1. Stars (High Growth, High Market Share)
- 4.3.2. Cash Cows (Low Growth, High Market Share)
- 4.3.3. Question Mark (High Growth, Low Market Share)
- 4.3.4. Dogs (Low Growth, Low Market Share)
- 4.4. Ansoff Matrix Analysis
- 4.5. Supply Chain Analysis
- 4.6. Regulatory Landscape
- 4.7. Current Market Potential and Opportunity Assessment (TAM–SAM–SOM Framework)
- 4.8. NRP Analyst Note
- 4.1. Porters Five Forces
- 5. Market Analysis, Insights and Forecast 2021-2033
- 5.1. Market Analysis, Insights and Forecast - by End Use Sector
- 5.1.1. Commercial
- 5.1.2. Industrial and Institutional
- 5.1.3. Infrastructure
- 5.1.4. Residential
- 5.2. Market Analysis, Insights and Forecast - by Product
- 5.2.1. Adhesives
- 5.2.1.1. By Sub Product
- 5.2.1.1.1. Hot Melt
- 5.2.1.1.2. Reactive
- 5.2.1.1.3. Solvent-borne
- 5.2.1.1.4. Water-borne
- 5.2.1.1. By Sub Product
- 5.2.2. Anchors and Grouts
- 5.2.2.1. Cementitious Fixing
- 5.2.2.2. Resin Fixing
- 5.2.2.3. Other Types
- 5.2.3. Concrete Admixtures
- 5.2.3.1. Accelerator
- 5.2.3.2. Air Entraining Admixture
- 5.2.3.3. High Range Water Reducer (Super Plasticizer)
- 5.2.3.4. Retarder
- 5.2.3.5. Shrinkage Reducing Admixture
- 5.2.3.6. Viscosity Modifier
- 5.2.3.7. Water Reducer (Plasticizer)
- 5.2.4. Concrete Protective Coatings
- 5.2.4.1. Acrylic
- 5.2.4.2. Alkyd
- 5.2.4.3. Epoxy
- 5.2.4.4. Polyurethane
- 5.2.4.5. Other Resin Types
- 5.2.5. Flooring Resins
- 5.2.5.1. Polyaspartic
- 5.2.6. Repair and Rehabilitation Chemicals
- 5.2.6.1. Fiber Wrapping Systems
- 5.2.6.2. Injection Grouting Materials
- 5.2.6.3. Micro-concrete Mortars
- 5.2.6.4. Modified Mortars
- 5.2.6.5. Rebar Protectors
- 5.2.7. Sealants
- 5.2.7.1. Silicone
- 5.2.8. Surface Treatment Chemicals
- 5.2.8.1. Curing Compounds
- 5.2.8.2. Mold Release Agents
- 5.2.8.3. Other Product Types
- 5.2.9. Waterproofing Solutions
- 5.2.9.1. Membranes
- 5.2.1. Adhesives
- 5.3. Market Analysis, Insights and Forecast - by Region
- 5.3.1. North America
- 5.3.2. South America
- 5.3.3. Europe
- 5.3.4. Middle East & Africa
- 5.3.5. Asia Pacific
- 5.1. Market Analysis, Insights and Forecast - by End Use Sector
- 6. Global Construction Chemicals Industry Analysis, Insights and Forecast, 2021-2033
- 6.1. Market Analysis, Insights and Forecast - by End Use Sector
- 6.1.1. Commercial
- 6.1.2. Industrial and Institutional
- 6.1.3. Infrastructure
- 6.1.4. Residential
- 6.2. Market Analysis, Insights and Forecast - by Product
- 6.2.1. Adhesives
- 6.2.1.1. By Sub Product
- 6.2.1.1.1. Hot Melt
- 6.2.1.1.2. Reactive
- 6.2.1.1.3. Solvent-borne
- 6.2.1.1.4. Water-borne
- 6.2.1.1. By Sub Product
- 6.2.2. Anchors and Grouts
- 6.2.2.1. Cementitious Fixing
- 6.2.2.2. Resin Fixing
- 6.2.2.3. Other Types
- 6.2.3. Concrete Admixtures
- 6.2.3.1. Accelerator
- 6.2.3.2. Air Entraining Admixture
- 6.2.3.3. High Range Water Reducer (Super Plasticizer)
- 6.2.3.4. Retarder
- 6.2.3.5. Shrinkage Reducing Admixture
- 6.2.3.6. Viscosity Modifier
- 6.2.3.7. Water Reducer (Plasticizer)
- 6.2.4. Concrete Protective Coatings
- 6.2.4.1. Acrylic
- 6.2.4.2. Alkyd
- 6.2.4.3. Epoxy
- 6.2.4.4. Polyurethane
- 6.2.4.5. Other Resin Types
- 6.2.5. Flooring Resins
- 6.2.5.1. Polyaspartic
- 6.2.6. Repair and Rehabilitation Chemicals
- 6.2.6.1. Fiber Wrapping Systems
- 6.2.6.2. Injection Grouting Materials
- 6.2.6.3. Micro-concrete Mortars
- 6.2.6.4. Modified Mortars
- 6.2.6.5. Rebar Protectors
- 6.2.7. Sealants
- 6.2.7.1. Silicone
- 6.2.8. Surface Treatment Chemicals
- 6.2.8.1. Curing Compounds
- 6.2.8.2. Mold Release Agents
- 6.2.8.3. Other Product Types
- 6.2.9. Waterproofing Solutions
- 6.2.9.1. Membranes
- 6.2.1. Adhesives
- 6.1. Market Analysis, Insights and Forecast - by End Use Sector
- 7. North America Construction Chemicals Industry Analysis, Insights and Forecast, 2020-2032
- 7.1. Market Analysis, Insights and Forecast - by End Use Sector
- 7.1.1. Commercial
- 7.1.2. Industrial and Institutional
- 7.1.3. Infrastructure
- 7.1.4. Residential
- 7.2. Market Analysis, Insights and Forecast - by Product
- 7.2.1. Adhesives
- 7.2.1.1. By Sub Product
- 7.2.1.1.1. Hot Melt
- 7.2.1.1.2. Reactive
- 7.2.1.1.3. Solvent-borne
- 7.2.1.1.4. Water-borne
- 7.2.1.1. By Sub Product
- 7.2.2. Anchors and Grouts
- 7.2.2.1. Cementitious Fixing
- 7.2.2.2. Resin Fixing
- 7.2.2.3. Other Types
- 7.2.3. Concrete Admixtures
- 7.2.3.1. Accelerator
- 7.2.3.2. Air Entraining Admixture
- 7.2.3.3. High Range Water Reducer (Super Plasticizer)
- 7.2.3.4. Retarder
- 7.2.3.5. Shrinkage Reducing Admixture
- 7.2.3.6. Viscosity Modifier
- 7.2.3.7. Water Reducer (Plasticizer)
- 7.2.4. Concrete Protective Coatings
- 7.2.4.1. Acrylic
- 7.2.4.2. Alkyd
- 7.2.4.3. Epoxy
- 7.2.4.4. Polyurethane
- 7.2.4.5. Other Resin Types
- 7.2.5. Flooring Resins
- 7.2.5.1. Polyaspartic
- 7.2.6. Repair and Rehabilitation Chemicals
- 7.2.6.1. Fiber Wrapping Systems
- 7.2.6.2. Injection Grouting Materials
- 7.2.6.3. Micro-concrete Mortars
- 7.2.6.4. Modified Mortars
- 7.2.6.5. Rebar Protectors
- 7.2.7. Sealants
- 7.2.7.1. Silicone
- 7.2.8. Surface Treatment Chemicals
- 7.2.8.1. Curing Compounds
- 7.2.8.2. Mold Release Agents
- 7.2.8.3. Other Product Types
- 7.2.9. Waterproofing Solutions
- 7.2.9.1. Membranes
- 7.2.1. Adhesives
- 7.1. Market Analysis, Insights and Forecast - by End Use Sector
- 8. South America Construction Chemicals Industry Analysis, Insights and Forecast, 2020-2032
- 8.1. Market Analysis, Insights and Forecast - by End Use Sector
- 8.1.1. Commercial
- 8.1.2. Industrial and Institutional
- 8.1.3. Infrastructure
- 8.1.4. Residential
- 8.2. Market Analysis, Insights and Forecast - by Product
- 8.2.1. Adhesives
- 8.2.1.1. By Sub Product
- 8.2.1.1.1. Hot Melt
- 8.2.1.1.2. Reactive
- 8.2.1.1.3. Solvent-borne
- 8.2.1.1.4. Water-borne
- 8.2.1.1. By Sub Product
- 8.2.2. Anchors and Grouts
- 8.2.2.1. Cementitious Fixing
- 8.2.2.2. Resin Fixing
- 8.2.2.3. Other Types
- 8.2.3. Concrete Admixtures
- 8.2.3.1. Accelerator
- 8.2.3.2. Air Entraining Admixture
- 8.2.3.3. High Range Water Reducer (Super Plasticizer)
- 8.2.3.4. Retarder
- 8.2.3.5. Shrinkage Reducing Admixture
- 8.2.3.6. Viscosity Modifier
- 8.2.3.7. Water Reducer (Plasticizer)
- 8.2.4. Concrete Protective Coatings
- 8.2.4.1. Acrylic
- 8.2.4.2. Alkyd
- 8.2.4.3. Epoxy
- 8.2.4.4. Polyurethane
- 8.2.4.5. Other Resin Types
- 8.2.5. Flooring Resins
- 8.2.5.1. Polyaspartic
- 8.2.6. Repair and Rehabilitation Chemicals
- 8.2.6.1. Fiber Wrapping Systems
- 8.2.6.2. Injection Grouting Materials
- 8.2.6.3. Micro-concrete Mortars
- 8.2.6.4. Modified Mortars
- 8.2.6.5. Rebar Protectors
- 8.2.7. Sealants
- 8.2.7.1. Silicone
- 8.2.8. Surface Treatment Chemicals
- 8.2.8.1. Curing Compounds
- 8.2.8.2. Mold Release Agents
- 8.2.8.3. Other Product Types
- 8.2.9. Waterproofing Solutions
- 8.2.9.1. Membranes
- 8.2.1. Adhesives
- 8.1. Market Analysis, Insights and Forecast - by End Use Sector
- 9. Europe Construction Chemicals Industry Analysis, Insights and Forecast, 2020-2032
- 9.1. Market Analysis, Insights and Forecast - by End Use Sector
- 9.1.1. Commercial
- 9.1.2. Industrial and Institutional
- 9.1.3. Infrastructure
- 9.1.4. Residential
- 9.2. Market Analysis, Insights and Forecast - by Product
- 9.2.1. Adhesives
- 9.2.1.1. By Sub Product
- 9.2.1.1.1. Hot Melt
- 9.2.1.1.2. Reactive
- 9.2.1.1.3. Solvent-borne
- 9.2.1.1.4. Water-borne
- 9.2.1.1. By Sub Product
- 9.2.2. Anchors and Grouts
- 9.2.2.1. Cementitious Fixing
- 9.2.2.2. Resin Fixing
- 9.2.2.3. Other Types
- 9.2.3. Concrete Admixtures
- 9.2.3.1. Accelerator
- 9.2.3.2. Air Entraining Admixture
- 9.2.3.3. High Range Water Reducer (Super Plasticizer)
- 9.2.3.4. Retarder
- 9.2.3.5. Shrinkage Reducing Admixture
- 9.2.3.6. Viscosity Modifier
- 9.2.3.7. Water Reducer (Plasticizer)
- 9.2.4. Concrete Protective Coatings
- 9.2.4.1. Acrylic
- 9.2.4.2. Alkyd
- 9.2.4.3. Epoxy
- 9.2.4.4. Polyurethane
- 9.2.4.5. Other Resin Types
- 9.2.5. Flooring Resins
- 9.2.5.1. Polyaspartic
- 9.2.6. Repair and Rehabilitation Chemicals
- 9.2.6.1. Fiber Wrapping Systems
- 9.2.6.2. Injection Grouting Materials
- 9.2.6.3. Micro-concrete Mortars
- 9.2.6.4. Modified Mortars
- 9.2.6.5. Rebar Protectors
- 9.2.7. Sealants
- 9.2.7.1. Silicone
- 9.2.8. Surface Treatment Chemicals
- 9.2.8.1. Curing Compounds
- 9.2.8.2. Mold Release Agents
- 9.2.8.3. Other Product Types
- 9.2.9. Waterproofing Solutions
- 9.2.9.1. Membranes
- 9.2.1. Adhesives
- 9.1. Market Analysis, Insights and Forecast - by End Use Sector
- 10. Middle East & Africa Construction Chemicals Industry Analysis, Insights and Forecast, 2020-2032
- 10.1. Market Analysis, Insights and Forecast - by End Use Sector
- 10.1.1. Commercial
- 10.1.2. Industrial and Institutional
- 10.1.3. Infrastructure
- 10.1.4. Residential
- 10.2. Market Analysis, Insights and Forecast - by Product
- 10.2.1. Adhesives
- 10.2.1.1. By Sub Product
- 10.2.1.1.1. Hot Melt
- 10.2.1.1.2. Reactive
- 10.2.1.1.3. Solvent-borne
- 10.2.1.1.4. Water-borne
- 10.2.1.1. By Sub Product
- 10.2.2. Anchors and Grouts
- 10.2.2.1. Cementitious Fixing
- 10.2.2.2. Resin Fixing
- 10.2.2.3. Other Types
- 10.2.3. Concrete Admixtures
- 10.2.3.1. Accelerator
- 10.2.3.2. Air Entraining Admixture
- 10.2.3.3. High Range Water Reducer (Super Plasticizer)
- 10.2.3.4. Retarder
- 10.2.3.5. Shrinkage Reducing Admixture
- 10.2.3.6. Viscosity Modifier
- 10.2.3.7. Water Reducer (Plasticizer)
- 10.2.4. Concrete Protective Coatings
- 10.2.4.1. Acrylic
- 10.2.4.2. Alkyd
- 10.2.4.3. Epoxy
- 10.2.4.4. Polyurethane
- 10.2.4.5. Other Resin Types
- 10.2.5. Flooring Resins
- 10.2.5.1. Polyaspartic
- 10.2.6. Repair and Rehabilitation Chemicals
- 10.2.6.1. Fiber Wrapping Systems
- 10.2.6.2. Injection Grouting Materials
- 10.2.6.3. Micro-concrete Mortars
- 10.2.6.4. Modified Mortars
- 10.2.6.5. Rebar Protectors
- 10.2.7. Sealants
- 10.2.7.1. Silicone
- 10.2.8. Surface Treatment Chemicals
- 10.2.8.1. Curing Compounds
- 10.2.8.2. Mold Release Agents
- 10.2.8.3. Other Product Types
- 10.2.9. Waterproofing Solutions
- 10.2.9.1. Membranes
- 10.2.1. Adhesives
- 10.1. Market Analysis, Insights and Forecast - by End Use Sector
- 11. Asia Pacific Construction Chemicals Industry Analysis, Insights and Forecast, 2020-2032
- 11.1. Market Analysis, Insights and Forecast - by End Use Sector
- 11.1.1. Commercial
- 11.1.2. Industrial and Institutional
- 11.1.3. Infrastructure
- 11.1.4. Residential
- 11.2. Market Analysis, Insights and Forecast - by Product
- 11.2.1. Adhesives
- 11.2.1.1. By Sub Product
- 11.2.1.1.1. Hot Melt
- 11.2.1.1.2. Reactive
- 11.2.1.1.3. Solvent-borne
- 11.2.1.1.4. Water-borne
- 11.2.1.1. By Sub Product
- 11.2.2. Anchors and Grouts
- 11.2.2.1. Cementitious Fixing
- 11.2.2.2. Resin Fixing
- 11.2.2.3. Other Types
- 11.2.3. Concrete Admixtures
- 11.2.3.1. Accelerator
- 11.2.3.2. Air Entraining Admixture
- 11.2.3.3. High Range Water Reducer (Super Plasticizer)
- 11.2.3.4. Retarder
- 11.2.3.5. Shrinkage Reducing Admixture
- 11.2.3.6. Viscosity Modifier
- 11.2.3.7. Water Reducer (Plasticizer)
- 11.2.4. Concrete Protective Coatings
- 11.2.4.1. Acrylic
- 11.2.4.2. Alkyd
- 11.2.4.3. Epoxy
- 11.2.4.4. Polyurethane
- 11.2.4.5. Other Resin Types
- 11.2.5. Flooring Resins
- 11.2.5.1. Polyaspartic
- 11.2.6. Repair and Rehabilitation Chemicals
- 11.2.6.1. Fiber Wrapping Systems
- 11.2.6.2. Injection Grouting Materials
- 11.2.6.3. Micro-concrete Mortars
- 11.2.6.4. Modified Mortars
- 11.2.6.5. Rebar Protectors
- 11.2.7. Sealants
- 11.2.7.1. Silicone
- 11.2.8. Surface Treatment Chemicals
- 11.2.8.1. Curing Compounds
- 11.2.8.2. Mold Release Agents
- 11.2.8.3. Other Product Types
- 11.2.9. Waterproofing Solutions
- 11.2.9.1. Membranes
- 11.2.1. Adhesives
- 11.1. Market Analysis, Insights and Forecast - by End Use Sector
- 12. Competitive Analysis
- 12.1. Company Profiles
- 12.1.1 Henkel AG & Co KGaA
- 12.1.1.1. Company Overview
- 12.1.1.2. Products
- 12.1.1.3. Company Financials
- 12.1.1.4. SWOT Analysis
- 12.1.2 Arkema
- 12.1.2.1. Company Overview
- 12.1.2.2. Products
- 12.1.2.3. Company Financials
- 12.1.2.4. SWOT Analysis
- 12.1.3 Saint-Gobain
- 12.1.3.1. Company Overview
- 12.1.3.2. Products
- 12.1.3.3. Company Financials
- 12.1.3.4. SWOT Analysis
- 12.1.4 RPM International Inc
- 12.1.4.1. Company Overview
- 12.1.4.2. Products
- 12.1.4.3. Company Financials
- 12.1.4.4. SWOT Analysis
- 12.1.5 MBCC Group
- 12.1.5.1. Company Overview
- 12.1.5.2. Products
- 12.1.5.3. Company Financials
- 12.1.5.4. SWOT Analysis
- 12.1.6 LATICRETE International Inc
- 12.1.6.1. Company Overview
- 12.1.6.2. Products
- 12.1.6.3. Company Financials
- 12.1.6.4. SWOT Analysis
- 12.1.7 H B Fuller Company
- 12.1.7.1. Company Overview
- 12.1.7.2. Products
- 12.1.7.3. Company Financials
- 12.1.7.4. SWOT Analysis
- 12.1.8 Fosroc Inc
- 12.1.8.1. Company Overview
- 12.1.8.2. Products
- 12.1.8.3. Company Financials
- 12.1.8.4. SWOT Analysis
- 12.1.9 CEMEX S A B de C V
- 12.1.9.1. Company Overview
- 12.1.9.2. Products
- 12.1.9.3. Company Financials
- 12.1.9.4. SWOT Analysis
- 12.1.10 Ardex Group
- 12.1.10.1. Company Overview
- 12.1.10.2. Products
- 12.1.10.3. Company Financials
- 12.1.10.4. SWOT Analysis
- 12.1.11 Sika A
- 12.1.11.1. Company Overview
- 12.1.11.2. Products
- 12.1.11.3. Company Financials
- 12.1.11.4. SWOT Analysis
- 12.1.12 MAPEI S p A
- 12.1.12.1. Company Overview
- 12.1.12.2. Products
- 12.1.12.3. Company Financials
- 12.1.12.4. SWOT Analysis
- 12.1.13 Oriental Yuhong
- 12.1.13.1. Company Overview
- 12.1.13.2. Products
- 12.1.13.3. Company Financials
- 12.1.13.4. SWOT Analysis
- 12.1.14 MC-Bauchemie
- 12.1.14.1. Company Overview
- 12.1.14.2. Products
- 12.1.14.3. Company Financials
- 12.1.14.4. SWOT Analysis
- 12.1.15 Jiangsu Subote New Material Co Ltd
- 12.1.15.1. Company Overview
- 12.1.15.2. Products
- 12.1.15.3. Company Financials
- 12.1.15.4. SWOT Analysis
- 12.1.1 Henkel AG & Co KGaA
- 12.2. Market Entropy
- 12.2.1 Company's Key Areas Served
- 12.2.2 Recent Developments
- 12.3. Company Market Share Analysis 2025
- 12.3.1 Top 5 Companies Market Share Analysis
- 12.3.2 Top 3 Companies Market Share Analysis
- 12.4. List of Potential Customers
- 13. Research Methodology
List of Figures
- Figure 1: Global Construction Chemicals Industry Revenue Breakdown (million, %) by Region 2025 & 2033
- Figure 2: Global Construction Chemicals Industry Volume Breakdown (K Tons, %) by Region 2025 & 2033
- Figure 3: North America Construction Chemicals Industry Revenue (million), by End Use Sector 2025 & 2033
- Figure 4: North America Construction Chemicals Industry Volume (K Tons), by End Use Sector 2025 & 2033
- Figure 5: North America Construction Chemicals Industry Revenue Share (%), by End Use Sector 2025 & 2033
- Figure 6: North America Construction Chemicals Industry Volume Share (%), by End Use Sector 2025 & 2033
- Figure 7: North America Construction Chemicals Industry Revenue (million), by Product 2025 & 2033
- Figure 8: North America Construction Chemicals Industry Volume (K Tons), by Product 2025 & 2033
- Figure 9: North America Construction Chemicals Industry Revenue Share (%), by Product 2025 & 2033
- Figure 10: North America Construction Chemicals Industry Volume Share (%), by Product 2025 & 2033
- Figure 11: North America Construction Chemicals Industry Revenue (million), by Country 2025 & 2033
- Figure 12: North America Construction Chemicals Industry Volume (K Tons), by Country 2025 & 2033
- Figure 13: North America Construction Chemicals Industry Revenue Share (%), by Country 2025 & 2033
- Figure 14: North America Construction Chemicals Industry Volume Share (%), by Country 2025 & 2033
- Figure 15: South America Construction Chemicals Industry Revenue (million), by End Use Sector 2025 & 2033
- Figure 16: South America Construction Chemicals Industry Volume (K Tons), by End Use Sector 2025 & 2033
- Figure 17: South America Construction Chemicals Industry Revenue Share (%), by End Use Sector 2025 & 2033
- Figure 18: South America Construction Chemicals Industry Volume Share (%), by End Use Sector 2025 & 2033
- Figure 19: South America Construction Chemicals Industry Revenue (million), by Product 2025 & 2033
- Figure 20: South America Construction Chemicals Industry Volume (K Tons), by Product 2025 & 2033
- Figure 21: South America Construction Chemicals Industry Revenue Share (%), by Product 2025 & 2033
- Figure 22: South America Construction Chemicals Industry Volume Share (%), by Product 2025 & 2033
- Figure 23: South America Construction Chemicals Industry Revenue (million), by Country 2025 & 2033
- Figure 24: South America Construction Chemicals Industry Volume (K Tons), by Country 2025 & 2033
- Figure 25: South America Construction Chemicals Industry Revenue Share (%), by Country 2025 & 2033
- Figure 26: South America Construction Chemicals Industry Volume Share (%), by Country 2025 & 2033
- Figure 27: Europe Construction Chemicals Industry Revenue (million), by End Use Sector 2025 & 2033
- Figure 28: Europe Construction Chemicals Industry Volume (K Tons), by End Use Sector 2025 & 2033
- Figure 29: Europe Construction Chemicals Industry Revenue Share (%), by End Use Sector 2025 & 2033
- Figure 30: Europe Construction Chemicals Industry Volume Share (%), by End Use Sector 2025 & 2033
- Figure 31: Europe Construction Chemicals Industry Revenue (million), by Product 2025 & 2033
- Figure 32: Europe Construction Chemicals Industry Volume (K Tons), by Product 2025 & 2033
- Figure 33: Europe Construction Chemicals Industry Revenue Share (%), by Product 2025 & 2033
- Figure 34: Europe Construction Chemicals Industry Volume Share (%), by Product 2025 & 2033
- Figure 35: Europe Construction Chemicals Industry Revenue (million), by Country 2025 & 2033
- Figure 36: Europe Construction Chemicals Industry Volume (K Tons), by Country 2025 & 2033
- Figure 37: Europe Construction Chemicals Industry Revenue Share (%), by Country 2025 & 2033
- Figure 38: Europe Construction Chemicals Industry Volume Share (%), by Country 2025 & 2033
- Figure 39: Middle East & Africa Construction Chemicals Industry Revenue (million), by End Use Sector 2025 & 2033
- Figure 40: Middle East & Africa Construction Chemicals Industry Volume (K Tons), by End Use Sector 2025 & 2033
- Figure 41: Middle East & Africa Construction Chemicals Industry Revenue Share (%), by End Use Sector 2025 & 2033
- Figure 42: Middle East & Africa Construction Chemicals Industry Volume Share (%), by End Use Sector 2025 & 2033
- Figure 43: Middle East & Africa Construction Chemicals Industry Revenue (million), by Product 2025 & 2033
- Figure 44: Middle East & Africa Construction Chemicals Industry Volume (K Tons), by Product 2025 & 2033
- Figure 45: Middle East & Africa Construction Chemicals Industry Revenue Share (%), by Product 2025 & 2033
- Figure 46: Middle East & Africa Construction Chemicals Industry Volume Share (%), by Product 2025 & 2033
- Figure 47: Middle East & Africa Construction Chemicals Industry Revenue (million), by Country 2025 & 2033
- Figure 48: Middle East & Africa Construction Chemicals Industry Volume (K Tons), by Country 2025 & 2033
- Figure 49: Middle East & Africa Construction Chemicals Industry Revenue Share (%), by Country 2025 & 2033
- Figure 50: Middle East & Africa Construction Chemicals Industry Volume Share (%), by Country 2025 & 2033
- Figure 51: Asia Pacific Construction Chemicals Industry Revenue (million), by End Use Sector 2025 & 2033
- Figure 52: Asia Pacific Construction Chemicals Industry Volume (K Tons), by End Use Sector 2025 & 2033
- Figure 53: Asia Pacific Construction Chemicals Industry Revenue Share (%), by End Use Sector 2025 & 2033
- Figure 54: Asia Pacific Construction Chemicals Industry Volume Share (%), by End Use Sector 2025 & 2033
- Figure 55: Asia Pacific Construction Chemicals Industry Revenue (million), by Product 2025 & 2033
- Figure 56: Asia Pacific Construction Chemicals Industry Volume (K Tons), by Product 2025 & 2033
- Figure 57: Asia Pacific Construction Chemicals Industry Revenue Share (%), by Product 2025 & 2033
- Figure 58: Asia Pacific Construction Chemicals Industry Volume Share (%), by Product 2025 & 2033
- Figure 59: Asia Pacific Construction Chemicals Industry Revenue (million), by Country 2025 & 2033
- Figure 60: Asia Pacific Construction Chemicals Industry Volume (K Tons), by Country 2025 & 2033
- Figure 61: Asia Pacific Construction Chemicals Industry Revenue Share (%), by Country 2025 & 2033
- Figure 62: Asia Pacific Construction Chemicals Industry Volume Share (%), by Country 2025 & 2033
List of Tables
- Table 1: Global Construction Chemicals Industry Revenue million Forecast, by End Use Sector 2020 & 2033
- Table 2: Global Construction Chemicals Industry Volume K Tons Forecast, by End Use Sector 2020 & 2033
- Table 3: Global Construction Chemicals Industry Revenue million Forecast, by Product 2020 & 2033
- Table 4: Global Construction Chemicals Industry Volume K Tons Forecast, by Product 2020 & 2033
- Table 5: Global Construction Chemicals Industry Revenue million Forecast, by Region 2020 & 2033
- Table 6: Global Construction Chemicals Industry Volume K Tons Forecast, by Region 2020 & 2033
- Table 7: Global Construction Chemicals Industry Revenue million Forecast, by End Use Sector 2020 & 2033
- Table 8: Global Construction Chemicals Industry Volume K Tons Forecast, by End Use Sector 2020 & 2033
- Table 9: Global Construction Chemicals Industry Revenue million Forecast, by Product 2020 & 2033
- Table 10: Global Construction Chemicals Industry Volume K Tons Forecast, by Product 2020 & 2033
- Table 11: Global Construction Chemicals Industry Revenue million Forecast, by Country 2020 & 2033
- Table 12: Global Construction Chemicals Industry Volume K Tons Forecast, by Country 2020 & 2033
- Table 13: United States Construction Chemicals Industry Revenue (million) Forecast, by Application 2020 & 2033
- Table 14: United States Construction Chemicals Industry Volume (K Tons) Forecast, by Application 2020 & 2033
- Table 15: Canada Construction Chemicals Industry Revenue (million) Forecast, by Application 2020 & 2033
- Table 16: Canada Construction Chemicals Industry Volume (K Tons) Forecast, by Application 2020 & 2033
- Table 17: Mexico Construction Chemicals Industry Revenue (million) Forecast, by Application 2020 & 2033
- Table 18: Mexico Construction Chemicals Industry Volume (K Tons) Forecast, by Application 2020 & 2033
- Table 19: Global Construction Chemicals Industry Revenue million Forecast, by End Use Sector 2020 & 2033
- Table 20: Global Construction Chemicals Industry Volume K Tons Forecast, by End Use Sector 2020 & 2033
- Table 21: Global Construction Chemicals Industry Revenue million Forecast, by Product 2020 & 2033
- Table 22: Global Construction Chemicals Industry Volume K Tons Forecast, by Product 2020 & 2033
- Table 23: Global Construction Chemicals Industry Revenue million Forecast, by Country 2020 & 2033
- Table 24: Global Construction Chemicals Industry Volume K Tons Forecast, by Country 2020 & 2033
- Table 25: Brazil Construction Chemicals Industry Revenue (million) Forecast, by Application 2020 & 2033
- Table 26: Brazil Construction Chemicals Industry Volume (K Tons) Forecast, by Application 2020 & 2033
- Table 27: Argentina Construction Chemicals Industry Revenue (million) Forecast, by Application 2020 & 2033
- Table 28: Argentina Construction Chemicals Industry Volume (K Tons) Forecast, by Application 2020 & 2033
- Table 29: Rest of South America Construction Chemicals Industry Revenue (million) Forecast, by Application 2020 & 2033
- Table 30: Rest of South America Construction Chemicals Industry Volume (K Tons) Forecast, by Application 2020 & 2033
- Table 31: Global Construction Chemicals Industry Revenue million Forecast, by End Use Sector 2020 & 2033
- Table 32: Global Construction Chemicals Industry Volume K Tons Forecast, by End Use Sector 2020 & 2033
- Table 33: Global Construction Chemicals Industry Revenue million Forecast, by Product 2020 & 2033
- Table 34: Global Construction Chemicals Industry Volume K Tons Forecast, by Product 2020 & 2033
- Table 35: Global Construction Chemicals Industry Revenue million Forecast, by Country 2020 & 2033
- Table 36: Global Construction Chemicals Industry Volume K Tons Forecast, by Country 2020 & 2033
- Table 37: United Kingdom Construction Chemicals Industry Revenue (million) Forecast, by Application 2020 & 2033
- Table 38: United Kingdom Construction Chemicals Industry Volume (K Tons) Forecast, by Application 2020 & 2033
- Table 39: Germany Construction Chemicals Industry Revenue (million) Forecast, by Application 2020 & 2033
- Table 40: Germany Construction Chemicals Industry Volume (K Tons) Forecast, by Application 2020 & 2033
- Table 41: France Construction Chemicals Industry Revenue (million) Forecast, by Application 2020 & 2033
- Table 42: France Construction Chemicals Industry Volume (K Tons) Forecast, by Application 2020 & 2033
- Table 43: Italy Construction Chemicals Industry Revenue (million) Forecast, by Application 2020 & 2033
- Table 44: Italy Construction Chemicals Industry Volume (K Tons) Forecast, by Application 2020 & 2033
- Table 45: Spain Construction Chemicals Industry Revenue (million) Forecast, by Application 2020 & 2033
- Table 46: Spain Construction Chemicals Industry Volume (K Tons) Forecast, by Application 2020 & 2033
- Table 47: Russia Construction Chemicals Industry Revenue (million) Forecast, by Application 2020 & 2033
- Table 48: Russia Construction Chemicals Industry Volume (K Tons) Forecast, by Application 2020 & 2033
- Table 49: Benelux Construction Chemicals Industry Revenue (million) Forecast, by Application 2020 & 2033
- Table 50: Benelux Construction Chemicals Industry Volume (K Tons) Forecast, by Application 2020 & 2033
- Table 51: Nordics Construction Chemicals Industry Revenue (million) Forecast, by Application 2020 & 2033
- Table 52: Nordics Construction Chemicals Industry Volume (K Tons) Forecast, by Application 2020 & 2033
- Table 53: Rest of Europe Construction Chemicals Industry Revenue (million) Forecast, by Application 2020 & 2033
- Table 54: Rest of Europe Construction Chemicals Industry Volume (K Tons) Forecast, by Application 2020 & 2033
- Table 55: Global Construction Chemicals Industry Revenue million Forecast, by End Use Sector 2020 & 2033
- Table 56: Global Construction Chemicals Industry Volume K Tons Forecast, by End Use Sector 2020 & 2033
- Table 57: Global Construction Chemicals Industry Revenue million Forecast, by Product 2020 & 2033
- Table 58: Global Construction Chemicals Industry Volume K Tons Forecast, by Product 2020 & 2033
- Table 59: Global Construction Chemicals Industry Revenue million Forecast, by Country 2020 & 2033
- Table 60: Global Construction Chemicals Industry Volume K Tons Forecast, by Country 2020 & 2033
- Table 61: Turkey Construction Chemicals Industry Revenue (million) Forecast, by Application 2020 & 2033
- Table 62: Turkey Construction Chemicals Industry Volume (K Tons) Forecast, by Application 2020 & 2033
- Table 63: Israel Construction Chemicals Industry Revenue (million) Forecast, by Application 2020 & 2033
- Table 64: Israel Construction Chemicals Industry Volume (K Tons) Forecast, by Application 2020 & 2033
- Table 65: GCC Construction Chemicals Industry Revenue (million) Forecast, by Application 2020 & 2033
- Table 66: GCC Construction Chemicals Industry Volume (K Tons) Forecast, by Application 2020 & 2033
- Table 67: North Africa Construction Chemicals Industry Revenue (million) Forecast, by Application 2020 & 2033
- Table 68: North Africa Construction Chemicals Industry Volume (K Tons) Forecast, by Application 2020 & 2033
- Table 69: South Africa Construction Chemicals Industry Revenue (million) Forecast, by Application 2020 & 2033
- Table 70: South Africa Construction Chemicals Industry Volume (K Tons) Forecast, by Application 2020 & 2033
- Table 71: Rest of Middle East & Africa Construction Chemicals Industry Revenue (million) Forecast, by Application 2020 & 2033
- Table 72: Rest of Middle East & Africa Construction Chemicals Industry Volume (K Tons) Forecast, by Application 2020 & 2033
- Table 73: Global Construction Chemicals Industry Revenue million Forecast, by End Use Sector 2020 & 2033
- Table 74: Global Construction Chemicals Industry Volume K Tons Forecast, by End Use Sector 2020 & 2033
- Table 75: Global Construction Chemicals Industry Revenue million Forecast, by Product 2020 & 2033
- Table 76: Global Construction Chemicals Industry Volume K Tons Forecast, by Product 2020 & 2033
- Table 77: Global Construction Chemicals Industry Revenue million Forecast, by Country 2020 & 2033
- Table 78: Global Construction Chemicals Industry Volume K Tons Forecast, by Country 2020 & 2033
- Table 79: China Construction Chemicals Industry Revenue (million) Forecast, by Application 2020 & 2033
- Table 80: China Construction Chemicals Industry Volume (K Tons) Forecast, by Application 2020 & 2033
- Table 81: India Construction Chemicals Industry Revenue (million) Forecast, by Application 2020 & 2033
- Table 82: India Construction Chemicals Industry Volume (K Tons) Forecast, by Application 2020 & 2033
- Table 83: Japan Construction Chemicals Industry Revenue (million) Forecast, by Application 2020 & 2033
- Table 84: Japan Construction Chemicals Industry Volume (K Tons) Forecast, by Application 2020 & 2033
- Table 85: South Korea Construction Chemicals Industry Revenue (million) Forecast, by Application 2020 & 2033
- Table 86: South Korea Construction Chemicals Industry Volume (K Tons) Forecast, by Application 2020 & 2033
- Table 87: ASEAN Construction Chemicals Industry Revenue (million) Forecast, by Application 2020 & 2033
- Table 88: ASEAN Construction Chemicals Industry Volume (K Tons) Forecast, by Application 2020 & 2033
- Table 89: Oceania Construction Chemicals Industry Revenue (million) Forecast, by Application 2020 & 2033
- Table 90: Oceania Construction Chemicals Industry Volume (K Tons) Forecast, by Application 2020 & 2033
- Table 91: Rest of Asia Pacific Construction Chemicals Industry Revenue (million) Forecast, by Application 2020 & 2033
- Table 92: Rest of Asia Pacific Construction Chemicals Industry Volume (K Tons) Forecast, by Application 2020 & 2033
Frequently Asked Questions
1. What is the projected Compound Annual Growth Rate (CAGR) of the Construction Chemicals Industry?
The projected CAGR is approximately 5.27%.
2. Which companies are prominent players in the Construction Chemicals Industry?
Key companies in the market include Henkel AG & Co KGaA, Arkema, Saint-Gobain, RPM International Inc, MBCC Group, LATICRETE International Inc, H B Fuller Company, Fosroc Inc, CEMEX S A B de C V, Ardex Group, Sika A, MAPEI S p A, Oriental Yuhong, MC-Bauchemie, Jiangsu Subote New Material Co Ltd.
3. What are the main segments of the Construction Chemicals Industry?
The market segments include End Use Sector, Product.
4. Can you provide details about the market size?
The market size is estimated to be USD 11411.4 million as of 2022.
5. What are some drivers contributing to market growth?
; Banning/ Limiting Use of Plastics used in packaging applications.
6. What are the notable trends driving market growth?
OTHER KEY INDUSTRY TRENDS COVERED IN THE REPORT.
7. Are there any restraints impacting market growth?
; Harmful Amines in Dyes; Paperless Green Initiatives.
8. Can you provide examples of recent developments in the market?
May 2023: Oriental Yuhong signed a strategic cooperation agreement with Hebei Aorun Shunda Group to collaborate on multi-dimensional research in the fields of waterproofing membranes and thermal insulation coatings, among other solutions.May 2023: Sika, a global leader in construction chemicals, acquired the MBCC Group, including its waterproofing solutions, anchors & grouts, flooring resins, repair & rehabilitation chemicals, and other businesses, with the exception of its concrete admixture operations in Europe, North America, Australia, and New Zealand.April 2023: Flowcrete, a subsidiary of RPM International Inc., announced that it has extended the shelf life of its epoxy flooring resin products, which can now be stored for an extra 12 months from the previously specified dates without compromising their quality or performance.
9. What pricing options are available for accessing the report?
Pricing options include single-user, multi-user, and enterprise licenses priced at USD 3800, USD 4500, and USD 5800 respectively.
10. Is the market size provided in terms of value or volume?
The market size is provided in terms of value, measured in million and volume, measured in K Tons.
11. Are there any specific market keywords associated with the report?
Yes, the market keyword associated with the report is "Construction Chemicals Industry," which aids in identifying and referencing the specific market segment covered.
12. How do I determine which pricing option suits my needs best?
The pricing options vary based on user requirements and access needs. Individual users may opt for single-user licenses, while businesses requiring broader access may choose multi-user or enterprise licenses for cost-effective access to the report.
13. Are there any additional resources or data provided in the Construction Chemicals Industry report?
While the report offers comprehensive insights, it's advisable to review the specific contents or supplementary materials provided to ascertain if additional resources or data are available.
14. How can I stay updated on further developments or reports in the Construction Chemicals Industry?
To stay informed about further developments, trends, and reports in the Construction Chemicals Industry, consider subscribing to industry newsletters, following relevant companies and organizations, or regularly checking reputable industry news sources and publications.
Methodology
Step 1 - Identification of Relevant Samples Size from Population Database


Step 2 - Approaches for Defining Global Market Size (Value, Volume* & Price*)

Note*: In applicable scenarios
Step 3 - Data Sources
Primary Research
- Web Analytics
- Survey Reports
- Research Institute
- Latest Research Reports
- Opinion Leaders
Secondary Research
- Annual Reports
- White Paper
- Latest Press Release
- Industry Association
- Paid Database
- Investor Presentations

Step 4 - Data Triangulation
Involves using different sources of information in order to increase the validity of a study
These sources are likely to be stakeholders in a program - participants, other researchers, program staff, other community members, and so on.
Then we put all data in single framework & apply various statistical tools to find out the dynamic on the market.
During the analysis stage, feedback from the stakeholder groups would be compared to determine areas of agreement as well as areas of divergence