

Key Insights
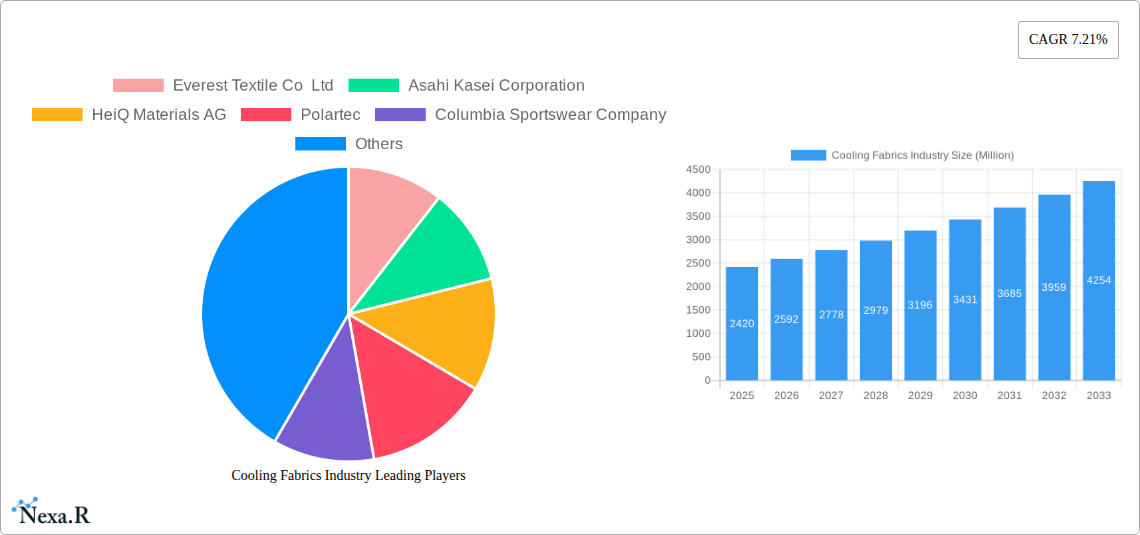
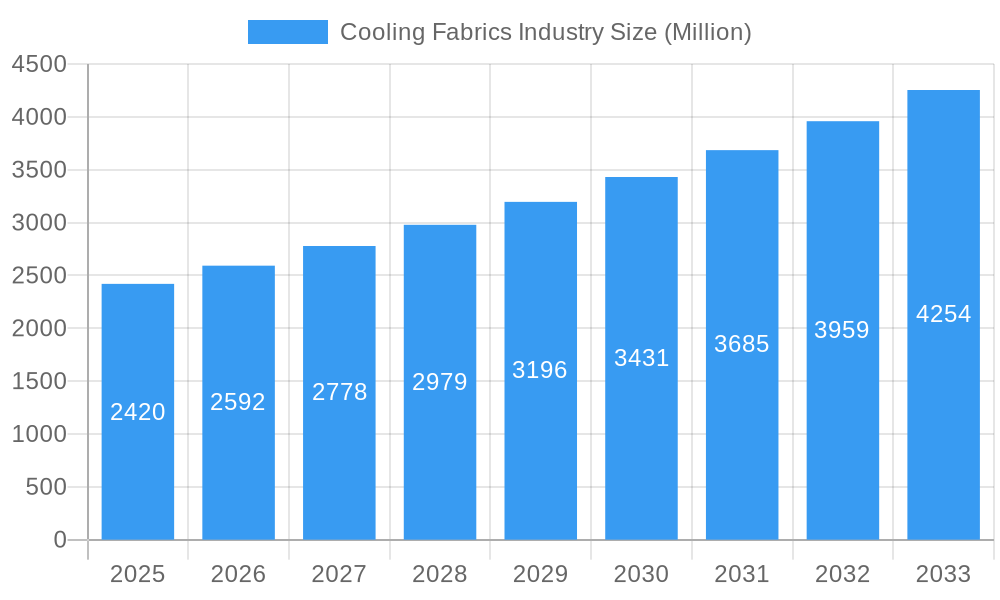
The global cooling fabrics market, valued at $2.42 billion in 2025, is projected to experience robust growth, driven by increasing demand for athletic and outdoor apparel, coupled with rising consumer awareness of thermal comfort and performance. The market's 7.21% CAGR indicates a significant expansion through 2033, fueled by several key factors. The sportswear segment is a major contributor, with technological advancements leading to lighter, more breathable, and moisture-wicking fabrics. The rise of eco-conscious consumers is driving demand for natural cooling fabrics, while advancements in synthetic materials are providing improved performance and durability. Regional growth is expected to be diverse, with Asia Pacific, particularly China and India, leading the charge due to burgeoning sportswear and apparel industries and a large population base. North America and Europe also contribute significantly, driven by strong consumer spending and established athletic apparel markets. However, fluctuating raw material prices and the potential for synthetic fabric environmental concerns pose challenges to market expansion. The increasing integration of cooling technologies into medical and protective wear further broadens the market's scope. Competition is intense, with established players like Asahi Kasei and innovative companies like HeiQ Materials continuously developing advanced cooling technologies and expanding their product portfolios.
Cooling Fabrics Industry Market Size (In Billion)
The continued growth of the cooling fabrics market hinges on several factors including ongoing innovation in fabric technology, sustainability concerns driving the development of eco-friendly options, and the expansion of e-commerce channels. The market is also influenced by shifts in consumer preferences towards functional apparel that provides comfort and performance benefits. The ongoing development of specialized cooling fabrics for niche applications, such as medical textiles and protective gear for extreme environments, is expected to open new avenues for growth. This market segmentation, coupled with the geographic diversification of production and demand, positions the cooling fabrics market for sustained and profitable expansion in the coming years.
Cooling Fabrics Industry Company Market Share
Cooling Fabrics Industry Market Report: 2019-2033
This comprehensive report provides a detailed analysis of the Cooling Fabrics industry, encompassing market dynamics, growth trends, regional segmentation, product landscape, and key players. The report covers the period 2019-2033, with a focus on the forecast period 2025-2033 and a base year of 2025. Market values are presented in million units. This in-depth study is crucial for industry professionals, investors, and stakeholders seeking to understand the evolving landscape of this dynamic sector.
Cooling Fabrics Industry Market Dynamics & Structure
The cooling fabrics market is characterized by moderate concentration, with key players like Asahi Kasei Corporation, NILIT, and Polartec holding significant market share (estimated xx%). Technological innovation, particularly in materials science and manufacturing processes, is a major driver, alongside increasing consumer demand for comfort and performance apparel. Stringent environmental regulations are shaping the industry, pushing for sustainable and eco-friendly materials. The market faces competition from traditional fabrics and emerging alternatives, while M&A activity remains moderate, with xx deals recorded between 2019 and 2024.
- Market Concentration: Moderately concentrated, with top 5 players holding xx% market share.
- Technological Innovation: Focus on sustainable materials (recycled nylon, bio-based fibers), improved wicking and breathability, and antimicrobial properties.
- Regulatory Framework: Growing emphasis on sustainability certifications (e.g., GOTS, OEKO-TEX) and environmental impact assessments.
- Competitive Substitutes: Traditional fabrics (cotton, polyester), other performance fabrics (moisture-wicking, temperature-regulating).
- End-User Demographics: Primarily driven by athletic and outdoor enthusiasts, but expanding to broader consumer segments seeking comfort and functionality.
- M&A Trends: Moderate activity, with xx deals (approx. xx million units in value) between 2019 and 2024, primarily focused on expanding product portfolios and geographic reach.
Cooling Fabrics Industry Growth Trends & Insights
The cooling fabrics market experienced significant growth between 2019 and 2024, driven by increasing consumer demand for athletic apparel, protective wear, and comfortable clothing across various climatic conditions. The market size expanded from xx million units in 2019 to xx million units in 2024, exhibiting a CAGR of xx%. Technological disruptions, such as the development of innovative materials with enhanced cooling properties, are accelerating adoption rates. Changing consumer preferences, including a greater focus on sustainability and ethical sourcing, are also shaping market trends. The market penetration of cooling fabrics in the apparel sector is projected to reach xx% by 2033, fueled by the rising popularity of sportswear and active lifestyles. The forecast period (2025-2033) anticipates a CAGR of xx%, driven by continued technological advancements and expanding application areas.
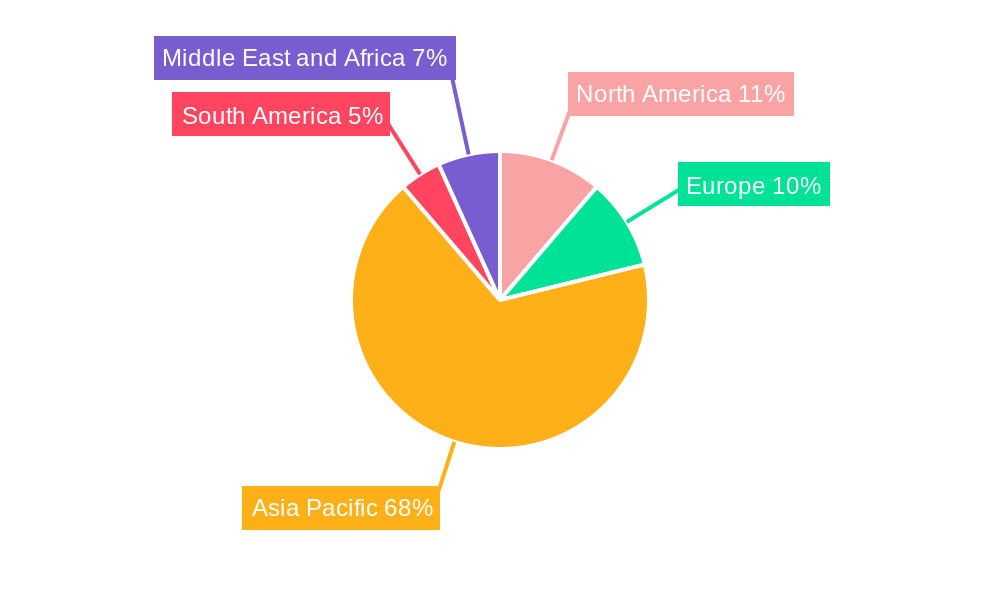
Dominant Regions, Countries, or Segments in Cooling Fabrics Industry
The North American market currently holds a dominant position in the cooling fabrics industry, accounting for approximately xx% of the global market share in 2024. This dominance is driven by high consumer spending on athletic apparel, technological advancements, and a strong presence of key players. The Asia-Pacific region shows significant growth potential, driven by increasing disposable incomes and a burgeoning sportswear market. Within segments, the sportswear application is currently the largest, capturing xx% of the market, followed by apparel (xx%). The synthetic type holds the largest market share (xx%), fueled by its cost-effectiveness and performance advantages. Knitted fabric types dominate due to their comfort and flexibility.
- North America: High consumer spending, strong industry presence, advanced technological capabilities.
- Asia-Pacific: Rapidly growing sportswear market, increasing disposable incomes, potential for market expansion.
- Europe: Strong focus on sustainability, high demand for eco-friendly cooling fabrics.
- Sportswear Segment: Highest demand due to increased participation in sports and outdoor activities.
- Synthetic Fabrics: Cost-effectiveness, superior performance characteristics compared to natural fibers.
- Knitted Fabrics: Superior comfort, breathability, and flexibility compared to other fabric types.
Cooling Fabrics Industry Product Landscape
The cooling fabrics market offers a diverse range of products, including woven, knitted, and non-woven fabrics made from natural and synthetic materials. Innovative products focus on enhanced wicking capabilities, breathability, and temperature regulation, often incorporating technologies like phase-change materials or advanced fiber structures. Unique selling propositions include sustainable materials, antimicrobial properties, and customizable performance features tailored to specific applications. Technological advancements are constantly pushing boundaries, improving comfort, durability, and overall performance.
Key Drivers, Barriers & Challenges in Cooling Fabrics Industry
Key Drivers:
- Increasing demand for athletic and performance apparel.
- Growing consumer awareness of comfort and functionality.
- Technological advancements in materials science and manufacturing processes.
- Rising adoption of sustainable and eco-friendly materials.
Challenges & Restraints:
- Fluctuations in raw material prices impacting production costs.
- Intense competition from existing and emerging fabric technologies.
- Potential supply chain disruptions impacting production timelines and availability.
- Regulatory hurdles and compliance requirements in certain regions.
Emerging Opportunities in Cooling Fabrics Industry
- Expansion into untapped markets (e.g., medical textiles, protective gear for extreme environments).
- Development of innovative applications (e.g., smart fabrics, personalized cooling systems).
- Growing demand for sustainable and recycled materials.
- Customization and personalization of cooling fabrics based on individual needs.
Growth Accelerators in the Cooling Fabrics Industry
Technological breakthroughs in material science, such as the development of advanced cooling fibers and sustainable manufacturing processes, are poised to drive long-term growth. Strategic partnerships between fabric manufacturers and apparel brands will also accelerate market expansion. Increased investment in research and development is crucial for developing innovative and high-performance cooling fabrics.
Key Players Shaping the Cooling Fabrics Industry Market
- Everest Textile Co Ltd
- Asahi Kasei Corporation
- HeiQ Materials AG
- Polartec
- Columbia Sportswear Company
- Formosa Taffeta Co Ltd
- NILIT
- Coolcore
- NAN YA PLASTICS CORPORATION
- Burlington
- Wilson Fabrics
- Balavigna Weaving Mills Pvt Ltd
Notable Milestones in Cooling Fabrics Industry Sector
- January 2023: NILIT launched a new version of SENSIL EcoCare recycled Nylon 6.6 manufactured completely from US materials at its North American facility in Martinsville, VA. This significantly improved the sustainability profile of their offerings and potentially broadened their market access.
- March 2023: NILIT earned the International Sustainability and Carbon Certification Plus system (ISCC+) accreditation for its primary brand SENSIL ByNature, which manufactures cooling fabrics. This strengthened its brand reputation and opened up new market opportunities for its sustainable products.
In-Depth Cooling Fabrics Industry Market Outlook
The cooling fabrics market is poised for continued growth driven by technological innovation, increasing consumer demand, and expanding application areas. Strategic partnerships, focus on sustainability, and aggressive R&D investments will define the competitive landscape. Future market potential is significant, with opportunities in specialized segments like medical textiles and advanced performance apparel. The market presents attractive opportunities for players with a strong focus on innovation, sustainability, and efficient supply chains.
Cooling Fabrics Industry Segmentation
-
1. Type
- 1.1. Natural
- 1.2. Synthetic
-
2. Fabric Type
- 2.1. Woven
- 2.2. Non-woven
- 2.3. Knitted
-
3. Application
- 3.1. Sportswear
- 3.2. Protective Wear
- 3.3. Apparels
- 3.4. Others (Medical, etc.)
Cooling Fabrics Industry Segmentation By Geography
-
1. Asia Pacific
- 1.1. China
- 1.2. India
- 1.3. Japan
- 1.4. South Korea
- 1.5. Rest of Asia Pacific
-
2. North America
- 2.1. United States
- 2.2. Canada
- 2.3. Mexico
-
3. Europe
- 3.1. Germany
- 3.2. United Kingdom
- 3.3. Italy
- 3.4. France
- 3.5. Rest of Europe
-
4. South America
- 4.1. Brazil
- 4.2. Argentina
- 4.3. Rest of South America
-
5. Middle East and Africa
- 5.1. Saudi Arabia
- 5.2. South Africa
- 5.3. Rest of Middle East and Africa
Cooling Fabrics Industry Regional Market Share
Geographic Coverage of Cooling Fabrics Industry
Cooling Fabrics Industry REPORT HIGHLIGHTS
| Aspects | Details |
|---|---|
| Study Period | 2020-2034 |
| Base Year | 2025 |
| Estimated Year | 2026 |
| Forecast Period | 2026-2034 |
| Historical Period | 2020-2025 |
| Growth Rate | CAGR of 7.21% from 2020-2034 |
| Segmentation |
|
Table of Contents
- 1. Introduction
- 1.1. Research Scope
- 1.2. Market Segmentation
- 1.3. Research Methodology
- 1.4. Definitions and Assumptions
- 2. Executive Summary
- 2.1. Introduction
- 3. Market Dynamics
- 3.1. Introduction
- 3.2. Market Drivers
- 3.2.1. Growing Demand for Synthetic Fabrics; Increasing Demand for Sportwear Fabrics; Other Drivers
- 3.3. Market Restrains
- 3.3.1. High Cost of Cooling Fabrics; Other Restraints
- 3.4. Market Trends
- 3.4.1. Increasing Demand from Sportswear Application
- 4. Market Factor Analysis
- 4.1. Porters Five Forces
- 4.2. Supply/Value Chain
- 4.3. PESTEL analysis
- 4.4. Market Entropy
- 4.5. Patent/Trademark Analysis
- 5. Global Cooling Fabrics Industry Analysis, Insights and Forecast, 2020-2032
- 5.1. Market Analysis, Insights and Forecast - by Type
- 5.1.1. Natural
- 5.1.2. Synthetic
- 5.2. Market Analysis, Insights and Forecast - by Fabric Type
- 5.2.1. Woven
- 5.2.2. Non-woven
- 5.2.3. Knitted
- 5.3. Market Analysis, Insights and Forecast - by Application
- 5.3.1. Sportswear
- 5.3.2. Protective Wear
- 5.3.3. Apparels
- 5.3.4. Others (Medical, etc.)
- 5.4. Market Analysis, Insights and Forecast - by Region
- 5.4.1. Asia Pacific
- 5.4.2. North America
- 5.4.3. Europe
- 5.4.4. South America
- 5.4.5. Middle East and Africa
- 5.1. Market Analysis, Insights and Forecast - by Type
- 6. Asia Pacific Cooling Fabrics Industry Analysis, Insights and Forecast, 2020-2032
- 6.1. Market Analysis, Insights and Forecast - by Type
- 6.1.1. Natural
- 6.1.2. Synthetic
- 6.2. Market Analysis, Insights and Forecast - by Fabric Type
- 6.2.1. Woven
- 6.2.2. Non-woven
- 6.2.3. Knitted
- 6.3. Market Analysis, Insights and Forecast - by Application
- 6.3.1. Sportswear
- 6.3.2. Protective Wear
- 6.3.3. Apparels
- 6.3.4. Others (Medical, etc.)
- 6.1. Market Analysis, Insights and Forecast - by Type
- 7. North America Cooling Fabrics Industry Analysis, Insights and Forecast, 2020-2032
- 7.1. Market Analysis, Insights and Forecast - by Type
- 7.1.1. Natural
- 7.1.2. Synthetic
- 7.2. Market Analysis, Insights and Forecast - by Fabric Type
- 7.2.1. Woven
- 7.2.2. Non-woven
- 7.2.3. Knitted
- 7.3. Market Analysis, Insights and Forecast - by Application
- 7.3.1. Sportswear
- 7.3.2. Protective Wear
- 7.3.3. Apparels
- 7.3.4. Others (Medical, etc.)
- 7.1. Market Analysis, Insights and Forecast - by Type
- 8. Europe Cooling Fabrics Industry Analysis, Insights and Forecast, 2020-2032
- 8.1. Market Analysis, Insights and Forecast - by Type
- 8.1.1. Natural
- 8.1.2. Synthetic
- 8.2. Market Analysis, Insights and Forecast - by Fabric Type
- 8.2.1. Woven
- 8.2.2. Non-woven
- 8.2.3. Knitted
- 8.3. Market Analysis, Insights and Forecast - by Application
- 8.3.1. Sportswear
- 8.3.2. Protective Wear
- 8.3.3. Apparels
- 8.3.4. Others (Medical, etc.)
- 8.1. Market Analysis, Insights and Forecast - by Type
- 9. South America Cooling Fabrics Industry Analysis, Insights and Forecast, 2020-2032
- 9.1. Market Analysis, Insights and Forecast - by Type
- 9.1.1. Natural
- 9.1.2. Synthetic
- 9.2. Market Analysis, Insights and Forecast - by Fabric Type
- 9.2.1. Woven
- 9.2.2. Non-woven
- 9.2.3. Knitted
- 9.3. Market Analysis, Insights and Forecast - by Application
- 9.3.1. Sportswear
- 9.3.2. Protective Wear
- 9.3.3. Apparels
- 9.3.4. Others (Medical, etc.)
- 9.1. Market Analysis, Insights and Forecast - by Type
- 10. Middle East and Africa Cooling Fabrics Industry Analysis, Insights and Forecast, 2020-2032
- 10.1. Market Analysis, Insights and Forecast - by Type
- 10.1.1. Natural
- 10.1.2. Synthetic
- 10.2. Market Analysis, Insights and Forecast - by Fabric Type
- 10.2.1. Woven
- 10.2.2. Non-woven
- 10.2.3. Knitted
- 10.3. Market Analysis, Insights and Forecast - by Application
- 10.3.1. Sportswear
- 10.3.2. Protective Wear
- 10.3.3. Apparels
- 10.3.4. Others (Medical, etc.)
- 10.1. Market Analysis, Insights and Forecast - by Type
- 11. Competitive Analysis
- 11.1. Global Market Share Analysis 2025
- 11.2. Company Profiles
- 11.2.1 Everest Textile Co Ltd
- 11.2.1.1. Overview
- 11.2.1.2. Products
- 11.2.1.3. SWOT Analysis
- 11.2.1.4. Recent Developments
- 11.2.1.5. Financials (Based on Availability)
- 11.2.2 Asahi Kasei Corporation
- 11.2.2.1. Overview
- 11.2.2.2. Products
- 11.2.2.3. SWOT Analysis
- 11.2.2.4. Recent Developments
- 11.2.2.5. Financials (Based on Availability)
- 11.2.3 HeiQ Materials AG
- 11.2.3.1. Overview
- 11.2.3.2. Products
- 11.2.3.3. SWOT Analysis
- 11.2.3.4. Recent Developments
- 11.2.3.5. Financials (Based on Availability)
- 11.2.4 Polartec
- 11.2.4.1. Overview
- 11.2.4.2. Products
- 11.2.4.3. SWOT Analysis
- 11.2.4.4. Recent Developments
- 11.2.4.5. Financials (Based on Availability)
- 11.2.5 Columbia Sportswear Company
- 11.2.5.1. Overview
- 11.2.5.2. Products
- 11.2.5.3. SWOT Analysis
- 11.2.5.4. Recent Developments
- 11.2.5.5. Financials (Based on Availability)
- 11.2.6 Formosa Taffeta Co Ltd
- 11.2.6.1. Overview
- 11.2.6.2. Products
- 11.2.6.3. SWOT Analysis
- 11.2.6.4. Recent Developments
- 11.2.6.5. Financials (Based on Availability)
- 11.2.7 NILIT
- 11.2.7.1. Overview
- 11.2.7.2. Products
- 11.2.7.3. SWOT Analysis
- 11.2.7.4. Recent Developments
- 11.2.7.5. Financials (Based on Availability)
- 11.2.8 Coolcore
- 11.2.8.1. Overview
- 11.2.8.2. Products
- 11.2.8.3. SWOT Analysis
- 11.2.8.4. Recent Developments
- 11.2.8.5. Financials (Based on Availability)
- 11.2.9 NAN YA PLASTICS CORPORATION
- 11.2.9.1. Overview
- 11.2.9.2. Products
- 11.2.9.3. SWOT Analysis
- 11.2.9.4. Recent Developments
- 11.2.9.5. Financials (Based on Availability)
- 11.2.10 Burlington
- 11.2.10.1. Overview
- 11.2.10.2. Products
- 11.2.10.3. SWOT Analysis
- 11.2.10.4. Recent Developments
- 11.2.10.5. Financials (Based on Availability)
- 11.2.11 Wilson Fabrics
- 11.2.11.1. Overview
- 11.2.11.2. Products
- 11.2.11.3. SWOT Analysis
- 11.2.11.4. Recent Developments
- 11.2.11.5. Financials (Based on Availability)
- 11.2.12 Balavigna Weaving Mills Pvt Ltd
- 11.2.12.1. Overview
- 11.2.12.2. Products
- 11.2.12.3. SWOT Analysis
- 11.2.12.4. Recent Developments
- 11.2.12.5. Financials (Based on Availability)
- 11.2.1 Everest Textile Co Ltd
List of Figures
- Figure 1: Global Cooling Fabrics Industry Revenue Breakdown (Million, %) by Region 2025 & 2033
- Figure 2: Global Cooling Fabrics Industry Volume Breakdown (K Tons, %) by Region 2025 & 2033
- Figure 3: Asia Pacific Cooling Fabrics Industry Revenue (Million), by Type 2025 & 2033
- Figure 4: Asia Pacific Cooling Fabrics Industry Volume (K Tons), by Type 2025 & 2033
- Figure 5: Asia Pacific Cooling Fabrics Industry Revenue Share (%), by Type 2025 & 2033
- Figure 6: Asia Pacific Cooling Fabrics Industry Volume Share (%), by Type 2025 & 2033
- Figure 7: Asia Pacific Cooling Fabrics Industry Revenue (Million), by Fabric Type 2025 & 2033
- Figure 8: Asia Pacific Cooling Fabrics Industry Volume (K Tons), by Fabric Type 2025 & 2033
- Figure 9: Asia Pacific Cooling Fabrics Industry Revenue Share (%), by Fabric Type 2025 & 2033
- Figure 10: Asia Pacific Cooling Fabrics Industry Volume Share (%), by Fabric Type 2025 & 2033
- Figure 11: Asia Pacific Cooling Fabrics Industry Revenue (Million), by Application 2025 & 2033
- Figure 12: Asia Pacific Cooling Fabrics Industry Volume (K Tons), by Application 2025 & 2033
- Figure 13: Asia Pacific Cooling Fabrics Industry Revenue Share (%), by Application 2025 & 2033
- Figure 14: Asia Pacific Cooling Fabrics Industry Volume Share (%), by Application 2025 & 2033
- Figure 15: Asia Pacific Cooling Fabrics Industry Revenue (Million), by Country 2025 & 2033
- Figure 16: Asia Pacific Cooling Fabrics Industry Volume (K Tons), by Country 2025 & 2033
- Figure 17: Asia Pacific Cooling Fabrics Industry Revenue Share (%), by Country 2025 & 2033
- Figure 18: Asia Pacific Cooling Fabrics Industry Volume Share (%), by Country 2025 & 2033
- Figure 19: North America Cooling Fabrics Industry Revenue (Million), by Type 2025 & 2033
- Figure 20: North America Cooling Fabrics Industry Volume (K Tons), by Type 2025 & 2033
- Figure 21: North America Cooling Fabrics Industry Revenue Share (%), by Type 2025 & 2033
- Figure 22: North America Cooling Fabrics Industry Volume Share (%), by Type 2025 & 2033
- Figure 23: North America Cooling Fabrics Industry Revenue (Million), by Fabric Type 2025 & 2033
- Figure 24: North America Cooling Fabrics Industry Volume (K Tons), by Fabric Type 2025 & 2033
- Figure 25: North America Cooling Fabrics Industry Revenue Share (%), by Fabric Type 2025 & 2033
- Figure 26: North America Cooling Fabrics Industry Volume Share (%), by Fabric Type 2025 & 2033
- Figure 27: North America Cooling Fabrics Industry Revenue (Million), by Application 2025 & 2033
- Figure 28: North America Cooling Fabrics Industry Volume (K Tons), by Application 2025 & 2033
- Figure 29: North America Cooling Fabrics Industry Revenue Share (%), by Application 2025 & 2033
- Figure 30: North America Cooling Fabrics Industry Volume Share (%), by Application 2025 & 2033
- Figure 31: North America Cooling Fabrics Industry Revenue (Million), by Country 2025 & 2033
- Figure 32: North America Cooling Fabrics Industry Volume (K Tons), by Country 2025 & 2033
- Figure 33: North America Cooling Fabrics Industry Revenue Share (%), by Country 2025 & 2033
- Figure 34: North America Cooling Fabrics Industry Volume Share (%), by Country 2025 & 2033
- Figure 35: Europe Cooling Fabrics Industry Revenue (Million), by Type 2025 & 2033
- Figure 36: Europe Cooling Fabrics Industry Volume (K Tons), by Type 2025 & 2033
- Figure 37: Europe Cooling Fabrics Industry Revenue Share (%), by Type 2025 & 2033
- Figure 38: Europe Cooling Fabrics Industry Volume Share (%), by Type 2025 & 2033
- Figure 39: Europe Cooling Fabrics Industry Revenue (Million), by Fabric Type 2025 & 2033
- Figure 40: Europe Cooling Fabrics Industry Volume (K Tons), by Fabric Type 2025 & 2033
- Figure 41: Europe Cooling Fabrics Industry Revenue Share (%), by Fabric Type 2025 & 2033
- Figure 42: Europe Cooling Fabrics Industry Volume Share (%), by Fabric Type 2025 & 2033
- Figure 43: Europe Cooling Fabrics Industry Revenue (Million), by Application 2025 & 2033
- Figure 44: Europe Cooling Fabrics Industry Volume (K Tons), by Application 2025 & 2033
- Figure 45: Europe Cooling Fabrics Industry Revenue Share (%), by Application 2025 & 2033
- Figure 46: Europe Cooling Fabrics Industry Volume Share (%), by Application 2025 & 2033
- Figure 47: Europe Cooling Fabrics Industry Revenue (Million), by Country 2025 & 2033
- Figure 48: Europe Cooling Fabrics Industry Volume (K Tons), by Country 2025 & 2033
- Figure 49: Europe Cooling Fabrics Industry Revenue Share (%), by Country 2025 & 2033
- Figure 50: Europe Cooling Fabrics Industry Volume Share (%), by Country 2025 & 2033
- Figure 51: South America Cooling Fabrics Industry Revenue (Million), by Type 2025 & 2033
- Figure 52: South America Cooling Fabrics Industry Volume (K Tons), by Type 2025 & 2033
- Figure 53: South America Cooling Fabrics Industry Revenue Share (%), by Type 2025 & 2033
- Figure 54: South America Cooling Fabrics Industry Volume Share (%), by Type 2025 & 2033
- Figure 55: South America Cooling Fabrics Industry Revenue (Million), by Fabric Type 2025 & 2033
- Figure 56: South America Cooling Fabrics Industry Volume (K Tons), by Fabric Type 2025 & 2033
- Figure 57: South America Cooling Fabrics Industry Revenue Share (%), by Fabric Type 2025 & 2033
- Figure 58: South America Cooling Fabrics Industry Volume Share (%), by Fabric Type 2025 & 2033
- Figure 59: South America Cooling Fabrics Industry Revenue (Million), by Application 2025 & 2033
- Figure 60: South America Cooling Fabrics Industry Volume (K Tons), by Application 2025 & 2033
- Figure 61: South America Cooling Fabrics Industry Revenue Share (%), by Application 2025 & 2033
- Figure 62: South America Cooling Fabrics Industry Volume Share (%), by Application 2025 & 2033
- Figure 63: South America Cooling Fabrics Industry Revenue (Million), by Country 2025 & 2033
- Figure 64: South America Cooling Fabrics Industry Volume (K Tons), by Country 2025 & 2033
- Figure 65: South America Cooling Fabrics Industry Revenue Share (%), by Country 2025 & 2033
- Figure 66: South America Cooling Fabrics Industry Volume Share (%), by Country 2025 & 2033
- Figure 67: Middle East and Africa Cooling Fabrics Industry Revenue (Million), by Type 2025 & 2033
- Figure 68: Middle East and Africa Cooling Fabrics Industry Volume (K Tons), by Type 2025 & 2033
- Figure 69: Middle East and Africa Cooling Fabrics Industry Revenue Share (%), by Type 2025 & 2033
- Figure 70: Middle East and Africa Cooling Fabrics Industry Volume Share (%), by Type 2025 & 2033
- Figure 71: Middle East and Africa Cooling Fabrics Industry Revenue (Million), by Fabric Type 2025 & 2033
- Figure 72: Middle East and Africa Cooling Fabrics Industry Volume (K Tons), by Fabric Type 2025 & 2033
- Figure 73: Middle East and Africa Cooling Fabrics Industry Revenue Share (%), by Fabric Type 2025 & 2033
- Figure 74: Middle East and Africa Cooling Fabrics Industry Volume Share (%), by Fabric Type 2025 & 2033
- Figure 75: Middle East and Africa Cooling Fabrics Industry Revenue (Million), by Application 2025 & 2033
- Figure 76: Middle East and Africa Cooling Fabrics Industry Volume (K Tons), by Application 2025 & 2033
- Figure 77: Middle East and Africa Cooling Fabrics Industry Revenue Share (%), by Application 2025 & 2033
- Figure 78: Middle East and Africa Cooling Fabrics Industry Volume Share (%), by Application 2025 & 2033
- Figure 79: Middle East and Africa Cooling Fabrics Industry Revenue (Million), by Country 2025 & 2033
- Figure 80: Middle East and Africa Cooling Fabrics Industry Volume (K Tons), by Country 2025 & 2033
- Figure 81: Middle East and Africa Cooling Fabrics Industry Revenue Share (%), by Country 2025 & 2033
- Figure 82: Middle East and Africa Cooling Fabrics Industry Volume Share (%), by Country 2025 & 2033
List of Tables
- Table 1: Global Cooling Fabrics Industry Revenue Million Forecast, by Type 2020 & 2033
- Table 2: Global Cooling Fabrics Industry Volume K Tons Forecast, by Type 2020 & 2033
- Table 3: Global Cooling Fabrics Industry Revenue Million Forecast, by Fabric Type 2020 & 2033
- Table 4: Global Cooling Fabrics Industry Volume K Tons Forecast, by Fabric Type 2020 & 2033
- Table 5: Global Cooling Fabrics Industry Revenue Million Forecast, by Application 2020 & 2033
- Table 6: Global Cooling Fabrics Industry Volume K Tons Forecast, by Application 2020 & 2033
- Table 7: Global Cooling Fabrics Industry Revenue Million Forecast, by Region 2020 & 2033
- Table 8: Global Cooling Fabrics Industry Volume K Tons Forecast, by Region 2020 & 2033
- Table 9: Global Cooling Fabrics Industry Revenue Million Forecast, by Type 2020 & 2033
- Table 10: Global Cooling Fabrics Industry Volume K Tons Forecast, by Type 2020 & 2033
- Table 11: Global Cooling Fabrics Industry Revenue Million Forecast, by Fabric Type 2020 & 2033
- Table 12: Global Cooling Fabrics Industry Volume K Tons Forecast, by Fabric Type 2020 & 2033
- Table 13: Global Cooling Fabrics Industry Revenue Million Forecast, by Application 2020 & 2033
- Table 14: Global Cooling Fabrics Industry Volume K Tons Forecast, by Application 2020 & 2033
- Table 15: Global Cooling Fabrics Industry Revenue Million Forecast, by Country 2020 & 2033
- Table 16: Global Cooling Fabrics Industry Volume K Tons Forecast, by Country 2020 & 2033
- Table 17: China Cooling Fabrics Industry Revenue (Million) Forecast, by Application 2020 & 2033
- Table 18: China Cooling Fabrics Industry Volume (K Tons) Forecast, by Application 2020 & 2033
- Table 19: India Cooling Fabrics Industry Revenue (Million) Forecast, by Application 2020 & 2033
- Table 20: India Cooling Fabrics Industry Volume (K Tons) Forecast, by Application 2020 & 2033
- Table 21: Japan Cooling Fabrics Industry Revenue (Million) Forecast, by Application 2020 & 2033
- Table 22: Japan Cooling Fabrics Industry Volume (K Tons) Forecast, by Application 2020 & 2033
- Table 23: South Korea Cooling Fabrics Industry Revenue (Million) Forecast, by Application 2020 & 2033
- Table 24: South Korea Cooling Fabrics Industry Volume (K Tons) Forecast, by Application 2020 & 2033
- Table 25: Rest of Asia Pacific Cooling Fabrics Industry Revenue (Million) Forecast, by Application 2020 & 2033
- Table 26: Rest of Asia Pacific Cooling Fabrics Industry Volume (K Tons) Forecast, by Application 2020 & 2033
- Table 27: Global Cooling Fabrics Industry Revenue Million Forecast, by Type 2020 & 2033
- Table 28: Global Cooling Fabrics Industry Volume K Tons Forecast, by Type 2020 & 2033
- Table 29: Global Cooling Fabrics Industry Revenue Million Forecast, by Fabric Type 2020 & 2033
- Table 30: Global Cooling Fabrics Industry Volume K Tons Forecast, by Fabric Type 2020 & 2033
- Table 31: Global Cooling Fabrics Industry Revenue Million Forecast, by Application 2020 & 2033
- Table 32: Global Cooling Fabrics Industry Volume K Tons Forecast, by Application 2020 & 2033
- Table 33: Global Cooling Fabrics Industry Revenue Million Forecast, by Country 2020 & 2033
- Table 34: Global Cooling Fabrics Industry Volume K Tons Forecast, by Country 2020 & 2033
- Table 35: United States Cooling Fabrics Industry Revenue (Million) Forecast, by Application 2020 & 2033
- Table 36: United States Cooling Fabrics Industry Volume (K Tons) Forecast, by Application 2020 & 2033
- Table 37: Canada Cooling Fabrics Industry Revenue (Million) Forecast, by Application 2020 & 2033
- Table 38: Canada Cooling Fabrics Industry Volume (K Tons) Forecast, by Application 2020 & 2033
- Table 39: Mexico Cooling Fabrics Industry Revenue (Million) Forecast, by Application 2020 & 2033
- Table 40: Mexico Cooling Fabrics Industry Volume (K Tons) Forecast, by Application 2020 & 2033
- Table 41: Global Cooling Fabrics Industry Revenue Million Forecast, by Type 2020 & 2033
- Table 42: Global Cooling Fabrics Industry Volume K Tons Forecast, by Type 2020 & 2033
- Table 43: Global Cooling Fabrics Industry Revenue Million Forecast, by Fabric Type 2020 & 2033
- Table 44: Global Cooling Fabrics Industry Volume K Tons Forecast, by Fabric Type 2020 & 2033
- Table 45: Global Cooling Fabrics Industry Revenue Million Forecast, by Application 2020 & 2033
- Table 46: Global Cooling Fabrics Industry Volume K Tons Forecast, by Application 2020 & 2033
- Table 47: Global Cooling Fabrics Industry Revenue Million Forecast, by Country 2020 & 2033
- Table 48: Global Cooling Fabrics Industry Volume K Tons Forecast, by Country 2020 & 2033
- Table 49: Germany Cooling Fabrics Industry Revenue (Million) Forecast, by Application 2020 & 2033
- Table 50: Germany Cooling Fabrics Industry Volume (K Tons) Forecast, by Application 2020 & 2033
- Table 51: United Kingdom Cooling Fabrics Industry Revenue (Million) Forecast, by Application 2020 & 2033
- Table 52: United Kingdom Cooling Fabrics Industry Volume (K Tons) Forecast, by Application 2020 & 2033
- Table 53: Italy Cooling Fabrics Industry Revenue (Million) Forecast, by Application 2020 & 2033
- Table 54: Italy Cooling Fabrics Industry Volume (K Tons) Forecast, by Application 2020 & 2033
- Table 55: France Cooling Fabrics Industry Revenue (Million) Forecast, by Application 2020 & 2033
- Table 56: France Cooling Fabrics Industry Volume (K Tons) Forecast, by Application 2020 & 2033
- Table 57: Rest of Europe Cooling Fabrics Industry Revenue (Million) Forecast, by Application 2020 & 2033
- Table 58: Rest of Europe Cooling Fabrics Industry Volume (K Tons) Forecast, by Application 2020 & 2033
- Table 59: Global Cooling Fabrics Industry Revenue Million Forecast, by Type 2020 & 2033
- Table 60: Global Cooling Fabrics Industry Volume K Tons Forecast, by Type 2020 & 2033
- Table 61: Global Cooling Fabrics Industry Revenue Million Forecast, by Fabric Type 2020 & 2033
- Table 62: Global Cooling Fabrics Industry Volume K Tons Forecast, by Fabric Type 2020 & 2033
- Table 63: Global Cooling Fabrics Industry Revenue Million Forecast, by Application 2020 & 2033
- Table 64: Global Cooling Fabrics Industry Volume K Tons Forecast, by Application 2020 & 2033
- Table 65: Global Cooling Fabrics Industry Revenue Million Forecast, by Country 2020 & 2033
- Table 66: Global Cooling Fabrics Industry Volume K Tons Forecast, by Country 2020 & 2033
- Table 67: Brazil Cooling Fabrics Industry Revenue (Million) Forecast, by Application 2020 & 2033
- Table 68: Brazil Cooling Fabrics Industry Volume (K Tons) Forecast, by Application 2020 & 2033
- Table 69: Argentina Cooling Fabrics Industry Revenue (Million) Forecast, by Application 2020 & 2033
- Table 70: Argentina Cooling Fabrics Industry Volume (K Tons) Forecast, by Application 2020 & 2033
- Table 71: Rest of South America Cooling Fabrics Industry Revenue (Million) Forecast, by Application 2020 & 2033
- Table 72: Rest of South America Cooling Fabrics Industry Volume (K Tons) Forecast, by Application 2020 & 2033
- Table 73: Global Cooling Fabrics Industry Revenue Million Forecast, by Type 2020 & 2033
- Table 74: Global Cooling Fabrics Industry Volume K Tons Forecast, by Type 2020 & 2033
- Table 75: Global Cooling Fabrics Industry Revenue Million Forecast, by Fabric Type 2020 & 2033
- Table 76: Global Cooling Fabrics Industry Volume K Tons Forecast, by Fabric Type 2020 & 2033
- Table 77: Global Cooling Fabrics Industry Revenue Million Forecast, by Application 2020 & 2033
- Table 78: Global Cooling Fabrics Industry Volume K Tons Forecast, by Application 2020 & 2033
- Table 79: Global Cooling Fabrics Industry Revenue Million Forecast, by Country 2020 & 2033
- Table 80: Global Cooling Fabrics Industry Volume K Tons Forecast, by Country 2020 & 2033
- Table 81: Saudi Arabia Cooling Fabrics Industry Revenue (Million) Forecast, by Application 2020 & 2033
- Table 82: Saudi Arabia Cooling Fabrics Industry Volume (K Tons) Forecast, by Application 2020 & 2033
- Table 83: South Africa Cooling Fabrics Industry Revenue (Million) Forecast, by Application 2020 & 2033
- Table 84: South Africa Cooling Fabrics Industry Volume (K Tons) Forecast, by Application 2020 & 2033
- Table 85: Rest of Middle East and Africa Cooling Fabrics Industry Revenue (Million) Forecast, by Application 2020 & 2033
- Table 86: Rest of Middle East and Africa Cooling Fabrics Industry Volume (K Tons) Forecast, by Application 2020 & 2033
Frequently Asked Questions
1. What is the projected Compound Annual Growth Rate (CAGR) of the Cooling Fabrics Industry?
The projected CAGR is approximately 7.21%.
2. Which companies are prominent players in the Cooling Fabrics Industry?
Key companies in the market include Everest Textile Co Ltd, Asahi Kasei Corporation, HeiQ Materials AG, Polartec, Columbia Sportswear Company, Formosa Taffeta Co Ltd, NILIT, Coolcore, NAN YA PLASTICS CORPORATION, Burlington, Wilson Fabrics, Balavigna Weaving Mills Pvt Ltd.
3. What are the main segments of the Cooling Fabrics Industry?
The market segments include Type, Fabric Type, Application.
4. Can you provide details about the market size?
The market size is estimated to be USD 2.42 Million as of 2022.
5. What are some drivers contributing to market growth?
Growing Demand for Synthetic Fabrics; Increasing Demand for Sportwear Fabrics; Other Drivers.
6. What are the notable trends driving market growth?
Increasing Demand from Sportswear Application.
7. Are there any restraints impacting market growth?
High Cost of Cooling Fabrics; Other Restraints.
8. Can you provide examples of recent developments in the market?
January 2023: NILIT launched a new version of SENSIL EcoCare recycled Nylon 6.6 manufactured completely from US materials at its North American facility in Martinsville, VA.
9. What pricing options are available for accessing the report?
Pricing options include single-user, multi-user, and enterprise licenses priced at USD 4750, USD 5250, and USD 8750 respectively.
10. Is the market size provided in terms of value or volume?
The market size is provided in terms of value, measured in Million and volume, measured in K Tons.
11. Are there any specific market keywords associated with the report?
Yes, the market keyword associated with the report is "Cooling Fabrics Industry," which aids in identifying and referencing the specific market segment covered.
12. How do I determine which pricing option suits my needs best?
The pricing options vary based on user requirements and access needs. Individual users may opt for single-user licenses, while businesses requiring broader access may choose multi-user or enterprise licenses for cost-effective access to the report.
13. Are there any additional resources or data provided in the Cooling Fabrics Industry report?
While the report offers comprehensive insights, it's advisable to review the specific contents or supplementary materials provided to ascertain if additional resources or data are available.
14. How can I stay updated on further developments or reports in the Cooling Fabrics Industry?
To stay informed about further developments, trends, and reports in the Cooling Fabrics Industry, consider subscribing to industry newsletters, following relevant companies and organizations, or regularly checking reputable industry news sources and publications.
Methodology
Step 1 - Identification of Relevant Samples Size from Population Database


Step 2 - Approaches for Defining Global Market Size (Value, Volume* & Price*)

Note*: In applicable scenarios
Step 3 - Data Sources
Primary Research
- Web Analytics
- Survey Reports
- Research Institute
- Latest Research Reports
- Opinion Leaders
Secondary Research
- Annual Reports
- White Paper
- Latest Press Release
- Industry Association
- Paid Database
- Investor Presentations

Step 4 - Data Triangulation
Involves using different sources of information in order to increase the validity of a study
These sources are likely to be stakeholders in a program - participants, other researchers, program staff, other community members, and so on.
Then we put all data in single framework & apply various statistical tools to find out the dynamic on the market.
During the analysis stage, feedback from the stakeholder groups would be compared to determine areas of agreement as well as areas of divergence