

Key Insights
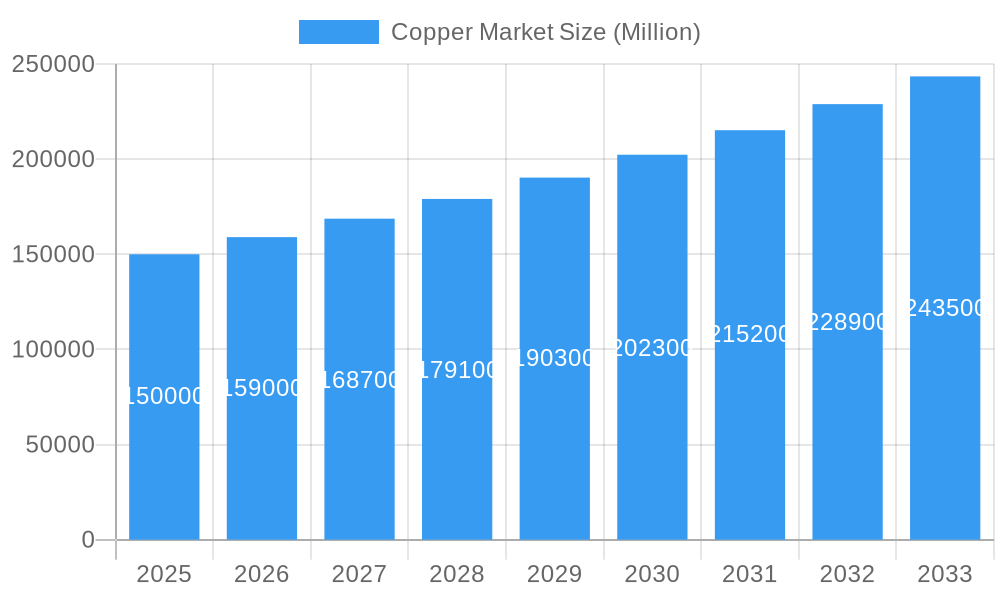
The global copper market, valued at approximately $150 billion in 2025, is poised for robust growth, exhibiting a Compound Annual Growth Rate (CAGR) exceeding 6% from 2025 to 2033. This expansion is fueled by several key drivers. The burgeoning automotive and heavy equipment sectors, driven by the increasing demand for electric vehicles and infrastructure development, represent a significant catalyst. Furthermore, the rapid growth of the construction industry globally, particularly in developing economies, necessitates substantial copper usage in wiring, plumbing, and building materials. The expanding electrical and electronics sector, fueled by the proliferation of smart devices and renewable energy infrastructure, further contributes to increased copper demand. While challenges exist, such as fluctuating commodity prices and potential supply chain disruptions, the overall market outlook remains positive, driven by long-term growth in these key end-use industries.
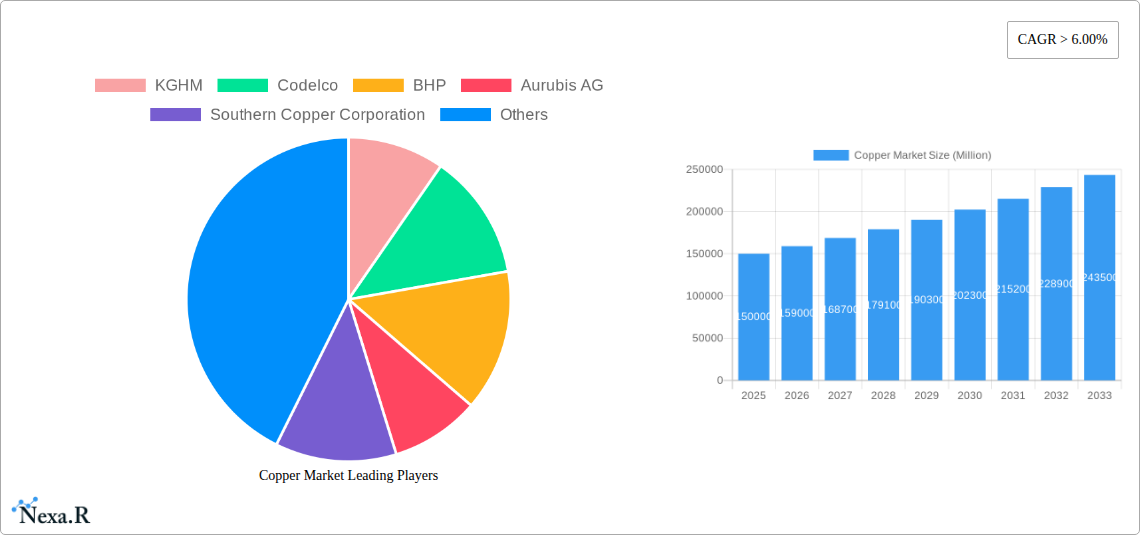
Copper Market Market Size (In Billion)
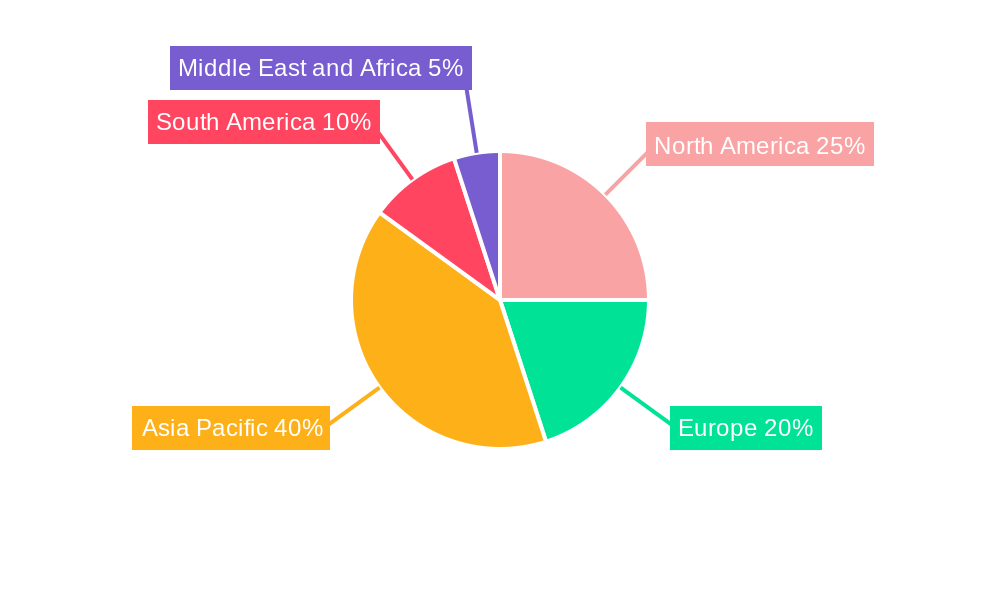
The market segmentation reveals significant regional variations. The Asia-Pacific region, particularly China and India, holds a substantial market share due to robust industrialization and urbanization. North America and Europe also represent significant markets, with steady demand driven by infrastructure projects and technological advancements. Leading copper producers, including KGHM, Codelco, BHP, Aurubis AG, and Freeport-McMoRan, are actively engaged in meeting this increasing demand, but the industry faces ongoing challenges related to sustainable mining practices and resource availability. The forecast period will likely see increased focus on recycling initiatives and exploration of alternative sources to ensure a stable and sustainable copper supply to meet future demands. Market participants should anticipate continuing fluctuations in prices, influenced by global economic conditions and geopolitical factors.
Copper Market Company Market Share
Copper Market: A Comprehensive Market Report (2019-2033)
This in-depth report provides a comprehensive analysis of the Copper Market, encompassing market dynamics, growth trends, regional dominance, product landscape, key players, and future outlook. The study period covers 2019-2033, with a base year of 2025 and a forecast period of 2025-2033. This report is essential for industry professionals, investors, and anyone seeking a detailed understanding of this vital market. The parent market is the Metals and Mining industry, while the child market focuses specifically on copper production and consumption.
Copper Market Dynamics & Structure
This section analyzes the copper market's competitive landscape, technological advancements, regulatory environment, and market concentration. The report delves into the impact of mergers and acquisitions (M&A) activities and explores the presence of substitute materials. Quantitative data on market share percentages and M&A deal volumes is provided.
- Market Concentration: The market exhibits moderate concentration with several key players holding significant market share, though a fragmented landscape persists among smaller producers. The top 10 companies (KGHM, Codelco, BHP, Aurubis AG, Southern Copper Corporation, Group Mexico, Xstrata Plc, Glencore, Chinalco Shanghai Copper, Freeport-McMoRan Copper & Gold) collectively hold approximately xx% of the global market share (2025 estimate).
- Technological Innovation: Advancements in mining techniques (e.g., automation, improved extraction methods) and recycling technologies are driving efficiency and sustainability. However, high capital expenditure and regulatory complexities present barriers to innovation.
- Regulatory Framework: Government regulations related to environmental protection, worker safety, and resource management significantly impact copper production and pricing. Variations in these regulations across regions influence market dynamics.
- Competitive Product Substitutes: Aluminum and other materials compete with copper in certain applications, influencing demand and pricing. The extent of substitution depends heavily on the specific application and cost considerations.
- End-User Demographics: The report analyzes end-user demographics across various segments to gauge market demand based on population growth, economic development, and technological shifts.
- M&A Trends: The report analyzes recent M&A activities in the copper industry, assessing their impact on market consolidation, resource control, and technological integration. The number of M&A deals observed during the historical period (2019-2024) was xx, with a total value of xx Million.
Copper Market Growth Trends & Insights
This section provides a comprehensive analysis of the copper market's growth trajectory, leveraging proprietary data and market intelligence. It examines market size evolution, adoption rates across various end-use sectors, and how technological disruptions and consumer behavior are shaping market trends.
The global copper market size was valued at xx Million in 2024 and is projected to reach xx Million by 2033, exhibiting a CAGR of xx% during the forecast period (2025-2033). This growth is primarily driven by increasing demand from the construction, automotive, and electronics industries. Factors like urbanization, rising disposable incomes, and the global push towards electrification are contributing to this upward trend. Technological advancements in recycling and extraction methods also play a significant role in influencing both supply and demand dynamics. Further analysis reveals variations in growth rates across different geographic regions, impacted by factors including economic policies, infrastructure development, and access to resources.
Dominant Regions, Countries, or Segments in Copper Market
This section pinpoints the leading regions, countries, and segments driving market growth. It identifies key drivers such as economic policies, infrastructure development, and industrial activity within each segment:
- Automotive and Heavy Equipment: Strong growth driven by vehicle production and infrastructure projects. Significant demand in Asia-Pacific and North America.
- Construction: Market growth is directly tied to infrastructure development and construction activity, with robust expansion expected in emerging economies.
- Electrical and Electronics: Sustained growth in this segment is fueled by the burgeoning electronics industry and the increasing adoption of renewable energy technologies.
- Industrial: This sector's growth depends on industrial production and manufacturing activities, with fluctuations influenced by global economic conditions.
- Other End-user Industries: This diverse segment encompasses various applications, with varying growth rates reflecting the individual dynamics of each sub-sector.
The Asia-Pacific region currently holds the largest market share due to rapid industrialization and urbanization. However, North America and Europe are expected to experience significant growth over the forecast period, driven by robust infrastructure investments and the increasing focus on renewable energy.
Copper Market Product Landscape
The copper market offers a range of products, including various grades and forms of copper, tailored to specific applications. Recent innovations focus on enhancing conductivity, improving durability, and developing sustainable manufacturing processes. These advancements are driving higher performance and efficiency in diverse applications, from electrical wiring to advanced electronics.
Key Drivers, Barriers & Challenges in Copper Market
Key Drivers:
- Rising demand from the construction and electronics industries.
- Growing adoption of renewable energy technologies.
- Infrastructure development in emerging economies.
- Advancements in mining and recycling technologies.
Key Barriers and Challenges:
- Price volatility due to supply chain disruptions and geopolitical uncertainties.
- Environmental concerns related to mining and waste management.
- Competition from substitute materials.
- Regulatory hurdles and permitting processes.
Emerging Opportunities in Copper Market
Emerging opportunities include:
- Expansion into untapped markets in developing countries.
- Development of innovative applications in emerging technologies (e.g., electric vehicles, renewable energy).
- Increased adoption of sustainable and circular economy practices.
- Growth in the recycling sector to address resource scarcity.
Growth Accelerators in the Copper Market Industry
Long-term growth will be accelerated by technological advancements, such as improved mining techniques and recycling technologies, strategic collaborations to enhance supply chain efficiency, and expansion into new markets. Government support for sustainable infrastructure projects will further stimulate growth.
Key Players Shaping the Copper Market Market
- KGHM
- Codelco
- BHP
- Aurubis AG
- Southern Copper Corporation
- Group Mexico
- Xstrata Plc
- Glencore
- Chinalco Shanghai Copper
- Freeport-McMoRan Copper & Gold
Notable Milestones in Copper Market Sector
- May 2021: Glencore announced plans to restart operations at the Mutanda copper and cobalt mine in 2022, potentially easing market shortages.
- November 2021: Aurubis AG launched a new multi-metal recycling plant in Georgia, USA, with an annual capacity of 35,000 tons of blister copper.
In-Depth Copper Market Market Outlook
The copper market is poised for continued growth, driven by robust demand from key sectors and ongoing technological advancements. Strategic investments in sustainable mining practices, coupled with innovations in recycling and resource efficiency, will shape the future of the market. Companies that effectively adapt to evolving regulatory landscapes and consumer preferences are well-positioned to capitalize on the significant opportunities presented by this dynamic market.
Copper Market Segmentation
-
1. End-user Industry
- 1.1. Automotive and Heavy Equipment
- 1.2. Construction
- 1.3. Electrical and Electronics
- 1.4. Industrial
- 1.5. Other End-user Industry
Copper Market Segmentation By Geography
-
1. Asia Pacific
- 1.1. China
- 1.2. India
- 1.3. Japan
- 1.4. South Korea
- 1.5. Rest of Asia Pacific
-
2. North America
- 2.1. United States
- 2.2. Canada
- 2.3. Mexico
-
3. Europe
- 3.1. Germany
- 3.2. United Kingdom
- 3.3. France
- 3.4. Italy
- 3.5. Rest of Europe
-
4. South America
- 4.1. Brazil
- 4.2. Argentina
- 4.3. Rest of South America
-
5. Middle East and Africa
- 5.1. South Africa
- 5.2. UAE
- 5.3. Saudi Arabia
- 5.4. Rest of Middle East and Africa
Copper Market Regional Market Share
Geographic Coverage of Copper Market
Copper Market REPORT HIGHLIGHTS
| Aspects | Details |
|---|---|
| Study Period | 2020-2034 |
| Base Year | 2025 |
| Estimated Year | 2026 |
| Forecast Period | 2026-2034 |
| Historical Period | 2020-2025 |
| Growth Rate | CAGR of > 6.00% from 2020-2034 |
| Segmentation |
|
Table of Contents
- 1. Introduction
- 1.1. Research Scope
- 1.2. Market Segmentation
- 1.3. Research Methodology
- 1.4. Definitions and Assumptions
- 2. Executive Summary
- 2.1. Introduction
- 3. Market Dynamics
- 3.1. Introduction
- 3.2. Market Drivers
- 3.2.1. Growing Demand from Electronics and Construction Industry; Other Drivers
- 3.3. Market Restrains
- 3.3.1. Stringent Regulations Associated with Mining
- 3.4. Market Trends
- 3.4.1. Growing Demand for Electrical and Electronics Segment
- 4. Market Factor Analysis
- 4.1. Porters Five Forces
- 4.2. Supply/Value Chain
- 4.3. PESTEL analysis
- 4.4. Market Entropy
- 4.5. Patent/Trademark Analysis
- 5. Global Copper Market Analysis, Insights and Forecast, 2020-2032
- 5.1. Market Analysis, Insights and Forecast - by End-user Industry
- 5.1.1. Automotive and Heavy Equipment
- 5.1.2. Construction
- 5.1.3. Electrical and Electronics
- 5.1.4. Industrial
- 5.1.5. Other End-user Industry
- 5.2. Market Analysis, Insights and Forecast - by Region
- 5.2.1. Asia Pacific
- 5.2.2. North America
- 5.2.3. Europe
- 5.2.4. South America
- 5.2.5. Middle East and Africa
- 5.1. Market Analysis, Insights and Forecast - by End-user Industry
- 6. Asia Pacific Copper Market Analysis, Insights and Forecast, 2020-2032
- 6.1. Market Analysis, Insights and Forecast - by End-user Industry
- 6.1.1. Automotive and Heavy Equipment
- 6.1.2. Construction
- 6.1.3. Electrical and Electronics
- 6.1.4. Industrial
- 6.1.5. Other End-user Industry
- 6.1. Market Analysis, Insights and Forecast - by End-user Industry
- 7. North America Copper Market Analysis, Insights and Forecast, 2020-2032
- 7.1. Market Analysis, Insights and Forecast - by End-user Industry
- 7.1.1. Automotive and Heavy Equipment
- 7.1.2. Construction
- 7.1.3. Electrical and Electronics
- 7.1.4. Industrial
- 7.1.5. Other End-user Industry
- 7.1. Market Analysis, Insights and Forecast - by End-user Industry
- 8. Europe Copper Market Analysis, Insights and Forecast, 2020-2032
- 8.1. Market Analysis, Insights and Forecast - by End-user Industry
- 8.1.1. Automotive and Heavy Equipment
- 8.1.2. Construction
- 8.1.3. Electrical and Electronics
- 8.1.4. Industrial
- 8.1.5. Other End-user Industry
- 8.1. Market Analysis, Insights and Forecast - by End-user Industry
- 9. South America Copper Market Analysis, Insights and Forecast, 2020-2032
- 9.1. Market Analysis, Insights and Forecast - by End-user Industry
- 9.1.1. Automotive and Heavy Equipment
- 9.1.2. Construction
- 9.1.3. Electrical and Electronics
- 9.1.4. Industrial
- 9.1.5. Other End-user Industry
- 9.1. Market Analysis, Insights and Forecast - by End-user Industry
- 10. Middle East and Africa Copper Market Analysis, Insights and Forecast, 2020-2032
- 10.1. Market Analysis, Insights and Forecast - by End-user Industry
- 10.1.1. Automotive and Heavy Equipment
- 10.1.2. Construction
- 10.1.3. Electrical and Electronics
- 10.1.4. Industrial
- 10.1.5. Other End-user Industry
- 10.1. Market Analysis, Insights and Forecast - by End-user Industry
- 11. Competitive Analysis
- 11.1. Global Market Share Analysis 2025
- 11.2. Company Profiles
- 11.2.1 KGHM
- 11.2.1.1. Overview
- 11.2.1.2. Products
- 11.2.1.3. SWOT Analysis
- 11.2.1.4. Recent Developments
- 11.2.1.5. Financials (Based on Availability)
- 11.2.2 Codelco
- 11.2.2.1. Overview
- 11.2.2.2. Products
- 11.2.2.3. SWOT Analysis
- 11.2.2.4. Recent Developments
- 11.2.2.5. Financials (Based on Availability)
- 11.2.3 BHP
- 11.2.3.1. Overview
- 11.2.3.2. Products
- 11.2.3.3. SWOT Analysis
- 11.2.3.4. Recent Developments
- 11.2.3.5. Financials (Based on Availability)
- 11.2.4 Aurubis AG
- 11.2.4.1. Overview
- 11.2.4.2. Products
- 11.2.4.3. SWOT Analysis
- 11.2.4.4. Recent Developments
- 11.2.4.5. Financials (Based on Availability)
- 11.2.5 Southern Copper Corporation
- 11.2.5.1. Overview
- 11.2.5.2. Products
- 11.2.5.3. SWOT Analysis
- 11.2.5.4. Recent Developments
- 11.2.5.5. Financials (Based on Availability)
- 11.2.6 Group Mexico
- 11.2.6.1. Overview
- 11.2.6.2. Products
- 11.2.6.3. SWOT Analysis
- 11.2.6.4. Recent Developments
- 11.2.6.5. Financials (Based on Availability)
- 11.2.7 Xstrata Plc
- 11.2.7.1. Overview
- 11.2.7.2. Products
- 11.2.7.3. SWOT Analysis
- 11.2.7.4. Recent Developments
- 11.2.7.5. Financials (Based on Availability)
- 11.2.8 Glencore
- 11.2.8.1. Overview
- 11.2.8.2. Products
- 11.2.8.3. SWOT Analysis
- 11.2.8.4. Recent Developments
- 11.2.8.5. Financials (Based on Availability)
- 11.2.9 Chinalco Shanghai Copper
- 11.2.9.1. Overview
- 11.2.9.2. Products
- 11.2.9.3. SWOT Analysis
- 11.2.9.4. Recent Developments
- 11.2.9.5. Financials (Based on Availability)
- 11.2.10 Freeport-McMoRan Copper & Gold
- 11.2.10.1. Overview
- 11.2.10.2. Products
- 11.2.10.3. SWOT Analysis
- 11.2.10.4. Recent Developments
- 11.2.10.5. Financials (Based on Availability)
- 11.2.1 KGHM
List of Figures
- Figure 1: Global Copper Market Revenue Breakdown (Million, %) by Region 2025 & 2033
- Figure 2: Global Copper Market Volume Breakdown (K Tons, %) by Region 2025 & 2033
- Figure 3: Asia Pacific Copper Market Revenue (Million), by End-user Industry 2025 & 2033
- Figure 4: Asia Pacific Copper Market Volume (K Tons), by End-user Industry 2025 & 2033
- Figure 5: Asia Pacific Copper Market Revenue Share (%), by End-user Industry 2025 & 2033
- Figure 6: Asia Pacific Copper Market Volume Share (%), by End-user Industry 2025 & 2033
- Figure 7: Asia Pacific Copper Market Revenue (Million), by Country 2025 & 2033
- Figure 8: Asia Pacific Copper Market Volume (K Tons), by Country 2025 & 2033
- Figure 9: Asia Pacific Copper Market Revenue Share (%), by Country 2025 & 2033
- Figure 10: Asia Pacific Copper Market Volume Share (%), by Country 2025 & 2033
- Figure 11: North America Copper Market Revenue (Million), by End-user Industry 2025 & 2033
- Figure 12: North America Copper Market Volume (K Tons), by End-user Industry 2025 & 2033
- Figure 13: North America Copper Market Revenue Share (%), by End-user Industry 2025 & 2033
- Figure 14: North America Copper Market Volume Share (%), by End-user Industry 2025 & 2033
- Figure 15: North America Copper Market Revenue (Million), by Country 2025 & 2033
- Figure 16: North America Copper Market Volume (K Tons), by Country 2025 & 2033
- Figure 17: North America Copper Market Revenue Share (%), by Country 2025 & 2033
- Figure 18: North America Copper Market Volume Share (%), by Country 2025 & 2033
- Figure 19: Europe Copper Market Revenue (Million), by End-user Industry 2025 & 2033
- Figure 20: Europe Copper Market Volume (K Tons), by End-user Industry 2025 & 2033
- Figure 21: Europe Copper Market Revenue Share (%), by End-user Industry 2025 & 2033
- Figure 22: Europe Copper Market Volume Share (%), by End-user Industry 2025 & 2033
- Figure 23: Europe Copper Market Revenue (Million), by Country 2025 & 2033
- Figure 24: Europe Copper Market Volume (K Tons), by Country 2025 & 2033
- Figure 25: Europe Copper Market Revenue Share (%), by Country 2025 & 2033
- Figure 26: Europe Copper Market Volume Share (%), by Country 2025 & 2033
- Figure 27: South America Copper Market Revenue (Million), by End-user Industry 2025 & 2033
- Figure 28: South America Copper Market Volume (K Tons), by End-user Industry 2025 & 2033
- Figure 29: South America Copper Market Revenue Share (%), by End-user Industry 2025 & 2033
- Figure 30: South America Copper Market Volume Share (%), by End-user Industry 2025 & 2033
- Figure 31: South America Copper Market Revenue (Million), by Country 2025 & 2033
- Figure 32: South America Copper Market Volume (K Tons), by Country 2025 & 2033
- Figure 33: South America Copper Market Revenue Share (%), by Country 2025 & 2033
- Figure 34: South America Copper Market Volume Share (%), by Country 2025 & 2033
- Figure 35: Middle East and Africa Copper Market Revenue (Million), by End-user Industry 2025 & 2033
- Figure 36: Middle East and Africa Copper Market Volume (K Tons), by End-user Industry 2025 & 2033
- Figure 37: Middle East and Africa Copper Market Revenue Share (%), by End-user Industry 2025 & 2033
- Figure 38: Middle East and Africa Copper Market Volume Share (%), by End-user Industry 2025 & 2033
- Figure 39: Middle East and Africa Copper Market Revenue (Million), by Country 2025 & 2033
- Figure 40: Middle East and Africa Copper Market Volume (K Tons), by Country 2025 & 2033
- Figure 41: Middle East and Africa Copper Market Revenue Share (%), by Country 2025 & 2033
- Figure 42: Middle East and Africa Copper Market Volume Share (%), by Country 2025 & 2033
List of Tables
- Table 1: Global Copper Market Revenue Million Forecast, by End-user Industry 2020 & 2033
- Table 2: Global Copper Market Volume K Tons Forecast, by End-user Industry 2020 & 2033
- Table 3: Global Copper Market Revenue Million Forecast, by Region 2020 & 2033
- Table 4: Global Copper Market Volume K Tons Forecast, by Region 2020 & 2033
- Table 5: Global Copper Market Revenue Million Forecast, by End-user Industry 2020 & 2033
- Table 6: Global Copper Market Volume K Tons Forecast, by End-user Industry 2020 & 2033
- Table 7: Global Copper Market Revenue Million Forecast, by Country 2020 & 2033
- Table 8: Global Copper Market Volume K Tons Forecast, by Country 2020 & 2033
- Table 9: China Copper Market Revenue (Million) Forecast, by Application 2020 & 2033
- Table 10: China Copper Market Volume (K Tons) Forecast, by Application 2020 & 2033
- Table 11: India Copper Market Revenue (Million) Forecast, by Application 2020 & 2033
- Table 12: India Copper Market Volume (K Tons) Forecast, by Application 2020 & 2033
- Table 13: Japan Copper Market Revenue (Million) Forecast, by Application 2020 & 2033
- Table 14: Japan Copper Market Volume (K Tons) Forecast, by Application 2020 & 2033
- Table 15: South Korea Copper Market Revenue (Million) Forecast, by Application 2020 & 2033
- Table 16: South Korea Copper Market Volume (K Tons) Forecast, by Application 2020 & 2033
- Table 17: Rest of Asia Pacific Copper Market Revenue (Million) Forecast, by Application 2020 & 2033
- Table 18: Rest of Asia Pacific Copper Market Volume (K Tons) Forecast, by Application 2020 & 2033
- Table 19: Global Copper Market Revenue Million Forecast, by End-user Industry 2020 & 2033
- Table 20: Global Copper Market Volume K Tons Forecast, by End-user Industry 2020 & 2033
- Table 21: Global Copper Market Revenue Million Forecast, by Country 2020 & 2033
- Table 22: Global Copper Market Volume K Tons Forecast, by Country 2020 & 2033
- Table 23: United States Copper Market Revenue (Million) Forecast, by Application 2020 & 2033
- Table 24: United States Copper Market Volume (K Tons) Forecast, by Application 2020 & 2033
- Table 25: Canada Copper Market Revenue (Million) Forecast, by Application 2020 & 2033
- Table 26: Canada Copper Market Volume (K Tons) Forecast, by Application 2020 & 2033
- Table 27: Mexico Copper Market Revenue (Million) Forecast, by Application 2020 & 2033
- Table 28: Mexico Copper Market Volume (K Tons) Forecast, by Application 2020 & 2033
- Table 29: Global Copper Market Revenue Million Forecast, by End-user Industry 2020 & 2033
- Table 30: Global Copper Market Volume K Tons Forecast, by End-user Industry 2020 & 2033
- Table 31: Global Copper Market Revenue Million Forecast, by Country 2020 & 2033
- Table 32: Global Copper Market Volume K Tons Forecast, by Country 2020 & 2033
- Table 33: Germany Copper Market Revenue (Million) Forecast, by Application 2020 & 2033
- Table 34: Germany Copper Market Volume (K Tons) Forecast, by Application 2020 & 2033
- Table 35: United Kingdom Copper Market Revenue (Million) Forecast, by Application 2020 & 2033
- Table 36: United Kingdom Copper Market Volume (K Tons) Forecast, by Application 2020 & 2033
- Table 37: France Copper Market Revenue (Million) Forecast, by Application 2020 & 2033
- Table 38: France Copper Market Volume (K Tons) Forecast, by Application 2020 & 2033
- Table 39: Italy Copper Market Revenue (Million) Forecast, by Application 2020 & 2033
- Table 40: Italy Copper Market Volume (K Tons) Forecast, by Application 2020 & 2033
- Table 41: Rest of Europe Copper Market Revenue (Million) Forecast, by Application 2020 & 2033
- Table 42: Rest of Europe Copper Market Volume (K Tons) Forecast, by Application 2020 & 2033
- Table 43: Global Copper Market Revenue Million Forecast, by End-user Industry 2020 & 2033
- Table 44: Global Copper Market Volume K Tons Forecast, by End-user Industry 2020 & 2033
- Table 45: Global Copper Market Revenue Million Forecast, by Country 2020 & 2033
- Table 46: Global Copper Market Volume K Tons Forecast, by Country 2020 & 2033
- Table 47: Brazil Copper Market Revenue (Million) Forecast, by Application 2020 & 2033
- Table 48: Brazil Copper Market Volume (K Tons) Forecast, by Application 2020 & 2033
- Table 49: Argentina Copper Market Revenue (Million) Forecast, by Application 2020 & 2033
- Table 50: Argentina Copper Market Volume (K Tons) Forecast, by Application 2020 & 2033
- Table 51: Rest of South America Copper Market Revenue (Million) Forecast, by Application 2020 & 2033
- Table 52: Rest of South America Copper Market Volume (K Tons) Forecast, by Application 2020 & 2033
- Table 53: Global Copper Market Revenue Million Forecast, by End-user Industry 2020 & 2033
- Table 54: Global Copper Market Volume K Tons Forecast, by End-user Industry 2020 & 2033
- Table 55: Global Copper Market Revenue Million Forecast, by Country 2020 & 2033
- Table 56: Global Copper Market Volume K Tons Forecast, by Country 2020 & 2033
- Table 57: South Africa Copper Market Revenue (Million) Forecast, by Application 2020 & 2033
- Table 58: South Africa Copper Market Volume (K Tons) Forecast, by Application 2020 & 2033
- Table 59: UAE Copper Market Revenue (Million) Forecast, by Application 2020 & 2033
- Table 60: UAE Copper Market Volume (K Tons) Forecast, by Application 2020 & 2033
- Table 61: Saudi Arabia Copper Market Revenue (Million) Forecast, by Application 2020 & 2033
- Table 62: Saudi Arabia Copper Market Volume (K Tons) Forecast, by Application 2020 & 2033
- Table 63: Rest of Middle East and Africa Copper Market Revenue (Million) Forecast, by Application 2020 & 2033
- Table 64: Rest of Middle East and Africa Copper Market Volume (K Tons) Forecast, by Application 2020 & 2033
Frequently Asked Questions
1. What is the projected Compound Annual Growth Rate (CAGR) of the Copper Market?
The projected CAGR is approximately > 6.00%.
2. Which companies are prominent players in the Copper Market?
Key companies in the market include KGHM, Codelco, BHP, Aurubis AG, Southern Copper Corporation, Group Mexico, Xstrata Plc, Glencore, Chinalco Shanghai Copper, Freeport-McMoRan Copper & Gold.
3. What are the main segments of the Copper Market?
The market segments include End-user Industry.
4. Can you provide details about the market size?
The market size is estimated to be USD XX Million as of 2022.
5. What are some drivers contributing to market growth?
Growing Demand from Electronics and Construction Industry; Other Drivers.
6. What are the notable trends driving market growth?
Growing Demand for Electrical and Electronics Segment.
7. Are there any restraints impacting market growth?
Stringent Regulations Associated with Mining.
8. Can you provide examples of recent developments in the market?
November 2021: Aurubis AG further expanded its activities in recycling metal-bearing materials internationally. It started the construction of a multi metal recycling plant in the US state of Georgia. Circuit boards, copper cable, and other recycling materials containing metals will be processed into 35,000 tons of blister copper annually.
9. What pricing options are available for accessing the report?
Pricing options include single-user, multi-user, and enterprise licenses priced at USD 4750, USD 5250, and USD 8750 respectively.
10. Is the market size provided in terms of value or volume?
The market size is provided in terms of value, measured in Million and volume, measured in K Tons.
11. Are there any specific market keywords associated with the report?
Yes, the market keyword associated with the report is "Copper Market," which aids in identifying and referencing the specific market segment covered.
12. How do I determine which pricing option suits my needs best?
The pricing options vary based on user requirements and access needs. Individual users may opt for single-user licenses, while businesses requiring broader access may choose multi-user or enterprise licenses for cost-effective access to the report.
13. Are there any additional resources or data provided in the Copper Market report?
While the report offers comprehensive insights, it's advisable to review the specific contents or supplementary materials provided to ascertain if additional resources or data are available.
14. How can I stay updated on further developments or reports in the Copper Market?
To stay informed about further developments, trends, and reports in the Copper Market, consider subscribing to industry newsletters, following relevant companies and organizations, or regularly checking reputable industry news sources and publications.
Methodology
Step 1 - Identification of Relevant Samples Size from Population Database


Step 2 - Approaches for Defining Global Market Size (Value, Volume* & Price*)

Note*: In applicable scenarios
Step 3 - Data Sources
Primary Research
- Web Analytics
- Survey Reports
- Research Institute
- Latest Research Reports
- Opinion Leaders
Secondary Research
- Annual Reports
- White Paper
- Latest Press Release
- Industry Association
- Paid Database
- Investor Presentations

Step 4 - Data Triangulation
Involves using different sources of information in order to increase the validity of a study
These sources are likely to be stakeholders in a program - participants, other researchers, program staff, other community members, and so on.
Then we put all data in single framework & apply various statistical tools to find out the dynamic on the market.
During the analysis stage, feedback from the stakeholder groups would be compared to determine areas of agreement as well as areas of divergence