

Key Insights
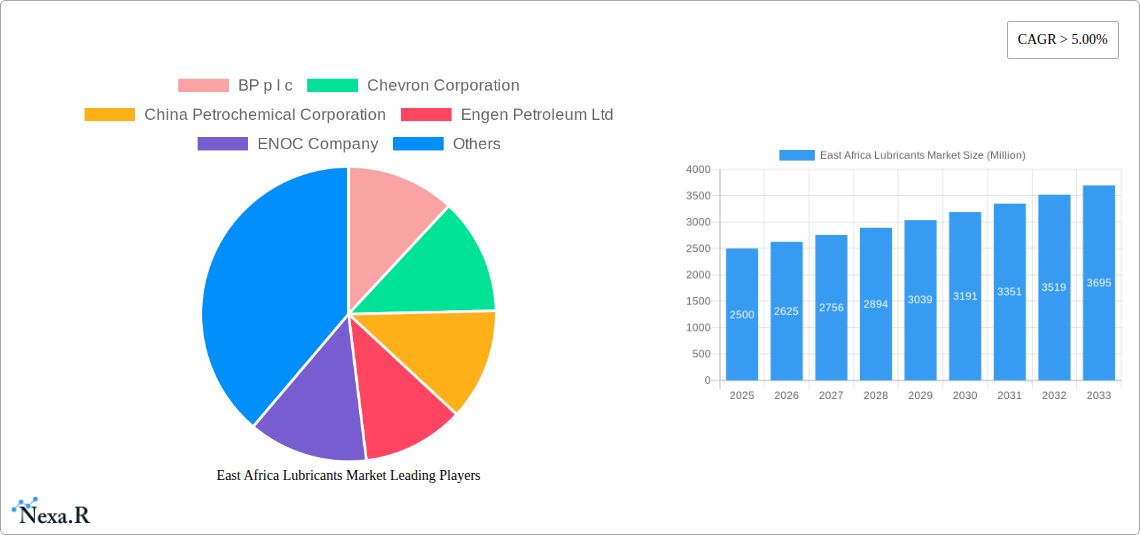
The East African lubricants market is poised for significant expansion, with an estimated compound annual growth rate (CAGR) exceeding 5% from 2025 to 2033. This upward trajectory is propelled by a confluence of factors, including the robust growth of the automotive sector, escalating construction, and increased industrial activities throughout the region. Rising disposable incomes and a burgeoning middle class are key drivers, fostering higher vehicle ownership and subsequently, greater demand for lubricants. Government-led initiatives in infrastructure development and transportation network enhancement further contribute to this positive market outlook. While challenges such as crude oil price volatility and the prevalence of counterfeit products persist, they are counterbalanced by strong underlying economic expansion and progressive industrialization across key East African economies including Kenya, Tanzania, and Uganda. The market is segmented by lubricant type (e.g., engine oils, gear oils, greases), application (automotive, industrial), and distribution channels. Leading global players like BP, Shell, and ExxonMobil compete with established regional and local companies, fostering a dynamic marketplace. Strategic efforts focused on expanding distribution networks and advancing lubricant formulation technology are set to bolster market prospects. The long-term forecast for the East African lubricants market remains highly optimistic, indicating substantial growth potential throughout the review period.
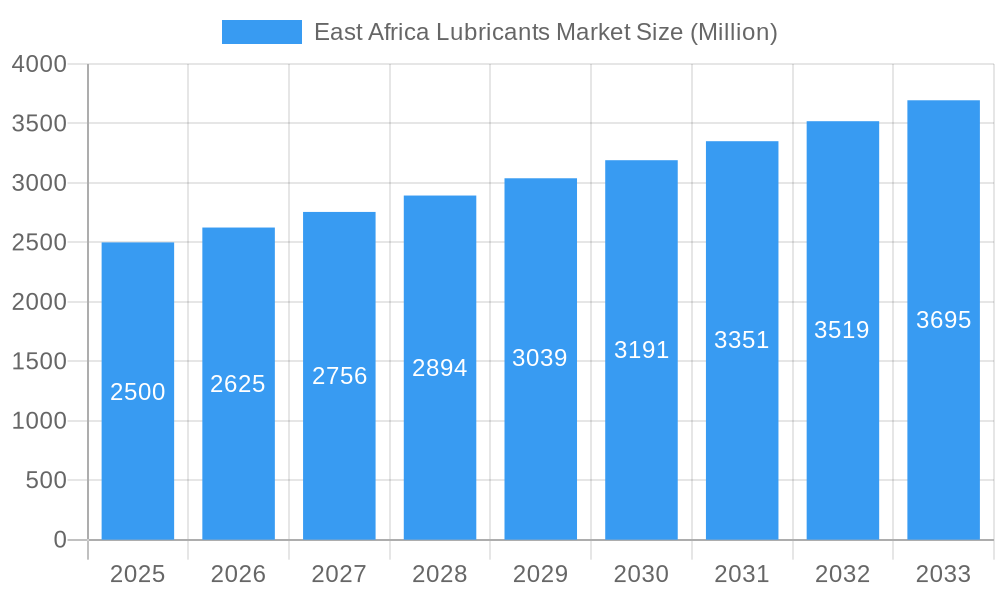
East Africa Lubricants Market Market Size (In Million)
The competitive environment features a strategic interplay between multinational corporations and agile local entities. Global players capitalize on their renowned brands, advanced technological capabilities, and expansive distribution infrastructure to secure substantial market share. Concurrently, regional companies are making notable inroads by leveraging their deep understanding of local market nuances and implementing competitive pricing strategies. The market is also characterized by the emergence of innovative lubricant formulations, emphasizing enhanced performance and environmental sustainability in alignment with global ecological directives. A critical consideration is the escalating focus on lubricant quality and adherence to standardization. Heightened consumer awareness and more stringent regulatory frameworks are accelerating the demand for premium, certified lubricants. This presents a valuable opportunity for both international and local enterprises to differentiate their offerings and build brand loyalty founded on superior quality and unwavering reliability. The forecast period is expected to witness accelerated market consolidation through strategic mergers and acquisitions, as companies endeavor to fortify their market positions and broaden their operational reach.
East Africa Lubricants Market Company Market Share
East Africa Lubricants Market: A Comprehensive Report (2019-2033)
This comprehensive report provides an in-depth analysis of the East Africa lubricants market, encompassing market dynamics, growth trends, regional dominance, product landscape, key players, and future outlook. The study period covers 2019-2033, with 2025 as the base year and a forecast period of 2025-2033. This report is crucial for industry professionals, investors, and anyone seeking to understand this dynamic market. The report analyzes both the parent market (East Africa Lubricants) and child markets (specific lubricant types and applications within East Africa).
East Africa Lubricants Market Dynamics & Structure
The East Africa lubricants market is characterized by a moderately concentrated structure, with key players like BP plc, Chevron Corporation, China Petrochemical Corporation, and Shell PLC holding significant market share (estimated at xx% collectively in 2025). However, smaller regional players and independent distributors also contribute significantly. Technological innovation, driven by the increasing demand for energy-efficient and environmentally friendly lubricants, is a major growth driver. Stringent regulatory frameworks concerning environmental protection and product safety shape market dynamics. Competition from substitute products, particularly bio-based lubricants, is increasing.
- Market Concentration: Moderately concentrated, with a few major players dominating (xx% market share in 2025).
- Technological Innovation: Focus on energy efficiency, bio-based lubricants, and enhanced performance characteristics.
- Regulatory Framework: Stringent environmental regulations impacting product formulations and disposal.
- Competitive Substitutes: Growing presence of bio-based and synthetic lubricants.
- End-User Demographics: Diverse end-user base including transportation, industrial, and agricultural sectors.
- M&A Trends: Significant activity, with the Engen and Vivo Energy merger in February 2023 being a notable example, signifying consolidation within the market (xx M&A deals in the past 5 years).
East Africa Lubricants Market Growth Trends & Insights
The East Africa lubricants market witnessed robust growth during the historical period (2019-2024), expanding at a CAGR of xx%. This growth is projected to continue during the forecast period (2025-2033), with a projected CAGR of xx%, driven by factors such as expanding industrialization, rising vehicle ownership, and increasing agricultural activities. Market penetration is currently at xx%, with significant potential for further expansion in less developed regions. Technological disruptions, such as the introduction of advanced lubricant formulations and improved distribution networks, are accelerating adoption rates. Shifting consumer preferences towards energy-efficient and eco-friendly products are also reshaping the market. Market size is estimated at xx Million units in 2025 and is projected to reach xx Million units by 2033.
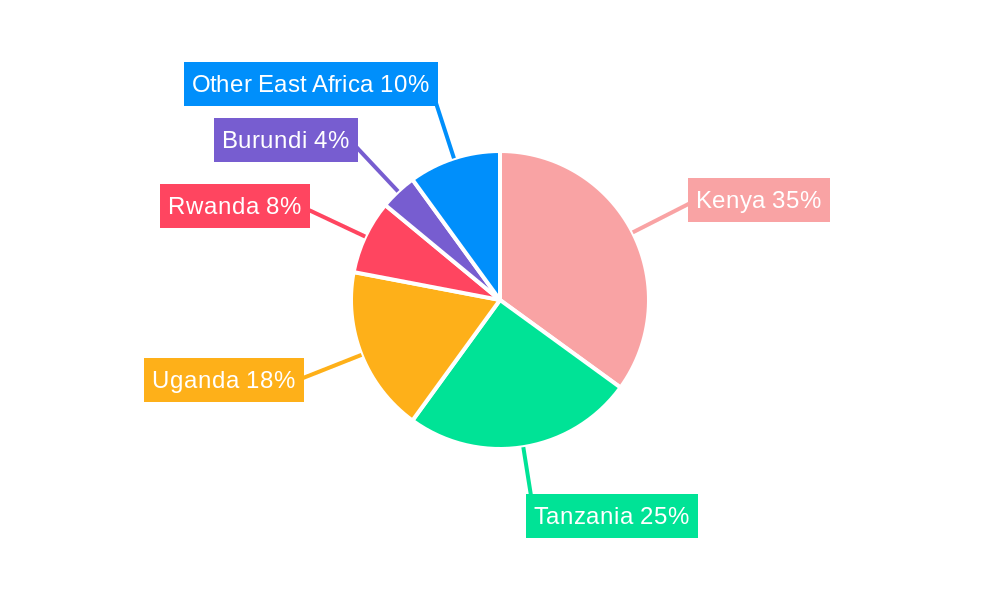
Dominant Regions, Countries, or Segments in East Africa Lubricants Market
Kenya and Tanzania represent the leading markets within East Africa, driven by robust economic growth, expanding infrastructure development, and significant investments in transportation and industrial sectors. The transportation segment holds the largest market share, followed by the industrial segment.
- Kenya: Strong economic growth and infrastructure development drive market expansion.
- Tanzania: Significant investments in transportation and industrial sectors contribute to demand.
- Uganda: Growing industrial sector and agricultural activities fuel lubricant demand.
- Ethiopia: Potential for growth with improving infrastructure and economic expansion.
- Rwanda: Relatively smaller market but showing promising growth potential.
East Africa Lubricants Market Product Landscape
The East Africa lubricants market offers a diverse range of products, including engine oils, gear oils, greases, and specialized industrial lubricants. Recent innovations focus on improved energy efficiency, extended drain intervals, and enhanced performance under demanding operating conditions. The focus on environmentally acceptable lubricants (EALs), as exemplified by Chevron's launch of Clarity Synthetic EA Grease 0 in November 2022, demonstrates a key trend. Many manufacturers emphasize unique selling propositions like superior wear protection, extended oil life, and reduced emissions.
Key Drivers, Barriers & Challenges in East Africa Lubricants Market
Key Drivers:
- Rapid economic growth and industrialization.
- Increasing vehicle ownership and transportation sector expansion.
- Growth of the agricultural sector.
- Investments in infrastructure projects.
Challenges:
- Fluctuating crude oil prices impacting input costs.
- Counterfeit products impacting market integrity (estimated xx% of the market in 2025).
- Supply chain disruptions impacting availability and pricing.
- Competition from imported lubricants, particularly from Asia.
Emerging Opportunities in East Africa Lubricants Market
Untapped markets in rural areas, the growing demand for specialized lubricants in emerging industries (e.g., renewable energy), and the increasing adoption of digital technologies in distribution and marketing represent significant opportunities. The growing focus on sustainability and environmental regulations create opportunities for bio-based and environmentally friendly lubricant solutions.
Growth Accelerators in the East Africa Lubricants Market Industry
Technological advancements in lubricant formulations, strategic partnerships between lubricant manufacturers and vehicle OEMs, and expansion into new markets through improved distribution networks are key growth catalysts. Government initiatives promoting infrastructure development and industrialization also contribute significantly.
Key Players Shaping the East Africa Lubricants Market Market
- BP plc
- Chevron Corporation
- China Petrochemical Corporation
- Engen Petroleum Ltd
- ENOC Company
- Exxon Mobil Corporation
- General Petroleum
- Hass Petroleum
- Lake Group
- LIQUI MOLY GmbH
- Mineral Oil Corporation Limited
- Motul S A
- National Oil Corporation of Kenya
- Oryx Energies SA
- Shell PLC
- TotalEnergies
- List Not Exhaustive
Notable Milestones in East Africa Lubricants Market Sector
- February 2023: Engen and Vivo Energy merged, creating one of Africa's largest energy distribution companies.
- November 2022: Chevron Corporation launched environmentally acceptable lubricants (EALs) for marine applications.
In-Depth East Africa Lubricants Market Market Outlook
The East Africa lubricants market presents significant long-term growth potential driven by sustained economic growth, infrastructure development, and increasing vehicle ownership. Strategic opportunities exist for companies focusing on innovation, sustainability, and efficient distribution networks. The market is poised for further consolidation, with opportunities for both large multinational players and smaller regional companies to expand their market share.
East Africa Lubricants Market Segmentation
-
1. End User
-
1.1. Automotive
- 1.1.1. Passenger Vehicles
- 1.1.2. Commercial Vehicles
- 1.1.3. Motorcycles
- 1.2. Heavy Equipment
- 1.3. Metallurgy and Metalworking
- 1.4. Power Generation
- 1.5. Marine
- 1.6. Other End-user Industries (Oil and Gas, Etc.)
-
1.1. Automotive
-
2. Product Type
- 2.1. Engine Oils
- 2.2. Greases
- 2.3. Hydraulic Fluids
- 2.4. Metalworking Fluids
- 2.5. Transmission and Gear Oils
- 2.6. Other Pr
-
3. Geography
- 3.1. Kenya
- 3.2. Tanzania
- 3.3. Democratic Republic of Congo
- 3.4. Burundi
- 3.5. Uganda
- 3.6. Ethiopia
- 3.7. Rwanda
East Africa Lubricants Market Segmentation By Geography
- 1. Kenya
- 2. Tanzania
- 3. Democratic Republic of Congo
- 4. Burundi
- 5. Uganda
- 6. Ethiopia
- 7. Rwanda
East Africa Lubricants Market Regional Market Share
Geographic Coverage of East Africa Lubricants Market
East Africa Lubricants Market REPORT HIGHLIGHTS
| Aspects | Details |
|---|---|
| Study Period | 2020-2034 |
| Base Year | 2025 |
| Estimated Year | 2026 |
| Forecast Period | 2026-2034 |
| Historical Period | 2020-2025 |
| Growth Rate | CAGR of 5% from 2020-2034 |
| Segmentation |
|
Table of Contents
- 1. Introduction
- 1.1. Research Scope
- 1.2. Market Segmentation
- 1.3. Research Objective
- 1.4. Definitions and Assumptions
- 2. Executive Summary
- 2.1. Market Snapshot
- 3. Market Dynamics
- 3.1. Market Drivers
- 3.2. Market Restrains
- 3.3. Market Trends
- 3.4. Market Opportunities
- 4. Market Factor Analysis
- 4.1. Porters Five Forces
- 4.1.1. Bargaining Power of Suppliers
- 4.1.2. Bargaining Power of Buyers
- 4.1.3. Threat of New Entrants
- 4.1.4. Threat of Substitutes
- 4.1.5. Competitive Rivalry
- 4.2. PESTEL analysis
- 4.3. BCG Analysis
- 4.3.1. Stars (High Growth, High Market Share)
- 4.3.2. Cash Cows (Low Growth, High Market Share)
- 4.3.3. Question Mark (High Growth, Low Market Share)
- 4.3.4. Dogs (Low Growth, Low Market Share)
- 4.4. Ansoff Matrix Analysis
- 4.5. Supply Chain Analysis
- 4.6. Regulatory Landscape
- 4.7. Current Market Potential and Opportunity Assessment (TAM–SAM–SOM Framework)
- 4.8. NRP Analyst Note
- 4.1. Porters Five Forces
- 5. Market Analysis, Insights and Forecast 2021-2033
- 5.1. Market Analysis, Insights and Forecast - by End User
- 5.1.1. Automotive
- 5.1.1.1. Passenger Vehicles
- 5.1.1.2. Commercial Vehicles
- 5.1.1.3. Motorcycles
- 5.1.2. Heavy Equipment
- 5.1.3. Metallurgy and Metalworking
- 5.1.4. Power Generation
- 5.1.5. Marine
- 5.1.6. Other End-user Industries (Oil and Gas, Etc.)
- 5.1.1. Automotive
- 5.2. Market Analysis, Insights and Forecast - by Product Type
- 5.2.1. Engine Oils
- 5.2.2. Greases
- 5.2.3. Hydraulic Fluids
- 5.2.4. Metalworking Fluids
- 5.2.5. Transmission and Gear Oils
- 5.2.6. Other Pr
- 5.3. Market Analysis, Insights and Forecast - by Geography
- 5.3.1. Kenya
- 5.3.2. Tanzania
- 5.3.3. Democratic Republic of Congo
- 5.3.4. Burundi
- 5.3.5. Uganda
- 5.3.6. Ethiopia
- 5.3.7. Rwanda
- 5.4. Market Analysis, Insights and Forecast - by Region
- 5.4.1. Kenya
- 5.4.2. Tanzania
- 5.4.3. Democratic Republic of Congo
- 5.4.4. Burundi
- 5.4.5. Uganda
- 5.4.6. Ethiopia
- 5.4.7. Rwanda
- 5.1. Market Analysis, Insights and Forecast - by End User
- 6. Global East Africa Lubricants Market Analysis, Insights and Forecast, 2021-2033
- 6.1. Market Analysis, Insights and Forecast - by End User
- 6.1.1. Automotive
- 6.1.1.1. Passenger Vehicles
- 6.1.1.2. Commercial Vehicles
- 6.1.1.3. Motorcycles
- 6.1.2. Heavy Equipment
- 6.1.3. Metallurgy and Metalworking
- 6.1.4. Power Generation
- 6.1.5. Marine
- 6.1.6. Other End-user Industries (Oil and Gas, Etc.)
- 6.1.1. Automotive
- 6.2. Market Analysis, Insights and Forecast - by Product Type
- 6.2.1. Engine Oils
- 6.2.2. Greases
- 6.2.3. Hydraulic Fluids
- 6.2.4. Metalworking Fluids
- 6.2.5. Transmission and Gear Oils
- 6.2.6. Other Pr
- 6.3. Market Analysis, Insights and Forecast - by Geography
- 6.3.1. Kenya
- 6.3.2. Tanzania
- 6.3.3. Democratic Republic of Congo
- 6.3.4. Burundi
- 6.3.5. Uganda
- 6.3.6. Ethiopia
- 6.3.7. Rwanda
- 6.1. Market Analysis, Insights and Forecast - by End User
- 7. Kenya East Africa Lubricants Market Analysis, Insights and Forecast, 2020-2032
- 7.1. Market Analysis, Insights and Forecast - by End User
- 7.1.1. Automotive
- 7.1.1.1. Passenger Vehicles
- 7.1.1.2. Commercial Vehicles
- 7.1.1.3. Motorcycles
- 7.1.2. Heavy Equipment
- 7.1.3. Metallurgy and Metalworking
- 7.1.4. Power Generation
- 7.1.5. Marine
- 7.1.6. Other End-user Industries (Oil and Gas, Etc.)
- 7.1.1. Automotive
- 7.2. Market Analysis, Insights and Forecast - by Product Type
- 7.2.1. Engine Oils
- 7.2.2. Greases
- 7.2.3. Hydraulic Fluids
- 7.2.4. Metalworking Fluids
- 7.2.5. Transmission and Gear Oils
- 7.2.6. Other Pr
- 7.3. Market Analysis, Insights and Forecast - by Geography
- 7.3.1. Kenya
- 7.3.2. Tanzania
- 7.3.3. Democratic Republic of Congo
- 7.3.4. Burundi
- 7.3.5. Uganda
- 7.3.6. Ethiopia
- 7.3.7. Rwanda
- 7.1. Market Analysis, Insights and Forecast - by End User
- 8. Tanzania East Africa Lubricants Market Analysis, Insights and Forecast, 2020-2032
- 8.1. Market Analysis, Insights and Forecast - by End User
- 8.1.1. Automotive
- 8.1.1.1. Passenger Vehicles
- 8.1.1.2. Commercial Vehicles
- 8.1.1.3. Motorcycles
- 8.1.2. Heavy Equipment
- 8.1.3. Metallurgy and Metalworking
- 8.1.4. Power Generation
- 8.1.5. Marine
- 8.1.6. Other End-user Industries (Oil and Gas, Etc.)
- 8.1.1. Automotive
- 8.2. Market Analysis, Insights and Forecast - by Product Type
- 8.2.1. Engine Oils
- 8.2.2. Greases
- 8.2.3. Hydraulic Fluids
- 8.2.4. Metalworking Fluids
- 8.2.5. Transmission and Gear Oils
- 8.2.6. Other Pr
- 8.3. Market Analysis, Insights and Forecast - by Geography
- 8.3.1. Kenya
- 8.3.2. Tanzania
- 8.3.3. Democratic Republic of Congo
- 8.3.4. Burundi
- 8.3.5. Uganda
- 8.3.6. Ethiopia
- 8.3.7. Rwanda
- 8.1. Market Analysis, Insights and Forecast - by End User
- 9. Democratic Republic of Congo East Africa Lubricants Market Analysis, Insights and Forecast, 2020-2032
- 9.1. Market Analysis, Insights and Forecast - by End User
- 9.1.1. Automotive
- 9.1.1.1. Passenger Vehicles
- 9.1.1.2. Commercial Vehicles
- 9.1.1.3. Motorcycles
- 9.1.2. Heavy Equipment
- 9.1.3. Metallurgy and Metalworking
- 9.1.4. Power Generation
- 9.1.5. Marine
- 9.1.6. Other End-user Industries (Oil and Gas, Etc.)
- 9.1.1. Automotive
- 9.2. Market Analysis, Insights and Forecast - by Product Type
- 9.2.1. Engine Oils
- 9.2.2. Greases
- 9.2.3. Hydraulic Fluids
- 9.2.4. Metalworking Fluids
- 9.2.5. Transmission and Gear Oils
- 9.2.6. Other Pr
- 9.3. Market Analysis, Insights and Forecast - by Geography
- 9.3.1. Kenya
- 9.3.2. Tanzania
- 9.3.3. Democratic Republic of Congo
- 9.3.4. Burundi
- 9.3.5. Uganda
- 9.3.6. Ethiopia
- 9.3.7. Rwanda
- 9.1. Market Analysis, Insights and Forecast - by End User
- 10. Burundi East Africa Lubricants Market Analysis, Insights and Forecast, 2020-2032
- 10.1. Market Analysis, Insights and Forecast - by End User
- 10.1.1. Automotive
- 10.1.1.1. Passenger Vehicles
- 10.1.1.2. Commercial Vehicles
- 10.1.1.3. Motorcycles
- 10.1.2. Heavy Equipment
- 10.1.3. Metallurgy and Metalworking
- 10.1.4. Power Generation
- 10.1.5. Marine
- 10.1.6. Other End-user Industries (Oil and Gas, Etc.)
- 10.1.1. Automotive
- 10.2. Market Analysis, Insights and Forecast - by Product Type
- 10.2.1. Engine Oils
- 10.2.2. Greases
- 10.2.3. Hydraulic Fluids
- 10.2.4. Metalworking Fluids
- 10.2.5. Transmission and Gear Oils
- 10.2.6. Other Pr
- 10.3. Market Analysis, Insights and Forecast - by Geography
- 10.3.1. Kenya
- 10.3.2. Tanzania
- 10.3.3. Democratic Republic of Congo
- 10.3.4. Burundi
- 10.3.5. Uganda
- 10.3.6. Ethiopia
- 10.3.7. Rwanda
- 10.1. Market Analysis, Insights and Forecast - by End User
- 11. Uganda East Africa Lubricants Market Analysis, Insights and Forecast, 2020-2032
- 11.1. Market Analysis, Insights and Forecast - by End User
- 11.1.1. Automotive
- 11.1.1.1. Passenger Vehicles
- 11.1.1.2. Commercial Vehicles
- 11.1.1.3. Motorcycles
- 11.1.2. Heavy Equipment
- 11.1.3. Metallurgy and Metalworking
- 11.1.4. Power Generation
- 11.1.5. Marine
- 11.1.6. Other End-user Industries (Oil and Gas, Etc.)
- 11.1.1. Automotive
- 11.2. Market Analysis, Insights and Forecast - by Product Type
- 11.2.1. Engine Oils
- 11.2.2. Greases
- 11.2.3. Hydraulic Fluids
- 11.2.4. Metalworking Fluids
- 11.2.5. Transmission and Gear Oils
- 11.2.6. Other Pr
- 11.3. Market Analysis, Insights and Forecast - by Geography
- 11.3.1. Kenya
- 11.3.2. Tanzania
- 11.3.3. Democratic Republic of Congo
- 11.3.4. Burundi
- 11.3.5. Uganda
- 11.3.6. Ethiopia
- 11.3.7. Rwanda
- 11.1. Market Analysis, Insights and Forecast - by End User
- 12. Ethiopia East Africa Lubricants Market Analysis, Insights and Forecast, 2020-2032
- 12.1. Market Analysis, Insights and Forecast - by End User
- 12.1.1. Automotive
- 12.1.1.1. Passenger Vehicles
- 12.1.1.2. Commercial Vehicles
- 12.1.1.3. Motorcycles
- 12.1.2. Heavy Equipment
- 12.1.3. Metallurgy and Metalworking
- 12.1.4. Power Generation
- 12.1.5. Marine
- 12.1.6. Other End-user Industries (Oil and Gas, Etc.)
- 12.1.1. Automotive
- 12.2. Market Analysis, Insights and Forecast - by Product Type
- 12.2.1. Engine Oils
- 12.2.2. Greases
- 12.2.3. Hydraulic Fluids
- 12.2.4. Metalworking Fluids
- 12.2.5. Transmission and Gear Oils
- 12.2.6. Other Pr
- 12.3. Market Analysis, Insights and Forecast - by Geography
- 12.3.1. Kenya
- 12.3.2. Tanzania
- 12.3.3. Democratic Republic of Congo
- 12.3.4. Burundi
- 12.3.5. Uganda
- 12.3.6. Ethiopia
- 12.3.7. Rwanda
- 12.1. Market Analysis, Insights and Forecast - by End User
- 13. Rwanda East Africa Lubricants Market Analysis, Insights and Forecast, 2020-2032
- 13.1. Market Analysis, Insights and Forecast - by End User
- 13.1.1. Automotive
- 13.1.1.1. Passenger Vehicles
- 13.1.1.2. Commercial Vehicles
- 13.1.1.3. Motorcycles
- 13.1.2. Heavy Equipment
- 13.1.3. Metallurgy and Metalworking
- 13.1.4. Power Generation
- 13.1.5. Marine
- 13.1.6. Other End-user Industries (Oil and Gas, Etc.)
- 13.1.1. Automotive
- 13.2. Market Analysis, Insights and Forecast - by Product Type
- 13.2.1. Engine Oils
- 13.2.2. Greases
- 13.2.3. Hydraulic Fluids
- 13.2.4. Metalworking Fluids
- 13.2.5. Transmission and Gear Oils
- 13.2.6. Other Pr
- 13.3. Market Analysis, Insights and Forecast - by Geography
- 13.3.1. Kenya
- 13.3.2. Tanzania
- 13.3.3. Democratic Republic of Congo
- 13.3.4. Burundi
- 13.3.5. Uganda
- 13.3.6. Ethiopia
- 13.3.7. Rwanda
- 13.1. Market Analysis, Insights and Forecast - by End User
- 14. Competitive Analysis
- 14.1. Company Profiles
- 14.1.1 BP p l c
- 14.1.1.1. Company Overview
- 14.1.1.2. Products
- 14.1.1.3. Company Financials
- 14.1.1.4. SWOT Analysis
- 14.1.2 Chevron Corporation
- 14.1.2.1. Company Overview
- 14.1.2.2. Products
- 14.1.2.3. Company Financials
- 14.1.2.4. SWOT Analysis
- 14.1.3 China Petrochemical Corporation
- 14.1.3.1. Company Overview
- 14.1.3.2. Products
- 14.1.3.3. Company Financials
- 14.1.3.4. SWOT Analysis
- 14.1.4 Engen Petroleum Ltd
- 14.1.4.1. Company Overview
- 14.1.4.2. Products
- 14.1.4.3. Company Financials
- 14.1.4.4. SWOT Analysis
- 14.1.5 ENOC Company
- 14.1.5.1. Company Overview
- 14.1.5.2. Products
- 14.1.5.3. Company Financials
- 14.1.5.4. SWOT Analysis
- 14.1.6 Exxon Mobil Corporation
- 14.1.6.1. Company Overview
- 14.1.6.2. Products
- 14.1.6.3. Company Financials
- 14.1.6.4. SWOT Analysis
- 14.1.7 General Petroleum
- 14.1.7.1. Company Overview
- 14.1.7.2. Products
- 14.1.7.3. Company Financials
- 14.1.7.4. SWOT Analysis
- 14.1.8 Hass Petroleum
- 14.1.8.1. Company Overview
- 14.1.8.2. Products
- 14.1.8.3. Company Financials
- 14.1.8.4. SWOT Analysis
- 14.1.9 Lake Group
- 14.1.9.1. Company Overview
- 14.1.9.2. Products
- 14.1.9.3. Company Financials
- 14.1.9.4. SWOT Analysis
- 14.1.10 LIQUI MOLY GmbH
- 14.1.10.1. Company Overview
- 14.1.10.2. Products
- 14.1.10.3. Company Financials
- 14.1.10.4. SWOT Analysis
- 14.1.11 Mineral Oil Corporation Limited
- 14.1.11.1. Company Overview
- 14.1.11.2. Products
- 14.1.11.3. Company Financials
- 14.1.11.4. SWOT Analysis
- 14.1.12 Motul S A
- 14.1.12.1. Company Overview
- 14.1.12.2. Products
- 14.1.12.3. Company Financials
- 14.1.12.4. SWOT Analysis
- 14.1.13 National Oil Corporation of Kenya
- 14.1.13.1. Company Overview
- 14.1.13.2. Products
- 14.1.13.3. Company Financials
- 14.1.13.4. SWOT Analysis
- 14.1.14 Oryx Energies SA
- 14.1.14.1. Company Overview
- 14.1.14.2. Products
- 14.1.14.3. Company Financials
- 14.1.14.4. SWOT Analysis
- 14.1.15 Shell PLC
- 14.1.15.1. Company Overview
- 14.1.15.2. Products
- 14.1.15.3. Company Financials
- 14.1.15.4. SWOT Analysis
- 14.1.16 TotalEnergies*List Not Exhaustive
- 14.1.16.1. Company Overview
- 14.1.16.2. Products
- 14.1.16.3. Company Financials
- 14.1.16.4. SWOT Analysis
- 14.1.1 BP p l c
- 14.2. Market Entropy
- 14.2.1 Company's Key Areas Served
- 14.2.2 Recent Developments
- 14.3. Company Market Share Analysis 2025
- 14.3.1 Top 5 Companies Market Share Analysis
- 14.3.2 Top 3 Companies Market Share Analysis
- 14.4. List of Potential Customers
- 15. Research Methodology
List of Figures
- Figure 1: Global East Africa Lubricants Market Revenue Breakdown (million, %) by Region 2025 & 2033
- Figure 2: Kenya East Africa Lubricants Market Revenue (million), by End User 2025 & 2033
- Figure 3: Kenya East Africa Lubricants Market Revenue Share (%), by End User 2025 & 2033
- Figure 4: Kenya East Africa Lubricants Market Revenue (million), by Product Type 2025 & 2033
- Figure 5: Kenya East Africa Lubricants Market Revenue Share (%), by Product Type 2025 & 2033
- Figure 6: Kenya East Africa Lubricants Market Revenue (million), by Geography 2025 & 2033
- Figure 7: Kenya East Africa Lubricants Market Revenue Share (%), by Geography 2025 & 2033
- Figure 8: Kenya East Africa Lubricants Market Revenue (million), by Country 2025 & 2033
- Figure 9: Kenya East Africa Lubricants Market Revenue Share (%), by Country 2025 & 2033
- Figure 10: Tanzania East Africa Lubricants Market Revenue (million), by End User 2025 & 2033
- Figure 11: Tanzania East Africa Lubricants Market Revenue Share (%), by End User 2025 & 2033
- Figure 12: Tanzania East Africa Lubricants Market Revenue (million), by Product Type 2025 & 2033
- Figure 13: Tanzania East Africa Lubricants Market Revenue Share (%), by Product Type 2025 & 2033
- Figure 14: Tanzania East Africa Lubricants Market Revenue (million), by Geography 2025 & 2033
- Figure 15: Tanzania East Africa Lubricants Market Revenue Share (%), by Geography 2025 & 2033
- Figure 16: Tanzania East Africa Lubricants Market Revenue (million), by Country 2025 & 2033
- Figure 17: Tanzania East Africa Lubricants Market Revenue Share (%), by Country 2025 & 2033
- Figure 18: Democratic Republic of Congo East Africa Lubricants Market Revenue (million), by End User 2025 & 2033
- Figure 19: Democratic Republic of Congo East Africa Lubricants Market Revenue Share (%), by End User 2025 & 2033
- Figure 20: Democratic Republic of Congo East Africa Lubricants Market Revenue (million), by Product Type 2025 & 2033
- Figure 21: Democratic Republic of Congo East Africa Lubricants Market Revenue Share (%), by Product Type 2025 & 2033
- Figure 22: Democratic Republic of Congo East Africa Lubricants Market Revenue (million), by Geography 2025 & 2033
- Figure 23: Democratic Republic of Congo East Africa Lubricants Market Revenue Share (%), by Geography 2025 & 2033
- Figure 24: Democratic Republic of Congo East Africa Lubricants Market Revenue (million), by Country 2025 & 2033
- Figure 25: Democratic Republic of Congo East Africa Lubricants Market Revenue Share (%), by Country 2025 & 2033
- Figure 26: Burundi East Africa Lubricants Market Revenue (million), by End User 2025 & 2033
- Figure 27: Burundi East Africa Lubricants Market Revenue Share (%), by End User 2025 & 2033
- Figure 28: Burundi East Africa Lubricants Market Revenue (million), by Product Type 2025 & 2033
- Figure 29: Burundi East Africa Lubricants Market Revenue Share (%), by Product Type 2025 & 2033
- Figure 30: Burundi East Africa Lubricants Market Revenue (million), by Geography 2025 & 2033
- Figure 31: Burundi East Africa Lubricants Market Revenue Share (%), by Geography 2025 & 2033
- Figure 32: Burundi East Africa Lubricants Market Revenue (million), by Country 2025 & 2033
- Figure 33: Burundi East Africa Lubricants Market Revenue Share (%), by Country 2025 & 2033
- Figure 34: Uganda East Africa Lubricants Market Revenue (million), by End User 2025 & 2033
- Figure 35: Uganda East Africa Lubricants Market Revenue Share (%), by End User 2025 & 2033
- Figure 36: Uganda East Africa Lubricants Market Revenue (million), by Product Type 2025 & 2033
- Figure 37: Uganda East Africa Lubricants Market Revenue Share (%), by Product Type 2025 & 2033
- Figure 38: Uganda East Africa Lubricants Market Revenue (million), by Geography 2025 & 2033
- Figure 39: Uganda East Africa Lubricants Market Revenue Share (%), by Geography 2025 & 2033
- Figure 40: Uganda East Africa Lubricants Market Revenue (million), by Country 2025 & 2033
- Figure 41: Uganda East Africa Lubricants Market Revenue Share (%), by Country 2025 & 2033
- Figure 42: Ethiopia East Africa Lubricants Market Revenue (million), by End User 2025 & 2033
- Figure 43: Ethiopia East Africa Lubricants Market Revenue Share (%), by End User 2025 & 2033
- Figure 44: Ethiopia East Africa Lubricants Market Revenue (million), by Product Type 2025 & 2033
- Figure 45: Ethiopia East Africa Lubricants Market Revenue Share (%), by Product Type 2025 & 2033
- Figure 46: Ethiopia East Africa Lubricants Market Revenue (million), by Geography 2025 & 2033
- Figure 47: Ethiopia East Africa Lubricants Market Revenue Share (%), by Geography 2025 & 2033
- Figure 48: Ethiopia East Africa Lubricants Market Revenue (million), by Country 2025 & 2033
- Figure 49: Ethiopia East Africa Lubricants Market Revenue Share (%), by Country 2025 & 2033
- Figure 50: Rwanda East Africa Lubricants Market Revenue (million), by End User 2025 & 2033
- Figure 51: Rwanda East Africa Lubricants Market Revenue Share (%), by End User 2025 & 2033
- Figure 52: Rwanda East Africa Lubricants Market Revenue (million), by Product Type 2025 & 2033
- Figure 53: Rwanda East Africa Lubricants Market Revenue Share (%), by Product Type 2025 & 2033
- Figure 54: Rwanda East Africa Lubricants Market Revenue (million), by Geography 2025 & 2033
- Figure 55: Rwanda East Africa Lubricants Market Revenue Share (%), by Geography 2025 & 2033
- Figure 56: Rwanda East Africa Lubricants Market Revenue (million), by Country 2025 & 2033
- Figure 57: Rwanda East Africa Lubricants Market Revenue Share (%), by Country 2025 & 2033
List of Tables
- Table 1: Global East Africa Lubricants Market Revenue million Forecast, by End User 2020 & 2033
- Table 2: Global East Africa Lubricants Market Revenue million Forecast, by Product Type 2020 & 2033
- Table 3: Global East Africa Lubricants Market Revenue million Forecast, by Geography 2020 & 2033
- Table 4: Global East Africa Lubricants Market Revenue million Forecast, by Region 2020 & 2033
- Table 5: Global East Africa Lubricants Market Revenue million Forecast, by End User 2020 & 2033
- Table 6: Global East Africa Lubricants Market Revenue million Forecast, by Product Type 2020 & 2033
- Table 7: Global East Africa Lubricants Market Revenue million Forecast, by Geography 2020 & 2033
- Table 8: Global East Africa Lubricants Market Revenue million Forecast, by Country 2020 & 2033
- Table 9: Global East Africa Lubricants Market Revenue million Forecast, by End User 2020 & 2033
- Table 10: Global East Africa Lubricants Market Revenue million Forecast, by Product Type 2020 & 2033
- Table 11: Global East Africa Lubricants Market Revenue million Forecast, by Geography 2020 & 2033
- Table 12: Global East Africa Lubricants Market Revenue million Forecast, by Country 2020 & 2033
- Table 13: Global East Africa Lubricants Market Revenue million Forecast, by End User 2020 & 2033
- Table 14: Global East Africa Lubricants Market Revenue million Forecast, by Product Type 2020 & 2033
- Table 15: Global East Africa Lubricants Market Revenue million Forecast, by Geography 2020 & 2033
- Table 16: Global East Africa Lubricants Market Revenue million Forecast, by Country 2020 & 2033
- Table 17: Global East Africa Lubricants Market Revenue million Forecast, by End User 2020 & 2033
- Table 18: Global East Africa Lubricants Market Revenue million Forecast, by Product Type 2020 & 2033
- Table 19: Global East Africa Lubricants Market Revenue million Forecast, by Geography 2020 & 2033
- Table 20: Global East Africa Lubricants Market Revenue million Forecast, by Country 2020 & 2033
- Table 21: Global East Africa Lubricants Market Revenue million Forecast, by End User 2020 & 2033
- Table 22: Global East Africa Lubricants Market Revenue million Forecast, by Product Type 2020 & 2033
- Table 23: Global East Africa Lubricants Market Revenue million Forecast, by Geography 2020 & 2033
- Table 24: Global East Africa Lubricants Market Revenue million Forecast, by Country 2020 & 2033
- Table 25: Global East Africa Lubricants Market Revenue million Forecast, by End User 2020 & 2033
- Table 26: Global East Africa Lubricants Market Revenue million Forecast, by Product Type 2020 & 2033
- Table 27: Global East Africa Lubricants Market Revenue million Forecast, by Geography 2020 & 2033
- Table 28: Global East Africa Lubricants Market Revenue million Forecast, by Country 2020 & 2033
- Table 29: Global East Africa Lubricants Market Revenue million Forecast, by End User 2020 & 2033
- Table 30: Global East Africa Lubricants Market Revenue million Forecast, by Product Type 2020 & 2033
- Table 31: Global East Africa Lubricants Market Revenue million Forecast, by Geography 2020 & 2033
- Table 32: Global East Africa Lubricants Market Revenue million Forecast, by Country 2020 & 2033
Frequently Asked Questions
1. What is the projected Compound Annual Growth Rate (CAGR) of the East Africa Lubricants Market?
The projected CAGR is approximately 5%.
2. Which companies are prominent players in the East Africa Lubricants Market?
Key companies in the market include BP p l c, Chevron Corporation, China Petrochemical Corporation, Engen Petroleum Ltd, ENOC Company, Exxon Mobil Corporation, General Petroleum, Hass Petroleum, Lake Group, LIQUI MOLY GmbH, Mineral Oil Corporation Limited, Motul S A, National Oil Corporation of Kenya, Oryx Energies SA, Shell PLC, TotalEnergies*List Not Exhaustive.
3. What are the main segments of the East Africa Lubricants Market?
The market segments include End User, Product Type, Geography.
4. Can you provide details about the market size?
The market size is estimated to be USD 302.53 million as of 2022.
5. What are some drivers contributing to market growth?
Increasing Demand Due to Industrial and Economic Growth; Rising Penetration of Used Vehicles Increases the Lubricant Consumption; Other Drivers.
6. What are the notable trends driving market growth?
Increasing Demand from Automotive Sector.
7. Are there any restraints impacting market growth?
Increasing Demand Due to Industrial and Economic Growth; Rising Penetration of Used Vehicles Increases the Lubricant Consumption; Other Drivers.
8. Can you provide examples of recent developments in the market?
February 2023: Engen and Vivo Energy announced a combination of their respective African businesses. Moreover, PETRONAS was to sell its 74% shareholding in Engen to Vivo Energy at completion. This was to create one of Africa’s largest energy distribution companies.
9. What pricing options are available for accessing the report?
Pricing options include single-user, multi-user, and enterprise licenses priced at USD 4750, USD 5250, and USD 8750 respectively.
10. Is the market size provided in terms of value or volume?
The market size is provided in terms of value, measured in million.
11. Are there any specific market keywords associated with the report?
Yes, the market keyword associated with the report is "East Africa Lubricants Market," which aids in identifying and referencing the specific market segment covered.
12. How do I determine which pricing option suits my needs best?
The pricing options vary based on user requirements and access needs. Individual users may opt for single-user licenses, while businesses requiring broader access may choose multi-user or enterprise licenses for cost-effective access to the report.
13. Are there any additional resources or data provided in the East Africa Lubricants Market report?
While the report offers comprehensive insights, it's advisable to review the specific contents or supplementary materials provided to ascertain if additional resources or data are available.
14. How can I stay updated on further developments or reports in the East Africa Lubricants Market?
To stay informed about further developments, trends, and reports in the East Africa Lubricants Market, consider subscribing to industry newsletters, following relevant companies and organizations, or regularly checking reputable industry news sources and publications.
Methodology
Step 1 - Identification of Relevant Samples Size from Population Database


Step 2 - Approaches for Defining Global Market Size (Value, Volume* & Price*)

Note*: In applicable scenarios
Step 3 - Data Sources
Primary Research
- Web Analytics
- Survey Reports
- Research Institute
- Latest Research Reports
- Opinion Leaders
Secondary Research
- Annual Reports
- White Paper
- Latest Press Release
- Industry Association
- Paid Database
- Investor Presentations

Step 4 - Data Triangulation
Involves using different sources of information in order to increase the validity of a study
These sources are likely to be stakeholders in a program - participants, other researchers, program staff, other community members, and so on.
Then we put all data in single framework & apply various statistical tools to find out the dynamic on the market.
During the analysis stage, feedback from the stakeholder groups would be compared to determine areas of agreement as well as areas of divergence