

Key Insights
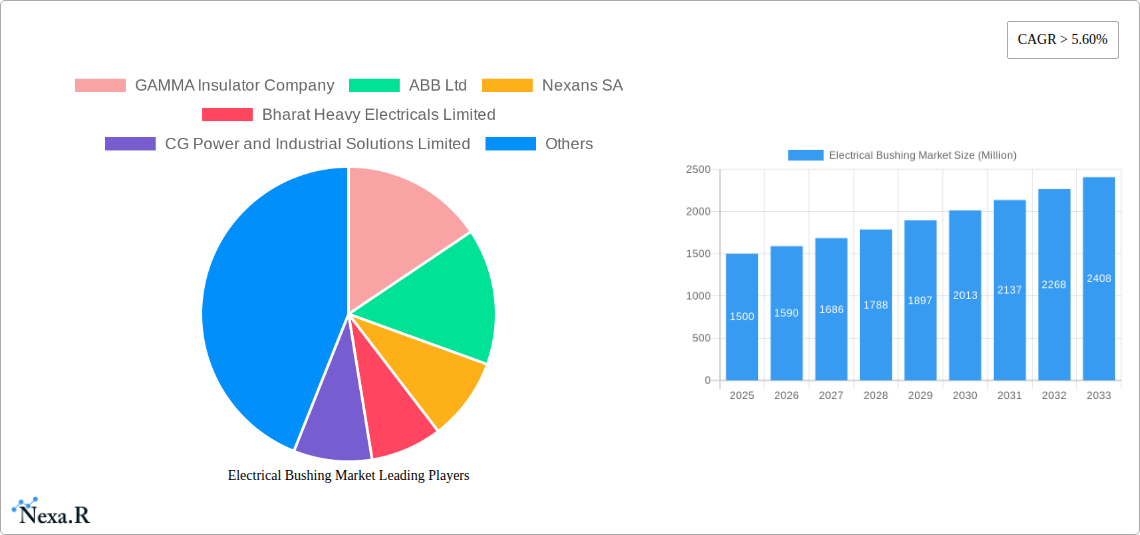
The global electrical bushing market is experiencing robust growth, projected to maintain a Compound Annual Growth Rate (CAGR) exceeding 5.60% from 2025 to 2033. This expansion is fueled by the increasing demand for electricity across various sectors, including power generation, transmission, and distribution. The rising adoption of renewable energy sources, coupled with the ongoing modernization and expansion of existing electrical grids, further contributes to market growth. Key drivers include stringent safety regulations, the need for improved insulation performance, and the growing emphasis on grid reliability. Market segmentation reveals significant demand for oil-impregnated paper bushings, owing to their established performance and cost-effectiveness in transformer applications. However, resin-impregnated paper bushings are gaining traction due to their superior dielectric strength and resistance to environmental factors. The market is geographically diverse, with North America and Europe representing significant revenue contributors. However, the Asia-Pacific region exhibits the highest growth potential, driven by rapid industrialization and urbanization in countries like China and India. Leading players like ABB, Siemens, Eaton, and Nexans are actively engaged in technological advancements, strategic partnerships, and capacity expansion to capitalize on this burgeoning market opportunity. The competitive landscape is characterized by a mix of established multinational corporations and regional players, leading to innovation and price competition. Challenges include the volatility of raw material prices and the need for continuous technological advancements to meet the evolving demands of the power industry.
The market's future trajectory is highly promising, driven by several emerging trends. The adoption of smart grid technologies and digitalization is expected to stimulate demand for advanced bushings with improved monitoring and diagnostic capabilities. Furthermore, the growing focus on sustainable manufacturing practices and the development of eco-friendly bushing materials are contributing to market expansion. However, potential restraints include the high initial investment costs associated with advanced bushing technologies and the potential impact of economic downturns on capital expenditures in the power sector. To overcome these challenges, manufacturers are focusing on developing cost-effective and efficient manufacturing processes while simultaneously enhancing the performance and reliability of their products. This strategic approach will be crucial in sustaining the market’s robust growth trajectory in the coming years.
Electrical Bushing Market: A Comprehensive Report (2019-2033)
This comprehensive report provides an in-depth analysis of the Electrical Bushing Market, encompassing market dynamics, growth trends, regional segmentation, product landscape, key players, and future outlook. The report covers the period from 2019 to 2033, with a base year of 2025 and a forecast period of 2025-2033. The parent market is the Power Transmission and Distribution Equipment Market, while the child market is specifically Electrical Insulation Components. The market size is projected to reach xx Million units by 2033.
Electrical Bushing Market Dynamics & Structure
The Electrical Bushing Market is characterized by moderate concentration, with several key players holding significant market share. Technological innovation, particularly in materials science and design optimization, is a crucial driver of market growth. Stringent safety and performance standards imposed by regulatory frameworks influence product development and adoption. Competitive pressure from substitute products, such as alternative insulation materials, necessitates continuous innovation. End-user demographics, primarily encompassing the power generation, transmission, and distribution sectors, shape demand patterns. Mergers and acquisitions (M&A) activity, though moderate, plays a role in consolidating market share and driving technological advancement.
- Market Concentration: Moderately concentrated, with top 5 players holding approximately xx% market share in 2025.
- Technological Innovation: Focus on improving dielectric strength, thermal stability, and miniaturization.
- Regulatory Frameworks: Compliance with IEC and other international standards is paramount.
- Competitive Substitutes: Growing competition from alternative insulation technologies, such as solid-state bushings.
- End-User Demographics: Primarily driven by the electricity generation and transmission industries.
- M&A Trends: xx M&A deals recorded between 2019 and 2024, indicating moderate consolidation.
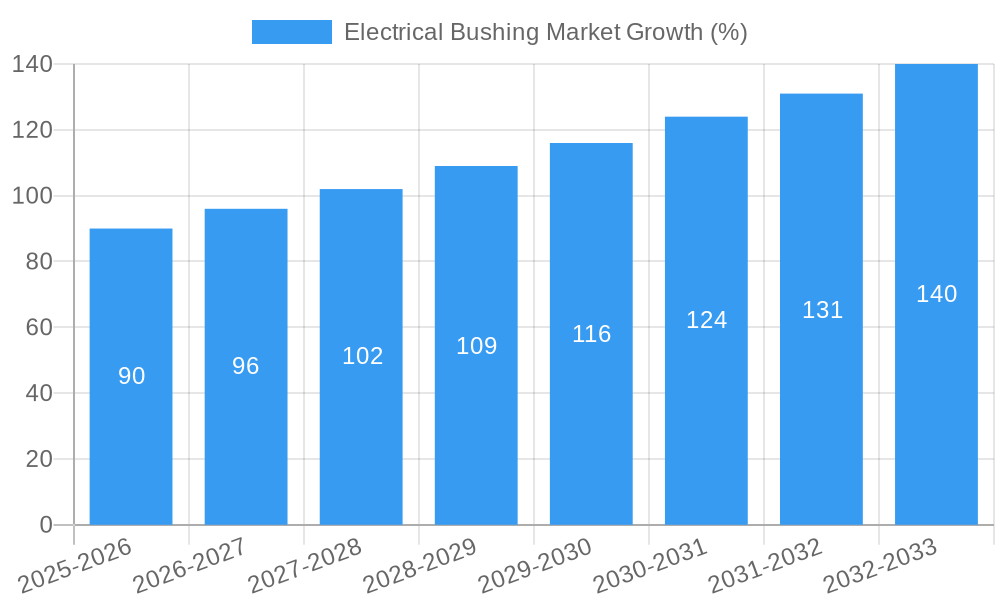
Electrical Bushing Market Growth Trends & Insights
The Electrical Bushing Market experienced steady growth during the historical period (2019-2024), driven by rising energy demand and infrastructure development globally. The market size is estimated to be xx Million units in 2025, with a projected Compound Annual Growth Rate (CAGR) of xx% during the forecast period (2025-2033). This growth is fueled by increasing investments in renewable energy sources, smart grids, and grid modernization projects worldwide. Technological disruptions, such as the adoption of advanced materials and digital monitoring systems, are transforming the market landscape. Consumer behavior is shifting towards energy-efficient and environmentally friendly solutions, influencing product development and demand. Market penetration in developing economies remains significant growth opportunity.
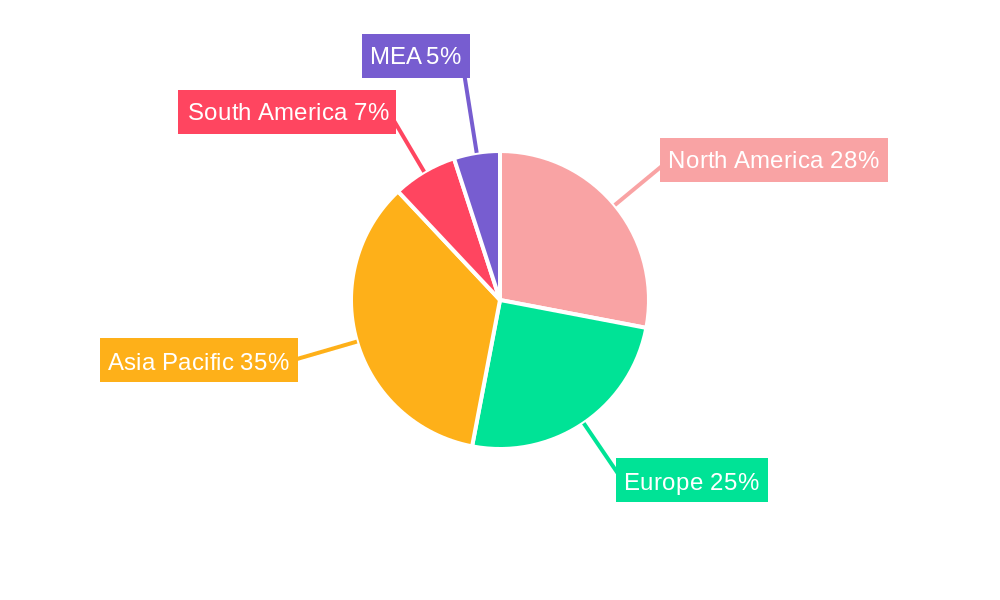
Dominant Regions, Countries, or Segments in Electrical Bushing Market
The North American and European regions currently dominate the Electrical Bushing Market, driven by robust power infrastructure and stringent regulatory standards. However, the Asia-Pacific region is projected to witness the fastest growth during the forecast period, fueled by rapid industrialization and urbanization. Within the product segments, Oil Impregnated Paper bushings hold the largest market share due to their established technology and cost-effectiveness. However, Resin Impregnated Paper bushings are gaining traction due to their superior performance characteristics. Transformer applications currently represent the largest segment, followed by switchgears.
- Leading Region: North America (xx% market share in 2025)
- Fastest-Growing Region: Asia-Pacific (xx% CAGR during 2025-2033)
- Dominant Type: Oil Impregnated Paper (xx% market share in 2025)
- Dominant Application: Transformers (xx% market share in 2025)
- Key Drivers (Asia-Pacific): Rapid economic growth, power infrastructure development, and government initiatives supporting renewable energy.
Electrical Bushing Market Product Landscape
Electrical bushings are constantly evolving, with innovations focused on enhancing dielectric strength, improving thermal performance, and reducing overall size. Advanced materials, such as nanomaterials and composite insulators, are being incorporated to improve reliability and longevity. New designs are aimed at optimizing electrical and mechanical performance under diverse operating conditions. Key selling propositions include enhanced safety, improved efficiency, and extended lifespan, leading to reduced maintenance costs.
Key Drivers, Barriers & Challenges in Electrical Bushing Market
Key Drivers:
- Increasing demand for electricity globally.
- Expansion of power grids and renewable energy infrastructure.
- Stringent safety regulations promoting higher-quality bushings.
Challenges & Restraints:
- Fluctuations in raw material prices.
- Complex supply chain dynamics impacting production and delivery.
- Intense competition among manufacturers.
Emerging Opportunities in Electrical Bushing Market
Emerging opportunities lie in the development of high-voltage, high-capacity bushings for smart grids and renewable energy projects. The integration of digital sensors and monitoring systems for predictive maintenance presents a significant growth avenue. Furthermore, untapped markets in developing economies and niche applications in specialized industries offer considerable potential.
Growth Accelerators in the Electrical Bushing Market Industry
Technological advancements in materials science and design are driving significant improvements in bushing performance. Strategic partnerships between manufacturers and power companies are facilitating innovation and market penetration. Government policies promoting renewable energy and grid modernization are further stimulating market growth. Expanding into new geographical markets and developing specialized bushings for niche applications also provide considerable growth opportunities.
Key Players Shaping the Electrical Bushing Market Market
- GAMMA Insulator Company
- ABB Ltd
- Nexans SA
- Bharat Heavy Electricals Limited
- CG Power and Industrial Solutions Limited
- Siemens AG
- Eaton Corporation PLC
- General Electric Company
Notable Milestones in Electrical Bushing Market Sector
- 2020: ABB Ltd launches a new range of environmentally friendly bushings.
- 2022: Nexans SA acquires a smaller bushing manufacturer, expanding its market share.
- 2023: Siemens AG introduces a digital monitoring system for electrical bushings.
In-Depth Electrical Bushing Market Market Outlook
The Electrical Bushing Market is poised for sustained growth, driven by ongoing investments in power infrastructure and the increasing adoption of renewable energy technologies. Strategic partnerships, technological innovations, and expansion into new markets present significant opportunities for existing and new market entrants. The focus on improving efficiency, reliability, and sustainability will shape the future of the industry.
Electrical Bushing Market Segmentation
-
1. Type
- 1.1. Oil Impregnated Paper
- 1.2. Resin Impregnated Paper
- 1.3. Other Types
-
2. Application
- 2.1. Transformers
- 2.2. Switchgears
- 2.3. Other Applications
Electrical Bushing Market Segmentation By Geography
- 1. North America
- 2. Europe
- 3. Asia Pacific
- 4. South America
- 5. Middle East and Africa
Electrical Bushing Market REPORT HIGHLIGHTS
| Aspects | Details |
|---|---|
| Study Period | 2019-2033 |
| Base Year | 2024 |
| Estimated Year | 2025 |
| Forecast Period | 2025-2033 |
| Historical Period | 2019-2024 |
| Growth Rate | CAGR of > 5.60% from 2019-2033 |
| Segmentation |
|
Table of Contents
- 1. Introduction
- 1.1. Research Scope
- 1.2. Market Segmentation
- 1.3. Research Methodology
- 1.4. Definitions and Assumptions
- 2. Executive Summary
- 2.1. Introduction
- 3. Market Dynamics
- 3.1. Introduction
- 3.2. Market Drivers
- 3.2.1. Replacement of Existing Grids and the Expansion of Distribution Networks
- 3.3. Market Restrains
- 3.3.1. High Installation Costs
- 3.4. Market Trends
- 3.4.1. Transformer Application to Dominate the Market
- 4. Market Factor Analysis
- 4.1. Porters Five Forces
- 4.2. Supply/Value Chain
- 4.3. PESTEL analysis
- 4.4. Market Entropy
- 4.5. Patent/Trademark Analysis
- 5. Global Electrical Bushing Market Analysis, Insights and Forecast, 2019-2031
- 5.1. Market Analysis, Insights and Forecast - by Type
- 5.1.1. Oil Impregnated Paper
- 5.1.2. Resin Impregnated Paper
- 5.1.3. Other Types
- 5.2. Market Analysis, Insights and Forecast - by Application
- 5.2.1. Transformers
- 5.2.2. Switchgears
- 5.2.3. Other Applications
- 5.3. Market Analysis, Insights and Forecast - by Region
- 5.3.1. North America
- 5.3.2. Europe
- 5.3.3. Asia Pacific
- 5.3.4. South America
- 5.3.5. Middle East and Africa
- 5.1. Market Analysis, Insights and Forecast - by Type
- 6. North America Electrical Bushing Market Analysis, Insights and Forecast, 2019-2031
- 6.1. Market Analysis, Insights and Forecast - by Type
- 6.1.1. Oil Impregnated Paper
- 6.1.2. Resin Impregnated Paper
- 6.1.3. Other Types
- 6.2. Market Analysis, Insights and Forecast - by Application
- 6.2.1. Transformers
- 6.2.2. Switchgears
- 6.2.3. Other Applications
- 6.1. Market Analysis, Insights and Forecast - by Type
- 7. Europe Electrical Bushing Market Analysis, Insights and Forecast, 2019-2031
- 7.1. Market Analysis, Insights and Forecast - by Type
- 7.1.1. Oil Impregnated Paper
- 7.1.2. Resin Impregnated Paper
- 7.1.3. Other Types
- 7.2. Market Analysis, Insights and Forecast - by Application
- 7.2.1. Transformers
- 7.2.2. Switchgears
- 7.2.3. Other Applications
- 7.1. Market Analysis, Insights and Forecast - by Type
- 8. Asia Pacific Electrical Bushing Market Analysis, Insights and Forecast, 2019-2031
- 8.1. Market Analysis, Insights and Forecast - by Type
- 8.1.1. Oil Impregnated Paper
- 8.1.2. Resin Impregnated Paper
- 8.1.3. Other Types
- 8.2. Market Analysis, Insights and Forecast - by Application
- 8.2.1. Transformers
- 8.2.2. Switchgears
- 8.2.3. Other Applications
- 8.1. Market Analysis, Insights and Forecast - by Type
- 9. South America Electrical Bushing Market Analysis, Insights and Forecast, 2019-2031
- 9.1. Market Analysis, Insights and Forecast - by Type
- 9.1.1. Oil Impregnated Paper
- 9.1.2. Resin Impregnated Paper
- 9.1.3. Other Types
- 9.2. Market Analysis, Insights and Forecast - by Application
- 9.2.1. Transformers
- 9.2.2. Switchgears
- 9.2.3. Other Applications
- 9.1. Market Analysis, Insights and Forecast - by Type
- 10. Middle East and Africa Electrical Bushing Market Analysis, Insights and Forecast, 2019-2031
- 10.1. Market Analysis, Insights and Forecast - by Type
- 10.1.1. Oil Impregnated Paper
- 10.1.2. Resin Impregnated Paper
- 10.1.3. Other Types
- 10.2. Market Analysis, Insights and Forecast - by Application
- 10.2.1. Transformers
- 10.2.2. Switchgears
- 10.2.3. Other Applications
- 10.1. Market Analysis, Insights and Forecast - by Type
- 11. North America Electrical Bushing Market Analysis, Insights and Forecast, 2019-2031
- 11.1. Market Analysis, Insights and Forecast - By Country/Sub-region
- 11.1.1 United States
- 11.1.2 Canada
- 11.1.3 Mexico
- 12. Europe Electrical Bushing Market Analysis, Insights and Forecast, 2019-2031
- 12.1. Market Analysis, Insights and Forecast - By Country/Sub-region
- 12.1.1 Germany
- 12.1.2 United Kingdom
- 12.1.3 France
- 12.1.4 Spain
- 12.1.5 Italy
- 12.1.6 Spain
- 12.1.7 Belgium
- 12.1.8 Netherland
- 12.1.9 Nordics
- 12.1.10 Rest of Europe
- 13. Asia Pacific Electrical Bushing Market Analysis, Insights and Forecast, 2019-2031
- 13.1. Market Analysis, Insights and Forecast - By Country/Sub-region
- 13.1.1 China
- 13.1.2 Japan
- 13.1.3 India
- 13.1.4 South Korea
- 13.1.5 Southeast Asia
- 13.1.6 Australia
- 13.1.7 Indonesia
- 13.1.8 Phillipes
- 13.1.9 Singapore
- 13.1.10 Thailandc
- 13.1.11 Rest of Asia Pacific
- 14. South America Electrical Bushing Market Analysis, Insights and Forecast, 2019-2031
- 14.1. Market Analysis, Insights and Forecast - By Country/Sub-region
- 14.1.1 Brazil
- 14.1.2 Argentina
- 14.1.3 Peru
- 14.1.4 Chile
- 14.1.5 Colombia
- 14.1.6 Ecuador
- 14.1.7 Venezuela
- 14.1.8 Rest of South America
- 15. MEA Electrical Bushing Market Analysis, Insights and Forecast, 2019-2031
- 15.1. Market Analysis, Insights and Forecast - By Country/Sub-region
- 15.1.1 United Arab Emirates
- 15.1.2 Saudi Arabia
- 15.1.3 South Africa
- 15.1.4 Rest of Middle East and Africa
- 16. Competitive Analysis
- 16.1. Global Market Share Analysis 2024
- 16.2. Company Profiles
- 16.2.1 GAMMA Insulator Company
- 16.2.1.1. Overview
- 16.2.1.2. Products
- 16.2.1.3. SWOT Analysis
- 16.2.1.4. Recent Developments
- 16.2.1.5. Financials (Based on Availability)
- 16.2.2 ABB Ltd
- 16.2.2.1. Overview
- 16.2.2.2. Products
- 16.2.2.3. SWOT Analysis
- 16.2.2.4. Recent Developments
- 16.2.2.5. Financials (Based on Availability)
- 16.2.3 Nexans SA
- 16.2.3.1. Overview
- 16.2.3.2. Products
- 16.2.3.3. SWOT Analysis
- 16.2.3.4. Recent Developments
- 16.2.3.5. Financials (Based on Availability)
- 16.2.4 Bharat Heavy Electricals Limited
- 16.2.4.1. Overview
- 16.2.4.2. Products
- 16.2.4.3. SWOT Analysis
- 16.2.4.4. Recent Developments
- 16.2.4.5. Financials (Based on Availability)
- 16.2.5 CG Power and Industrial Solutions Limited
- 16.2.5.1. Overview
- 16.2.5.2. Products
- 16.2.5.3. SWOT Analysis
- 16.2.5.4. Recent Developments
- 16.2.5.5. Financials (Based on Availability)
- 16.2.6 Siemens AG
- 16.2.6.1. Overview
- 16.2.6.2. Products
- 16.2.6.3. SWOT Analysis
- 16.2.6.4. Recent Developments
- 16.2.6.5. Financials (Based on Availability)
- 16.2.7 Eaton Corporation PLC
- 16.2.7.1. Overview
- 16.2.7.2. Products
- 16.2.7.3. SWOT Analysis
- 16.2.7.4. Recent Developments
- 16.2.7.5. Financials (Based on Availability)
- 16.2.8 Nexans SA*List Not Exhaustive
- 16.2.8.1. Overview
- 16.2.8.2. Products
- 16.2.8.3. SWOT Analysis
- 16.2.8.4. Recent Developments
- 16.2.8.5. Financials (Based on Availability)
- 16.2.9 General Electric Company
- 16.2.9.1. Overview
- 16.2.9.2. Products
- 16.2.9.3. SWOT Analysis
- 16.2.9.4. Recent Developments
- 16.2.9.5. Financials (Based on Availability)
- 16.2.1 GAMMA Insulator Company
List of Figures
- Figure 1: Global Electrical Bushing Market Revenue Breakdown (Million, %) by Region 2024 & 2032
- Figure 2: Global Electrical Bushing Market Volume Breakdown (K Unit, %) by Region 2024 & 2032
- Figure 3: North America Electrical Bushing Market Revenue (Million), by Country 2024 & 2032
- Figure 4: North America Electrical Bushing Market Volume (K Unit), by Country 2024 & 2032
- Figure 5: North America Electrical Bushing Market Revenue Share (%), by Country 2024 & 2032
- Figure 6: North America Electrical Bushing Market Volume Share (%), by Country 2024 & 2032
- Figure 7: Europe Electrical Bushing Market Revenue (Million), by Country 2024 & 2032
- Figure 8: Europe Electrical Bushing Market Volume (K Unit), by Country 2024 & 2032
- Figure 9: Europe Electrical Bushing Market Revenue Share (%), by Country 2024 & 2032
- Figure 10: Europe Electrical Bushing Market Volume Share (%), by Country 2024 & 2032
- Figure 11: Asia Pacific Electrical Bushing Market Revenue (Million), by Country 2024 & 2032
- Figure 12: Asia Pacific Electrical Bushing Market Volume (K Unit), by Country 2024 & 2032
- Figure 13: Asia Pacific Electrical Bushing Market Revenue Share (%), by Country 2024 & 2032
- Figure 14: Asia Pacific Electrical Bushing Market Volume Share (%), by Country 2024 & 2032
- Figure 15: South America Electrical Bushing Market Revenue (Million), by Country 2024 & 2032
- Figure 16: South America Electrical Bushing Market Volume (K Unit), by Country 2024 & 2032
- Figure 17: South America Electrical Bushing Market Revenue Share (%), by Country 2024 & 2032
- Figure 18: South America Electrical Bushing Market Volume Share (%), by Country 2024 & 2032
- Figure 19: MEA Electrical Bushing Market Revenue (Million), by Country 2024 & 2032
- Figure 20: MEA Electrical Bushing Market Volume (K Unit), by Country 2024 & 2032
- Figure 21: MEA Electrical Bushing Market Revenue Share (%), by Country 2024 & 2032
- Figure 22: MEA Electrical Bushing Market Volume Share (%), by Country 2024 & 2032
- Figure 23: North America Electrical Bushing Market Revenue (Million), by Type 2024 & 2032
- Figure 24: North America Electrical Bushing Market Volume (K Unit), by Type 2024 & 2032
- Figure 25: North America Electrical Bushing Market Revenue Share (%), by Type 2024 & 2032
- Figure 26: North America Electrical Bushing Market Volume Share (%), by Type 2024 & 2032
- Figure 27: North America Electrical Bushing Market Revenue (Million), by Application 2024 & 2032
- Figure 28: North America Electrical Bushing Market Volume (K Unit), by Application 2024 & 2032
- Figure 29: North America Electrical Bushing Market Revenue Share (%), by Application 2024 & 2032
- Figure 30: North America Electrical Bushing Market Volume Share (%), by Application 2024 & 2032
- Figure 31: North America Electrical Bushing Market Revenue (Million), by Country 2024 & 2032
- Figure 32: North America Electrical Bushing Market Volume (K Unit), by Country 2024 & 2032
- Figure 33: North America Electrical Bushing Market Revenue Share (%), by Country 2024 & 2032
- Figure 34: North America Electrical Bushing Market Volume Share (%), by Country 2024 & 2032
- Figure 35: Europe Electrical Bushing Market Revenue (Million), by Type 2024 & 2032
- Figure 36: Europe Electrical Bushing Market Volume (K Unit), by Type 2024 & 2032
- Figure 37: Europe Electrical Bushing Market Revenue Share (%), by Type 2024 & 2032
- Figure 38: Europe Electrical Bushing Market Volume Share (%), by Type 2024 & 2032
- Figure 39: Europe Electrical Bushing Market Revenue (Million), by Application 2024 & 2032
- Figure 40: Europe Electrical Bushing Market Volume (K Unit), by Application 2024 & 2032
- Figure 41: Europe Electrical Bushing Market Revenue Share (%), by Application 2024 & 2032
- Figure 42: Europe Electrical Bushing Market Volume Share (%), by Application 2024 & 2032
- Figure 43: Europe Electrical Bushing Market Revenue (Million), by Country 2024 & 2032
- Figure 44: Europe Electrical Bushing Market Volume (K Unit), by Country 2024 & 2032
- Figure 45: Europe Electrical Bushing Market Revenue Share (%), by Country 2024 & 2032
- Figure 46: Europe Electrical Bushing Market Volume Share (%), by Country 2024 & 2032
- Figure 47: Asia Pacific Electrical Bushing Market Revenue (Million), by Type 2024 & 2032
- Figure 48: Asia Pacific Electrical Bushing Market Volume (K Unit), by Type 2024 & 2032
- Figure 49: Asia Pacific Electrical Bushing Market Revenue Share (%), by Type 2024 & 2032
- Figure 50: Asia Pacific Electrical Bushing Market Volume Share (%), by Type 2024 & 2032
- Figure 51: Asia Pacific Electrical Bushing Market Revenue (Million), by Application 2024 & 2032
- Figure 52: Asia Pacific Electrical Bushing Market Volume (K Unit), by Application 2024 & 2032
- Figure 53: Asia Pacific Electrical Bushing Market Revenue Share (%), by Application 2024 & 2032
- Figure 54: Asia Pacific Electrical Bushing Market Volume Share (%), by Application 2024 & 2032
- Figure 55: Asia Pacific Electrical Bushing Market Revenue (Million), by Country 2024 & 2032
- Figure 56: Asia Pacific Electrical Bushing Market Volume (K Unit), by Country 2024 & 2032
- Figure 57: Asia Pacific Electrical Bushing Market Revenue Share (%), by Country 2024 & 2032
- Figure 58: Asia Pacific Electrical Bushing Market Volume Share (%), by Country 2024 & 2032
- Figure 59: South America Electrical Bushing Market Revenue (Million), by Type 2024 & 2032
- Figure 60: South America Electrical Bushing Market Volume (K Unit), by Type 2024 & 2032
- Figure 61: South America Electrical Bushing Market Revenue Share (%), by Type 2024 & 2032
- Figure 62: South America Electrical Bushing Market Volume Share (%), by Type 2024 & 2032
- Figure 63: South America Electrical Bushing Market Revenue (Million), by Application 2024 & 2032
- Figure 64: South America Electrical Bushing Market Volume (K Unit), by Application 2024 & 2032
- Figure 65: South America Electrical Bushing Market Revenue Share (%), by Application 2024 & 2032
- Figure 66: South America Electrical Bushing Market Volume Share (%), by Application 2024 & 2032
- Figure 67: South America Electrical Bushing Market Revenue (Million), by Country 2024 & 2032
- Figure 68: South America Electrical Bushing Market Volume (K Unit), by Country 2024 & 2032
- Figure 69: South America Electrical Bushing Market Revenue Share (%), by Country 2024 & 2032
- Figure 70: South America Electrical Bushing Market Volume Share (%), by Country 2024 & 2032
- Figure 71: Middle East and Africa Electrical Bushing Market Revenue (Million), by Type 2024 & 2032
- Figure 72: Middle East and Africa Electrical Bushing Market Volume (K Unit), by Type 2024 & 2032
- Figure 73: Middle East and Africa Electrical Bushing Market Revenue Share (%), by Type 2024 & 2032
- Figure 74: Middle East and Africa Electrical Bushing Market Volume Share (%), by Type 2024 & 2032
- Figure 75: Middle East and Africa Electrical Bushing Market Revenue (Million), by Application 2024 & 2032
- Figure 76: Middle East and Africa Electrical Bushing Market Volume (K Unit), by Application 2024 & 2032
- Figure 77: Middle East and Africa Electrical Bushing Market Revenue Share (%), by Application 2024 & 2032
- Figure 78: Middle East and Africa Electrical Bushing Market Volume Share (%), by Application 2024 & 2032
- Figure 79: Middle East and Africa Electrical Bushing Market Revenue (Million), by Country 2024 & 2032
- Figure 80: Middle East and Africa Electrical Bushing Market Volume (K Unit), by Country 2024 & 2032
- Figure 81: Middle East and Africa Electrical Bushing Market Revenue Share (%), by Country 2024 & 2032
- Figure 82: Middle East and Africa Electrical Bushing Market Volume Share (%), by Country 2024 & 2032
List of Tables
- Table 1: Global Electrical Bushing Market Revenue Million Forecast, by Region 2019 & 2032
- Table 2: Global Electrical Bushing Market Volume K Unit Forecast, by Region 2019 & 2032
- Table 3: Global Electrical Bushing Market Revenue Million Forecast, by Type 2019 & 2032
- Table 4: Global Electrical Bushing Market Volume K Unit Forecast, by Type 2019 & 2032
- Table 5: Global Electrical Bushing Market Revenue Million Forecast, by Application 2019 & 2032
- Table 6: Global Electrical Bushing Market Volume K Unit Forecast, by Application 2019 & 2032
- Table 7: Global Electrical Bushing Market Revenue Million Forecast, by Region 2019 & 2032
- Table 8: Global Electrical Bushing Market Volume K Unit Forecast, by Region 2019 & 2032
- Table 9: Global Electrical Bushing Market Revenue Million Forecast, by Country 2019 & 2032
- Table 10: Global Electrical Bushing Market Volume K Unit Forecast, by Country 2019 & 2032
- Table 11: United States Electrical Bushing Market Revenue (Million) Forecast, by Application 2019 & 2032
- Table 12: United States Electrical Bushing Market Volume (K Unit) Forecast, by Application 2019 & 2032
- Table 13: Canada Electrical Bushing Market Revenue (Million) Forecast, by Application 2019 & 2032
- Table 14: Canada Electrical Bushing Market Volume (K Unit) Forecast, by Application 2019 & 2032
- Table 15: Mexico Electrical Bushing Market Revenue (Million) Forecast, by Application 2019 & 2032
- Table 16: Mexico Electrical Bushing Market Volume (K Unit) Forecast, by Application 2019 & 2032
- Table 17: Global Electrical Bushing Market Revenue Million Forecast, by Country 2019 & 2032
- Table 18: Global Electrical Bushing Market Volume K Unit Forecast, by Country 2019 & 2032
- Table 19: Germany Electrical Bushing Market Revenue (Million) Forecast, by Application 2019 & 2032
- Table 20: Germany Electrical Bushing Market Volume (K Unit) Forecast, by Application 2019 & 2032
- Table 21: United Kingdom Electrical Bushing Market Revenue (Million) Forecast, by Application 2019 & 2032
- Table 22: United Kingdom Electrical Bushing Market Volume (K Unit) Forecast, by Application 2019 & 2032
- Table 23: France Electrical Bushing Market Revenue (Million) Forecast, by Application 2019 & 2032
- Table 24: France Electrical Bushing Market Volume (K Unit) Forecast, by Application 2019 & 2032
- Table 25: Spain Electrical Bushing Market Revenue (Million) Forecast, by Application 2019 & 2032
- Table 26: Spain Electrical Bushing Market Volume (K Unit) Forecast, by Application 2019 & 2032
- Table 27: Italy Electrical Bushing Market Revenue (Million) Forecast, by Application 2019 & 2032
- Table 28: Italy Electrical Bushing Market Volume (K Unit) Forecast, by Application 2019 & 2032
- Table 29: Spain Electrical Bushing Market Revenue (Million) Forecast, by Application 2019 & 2032
- Table 30: Spain Electrical Bushing Market Volume (K Unit) Forecast, by Application 2019 & 2032
- Table 31: Belgium Electrical Bushing Market Revenue (Million) Forecast, by Application 2019 & 2032
- Table 32: Belgium Electrical Bushing Market Volume (K Unit) Forecast, by Application 2019 & 2032
- Table 33: Netherland Electrical Bushing Market Revenue (Million) Forecast, by Application 2019 & 2032
- Table 34: Netherland Electrical Bushing Market Volume (K Unit) Forecast, by Application 2019 & 2032
- Table 35: Nordics Electrical Bushing Market Revenue (Million) Forecast, by Application 2019 & 2032
- Table 36: Nordics Electrical Bushing Market Volume (K Unit) Forecast, by Application 2019 & 2032
- Table 37: Rest of Europe Electrical Bushing Market Revenue (Million) Forecast, by Application 2019 & 2032
- Table 38: Rest of Europe Electrical Bushing Market Volume (K Unit) Forecast, by Application 2019 & 2032
- Table 39: Global Electrical Bushing Market Revenue Million Forecast, by Country 2019 & 2032
- Table 40: Global Electrical Bushing Market Volume K Unit Forecast, by Country 2019 & 2032
- Table 41: China Electrical Bushing Market Revenue (Million) Forecast, by Application 2019 & 2032
- Table 42: China Electrical Bushing Market Volume (K Unit) Forecast, by Application 2019 & 2032
- Table 43: Japan Electrical Bushing Market Revenue (Million) Forecast, by Application 2019 & 2032
- Table 44: Japan Electrical Bushing Market Volume (K Unit) Forecast, by Application 2019 & 2032
- Table 45: India Electrical Bushing Market Revenue (Million) Forecast, by Application 2019 & 2032
- Table 46: India Electrical Bushing Market Volume (K Unit) Forecast, by Application 2019 & 2032
- Table 47: South Korea Electrical Bushing Market Revenue (Million) Forecast, by Application 2019 & 2032
- Table 48: South Korea Electrical Bushing Market Volume (K Unit) Forecast, by Application 2019 & 2032
- Table 49: Southeast Asia Electrical Bushing Market Revenue (Million) Forecast, by Application 2019 & 2032
- Table 50: Southeast Asia Electrical Bushing Market Volume (K Unit) Forecast, by Application 2019 & 2032
- Table 51: Australia Electrical Bushing Market Revenue (Million) Forecast, by Application 2019 & 2032
- Table 52: Australia Electrical Bushing Market Volume (K Unit) Forecast, by Application 2019 & 2032
- Table 53: Indonesia Electrical Bushing Market Revenue (Million) Forecast, by Application 2019 & 2032
- Table 54: Indonesia Electrical Bushing Market Volume (K Unit) Forecast, by Application 2019 & 2032
- Table 55: Phillipes Electrical Bushing Market Revenue (Million) Forecast, by Application 2019 & 2032
- Table 56: Phillipes Electrical Bushing Market Volume (K Unit) Forecast, by Application 2019 & 2032
- Table 57: Singapore Electrical Bushing Market Revenue (Million) Forecast, by Application 2019 & 2032
- Table 58: Singapore Electrical Bushing Market Volume (K Unit) Forecast, by Application 2019 & 2032
- Table 59: Thailandc Electrical Bushing Market Revenue (Million) Forecast, by Application 2019 & 2032
- Table 60: Thailandc Electrical Bushing Market Volume (K Unit) Forecast, by Application 2019 & 2032
- Table 61: Rest of Asia Pacific Electrical Bushing Market Revenue (Million) Forecast, by Application 2019 & 2032
- Table 62: Rest of Asia Pacific Electrical Bushing Market Volume (K Unit) Forecast, by Application 2019 & 2032
- Table 63: Global Electrical Bushing Market Revenue Million Forecast, by Country 2019 & 2032
- Table 64: Global Electrical Bushing Market Volume K Unit Forecast, by Country 2019 & 2032
- Table 65: Brazil Electrical Bushing Market Revenue (Million) Forecast, by Application 2019 & 2032
- Table 66: Brazil Electrical Bushing Market Volume (K Unit) Forecast, by Application 2019 & 2032
- Table 67: Argentina Electrical Bushing Market Revenue (Million) Forecast, by Application 2019 & 2032
- Table 68: Argentina Electrical Bushing Market Volume (K Unit) Forecast, by Application 2019 & 2032
- Table 69: Peru Electrical Bushing Market Revenue (Million) Forecast, by Application 2019 & 2032
- Table 70: Peru Electrical Bushing Market Volume (K Unit) Forecast, by Application 2019 & 2032
- Table 71: Chile Electrical Bushing Market Revenue (Million) Forecast, by Application 2019 & 2032
- Table 72: Chile Electrical Bushing Market Volume (K Unit) Forecast, by Application 2019 & 2032
- Table 73: Colombia Electrical Bushing Market Revenue (Million) Forecast, by Application 2019 & 2032
- Table 74: Colombia Electrical Bushing Market Volume (K Unit) Forecast, by Application 2019 & 2032
- Table 75: Ecuador Electrical Bushing Market Revenue (Million) Forecast, by Application 2019 & 2032
- Table 76: Ecuador Electrical Bushing Market Volume (K Unit) Forecast, by Application 2019 & 2032
- Table 77: Venezuela Electrical Bushing Market Revenue (Million) Forecast, by Application 2019 & 2032
- Table 78: Venezuela Electrical Bushing Market Volume (K Unit) Forecast, by Application 2019 & 2032
- Table 79: Rest of South America Electrical Bushing Market Revenue (Million) Forecast, by Application 2019 & 2032
- Table 80: Rest of South America Electrical Bushing Market Volume (K Unit) Forecast, by Application 2019 & 2032
- Table 81: Global Electrical Bushing Market Revenue Million Forecast, by Country 2019 & 2032
- Table 82: Global Electrical Bushing Market Volume K Unit Forecast, by Country 2019 & 2032
- Table 83: United Arab Emirates Electrical Bushing Market Revenue (Million) Forecast, by Application 2019 & 2032
- Table 84: United Arab Emirates Electrical Bushing Market Volume (K Unit) Forecast, by Application 2019 & 2032
- Table 85: Saudi Arabia Electrical Bushing Market Revenue (Million) Forecast, by Application 2019 & 2032
- Table 86: Saudi Arabia Electrical Bushing Market Volume (K Unit) Forecast, by Application 2019 & 2032
- Table 87: South Africa Electrical Bushing Market Revenue (Million) Forecast, by Application 2019 & 2032
- Table 88: South Africa Electrical Bushing Market Volume (K Unit) Forecast, by Application 2019 & 2032
- Table 89: Rest of Middle East and Africa Electrical Bushing Market Revenue (Million) Forecast, by Application 2019 & 2032
- Table 90: Rest of Middle East and Africa Electrical Bushing Market Volume (K Unit) Forecast, by Application 2019 & 2032
- Table 91: Global Electrical Bushing Market Revenue Million Forecast, by Type 2019 & 2032
- Table 92: Global Electrical Bushing Market Volume K Unit Forecast, by Type 2019 & 2032
- Table 93: Global Electrical Bushing Market Revenue Million Forecast, by Application 2019 & 2032
- Table 94: Global Electrical Bushing Market Volume K Unit Forecast, by Application 2019 & 2032
- Table 95: Global Electrical Bushing Market Revenue Million Forecast, by Country 2019 & 2032
- Table 96: Global Electrical Bushing Market Volume K Unit Forecast, by Country 2019 & 2032
- Table 97: Global Electrical Bushing Market Revenue Million Forecast, by Type 2019 & 2032
- Table 98: Global Electrical Bushing Market Volume K Unit Forecast, by Type 2019 & 2032
- Table 99: Global Electrical Bushing Market Revenue Million Forecast, by Application 2019 & 2032
- Table 100: Global Electrical Bushing Market Volume K Unit Forecast, by Application 2019 & 2032
- Table 101: Global Electrical Bushing Market Revenue Million Forecast, by Country 2019 & 2032
- Table 102: Global Electrical Bushing Market Volume K Unit Forecast, by Country 2019 & 2032
- Table 103: Global Electrical Bushing Market Revenue Million Forecast, by Type 2019 & 2032
- Table 104: Global Electrical Bushing Market Volume K Unit Forecast, by Type 2019 & 2032
- Table 105: Global Electrical Bushing Market Revenue Million Forecast, by Application 2019 & 2032
- Table 106: Global Electrical Bushing Market Volume K Unit Forecast, by Application 2019 & 2032
- Table 107: Global Electrical Bushing Market Revenue Million Forecast, by Country 2019 & 2032
- Table 108: Global Electrical Bushing Market Volume K Unit Forecast, by Country 2019 & 2032
- Table 109: Global Electrical Bushing Market Revenue Million Forecast, by Type 2019 & 2032
- Table 110: Global Electrical Bushing Market Volume K Unit Forecast, by Type 2019 & 2032
- Table 111: Global Electrical Bushing Market Revenue Million Forecast, by Application 2019 & 2032
- Table 112: Global Electrical Bushing Market Volume K Unit Forecast, by Application 2019 & 2032
- Table 113: Global Electrical Bushing Market Revenue Million Forecast, by Country 2019 & 2032
- Table 114: Global Electrical Bushing Market Volume K Unit Forecast, by Country 2019 & 2032
- Table 115: Global Electrical Bushing Market Revenue Million Forecast, by Type 2019 & 2032
- Table 116: Global Electrical Bushing Market Volume K Unit Forecast, by Type 2019 & 2032
- Table 117: Global Electrical Bushing Market Revenue Million Forecast, by Application 2019 & 2032
- Table 118: Global Electrical Bushing Market Volume K Unit Forecast, by Application 2019 & 2032
- Table 119: Global Electrical Bushing Market Revenue Million Forecast, by Country 2019 & 2032
- Table 120: Global Electrical Bushing Market Volume K Unit Forecast, by Country 2019 & 2032
Frequently Asked Questions
1. What is the projected Compound Annual Growth Rate (CAGR) of the Electrical Bushing Market?
The projected CAGR is approximately > 5.60%.
2. Which companies are prominent players in the Electrical Bushing Market?
Key companies in the market include GAMMA Insulator Company, ABB Ltd, Nexans SA, Bharat Heavy Electricals Limited, CG Power and Industrial Solutions Limited, Siemens AG, Eaton Corporation PLC, Nexans SA*List Not Exhaustive, General Electric Company.
3. What are the main segments of the Electrical Bushing Market?
The market segments include Type, Application.
4. Can you provide details about the market size?
The market size is estimated to be USD XX Million as of 2022.
5. What are some drivers contributing to market growth?
Replacement of Existing Grids and the Expansion of Distribution Networks.
6. What are the notable trends driving market growth?
Transformer Application to Dominate the Market.
7. Are there any restraints impacting market growth?
High Installation Costs.
8. Can you provide examples of recent developments in the market?
N/A
9. What pricing options are available for accessing the report?
Pricing options include single-user, multi-user, and enterprise licenses priced at USD 4750, USD 5250, and USD 8750 respectively.
10. Is the market size provided in terms of value or volume?
The market size is provided in terms of value, measured in Million and volume, measured in K Unit.
11. Are there any specific market keywords associated with the report?
Yes, the market keyword associated with the report is "Electrical Bushing Market," which aids in identifying and referencing the specific market segment covered.
12. How do I determine which pricing option suits my needs best?
The pricing options vary based on user requirements and access needs. Individual users may opt for single-user licenses, while businesses requiring broader access may choose multi-user or enterprise licenses for cost-effective access to the report.
13. Are there any additional resources or data provided in the Electrical Bushing Market report?
While the report offers comprehensive insights, it's advisable to review the specific contents or supplementary materials provided to ascertain if additional resources or data are available.
14. How can I stay updated on further developments or reports in the Electrical Bushing Market?
To stay informed about further developments, trends, and reports in the Electrical Bushing Market, consider subscribing to industry newsletters, following relevant companies and organizations, or regularly checking reputable industry news sources and publications.
Methodology
Step 1 - Identification of Relevant Samples Size from Population Database


Step 2 - Approaches for Defining Global Market Size (Value, Volume* & Price*)

Note*: In applicable scenarios
Step 3 - Data Sources
Primary Research
- Web Analytics
- Survey Reports
- Research Institute
- Latest Research Reports
- Opinion Leaders
Secondary Research
- Annual Reports
- White Paper
- Latest Press Release
- Industry Association
- Paid Database
- Investor Presentations

Step 4 - Data Triangulation
Involves using different sources of information in order to increase the validity of a study
These sources are likely to be stakeholders in a program - participants, other researchers, program staff, other community members, and so on.
Then we put all data in single framework & apply various statistical tools to find out the dynamic on the market.
During the analysis stage, feedback from the stakeholder groups would be compared to determine areas of agreement as well as areas of divergence
