

Key Insights
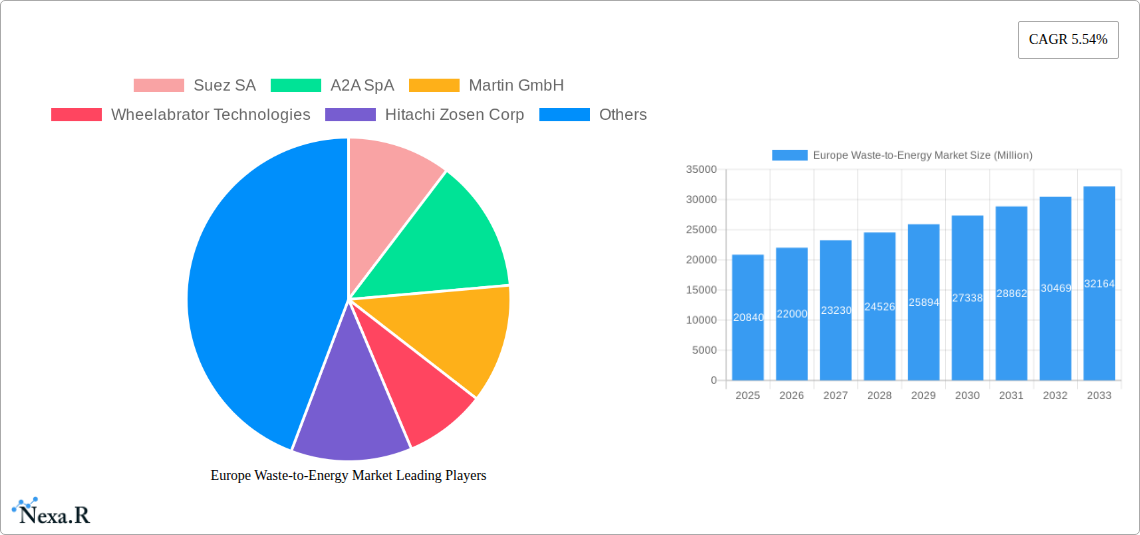
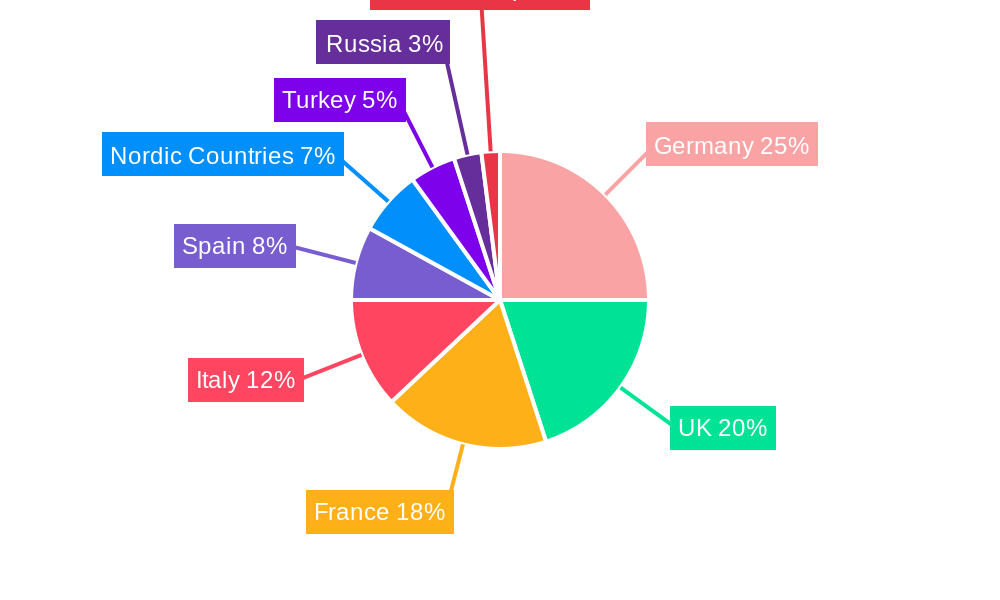
The European waste-to-energy market, valued at €20.84 billion in 2025, is projected to experience robust growth, driven by increasing environmental concerns, stringent waste management regulations, and the escalating need for renewable energy sources. The 5.54% CAGR indicates a significant expansion through 2033, fueled by technological advancements in waste processing and energy recovery, enabling higher efficiency and reduced environmental impact. Government initiatives promoting renewable energy and circular economy principles are further bolstering market growth. Key segments include physical and biological waste treatment methods, with significant regional variations across the major European economies: Germany, the UK, France, Italy, and Spain leading the market due to well-established infrastructure and policy support. While the Nordic countries and Turkey show promising growth potential, Eastern European nations like Russia may lag behind due to infrastructure limitations and varying regulatory frameworks. Competition among established players like Suez SA, Veolia Environnement SA, and Hitachi Zosen Corp is intense, stimulating innovation and driving down costs. However, potential restraints include the high initial investment costs for waste-to-energy plants, public perception concerns regarding emissions, and the need for consistent and reliable waste streams to optimize plant operations. Future growth will depend on overcoming these challenges through technological solutions and effective public engagement.
The forecast period from 2025 to 2033 presents significant opportunities for market expansion. Expanding populations and increasing urbanization across Europe will continue to increase waste generation, creating a demand for efficient and sustainable waste management solutions. The development of innovative technologies, such as advanced gasification and pyrolysis systems, will likely contribute to improving energy recovery efficiency and reducing greenhouse gas emissions. Moreover, policy changes favoring renewable energy production and the circular economy will likely further incentivize investment in waste-to-energy infrastructure across the European Union. However, potential risks include fluctuations in energy prices, technological disruptions, and the need for effective waste segregation and sorting to ensure optimal feedstock for waste-to-energy facilities. Companies must strategically adapt to these factors to leverage market opportunities and maintain a competitive advantage.
Europe Waste-to-Energy Market: A Comprehensive Report (2019-2033)
This in-depth report provides a comprehensive analysis of the Europe Waste-to-Energy market, covering market dynamics, growth trends, regional performance, and key players. With a focus on the parent market (Waste Management) and child market (Waste-to-Energy), this report is essential for industry professionals, investors, and strategic decision-makers seeking to navigate this dynamic sector. The study period spans from 2019 to 2033, with 2025 as the base and estimated year. The forecast period covers 2025-2033, and the historical period encompasses 2019-2024. Market values are presented in million units.
Europe Waste-to-Energy Market Dynamics & Structure
The European Waste-to-Energy (WtE) market is characterized by a moderately concentrated landscape, with key players such as Suez SA, A2A SpA, and Veolia Environnement SA holding significant market share (estimated at xx% combined in 2025). Technological innovation, driven by stricter environmental regulations and the need for sustainable waste management solutions, is a major driver. The market faces competitive pressure from alternative waste management methods, but stringent regulations are pushing increased adoption of WtE. The regulatory framework varies across European countries, impacting market growth and investment decisions. Mergers and acquisitions (M&A) activity is expected to increase as companies consolidate their market position and expand their geographical reach. The estimated number of M&A deals in the sector between 2019 and 2024 was xx.
- Market Concentration: Moderately concentrated, with top players holding xx% market share in 2025.
- Technological Innovation: Driven by stricter environmental regulations and sustainability goals.
- Regulatory Framework: Varies across countries, influencing market growth and investment.
- Competitive Substitutes: Landfill disposal and other waste treatment methods pose competition.
- M&A Activity: Expected to increase as companies consolidate and expand their presence.
- End-User Demographics: Primarily municipalities and industrial sectors.
Europe Waste-to-Energy Market Growth Trends & Insights
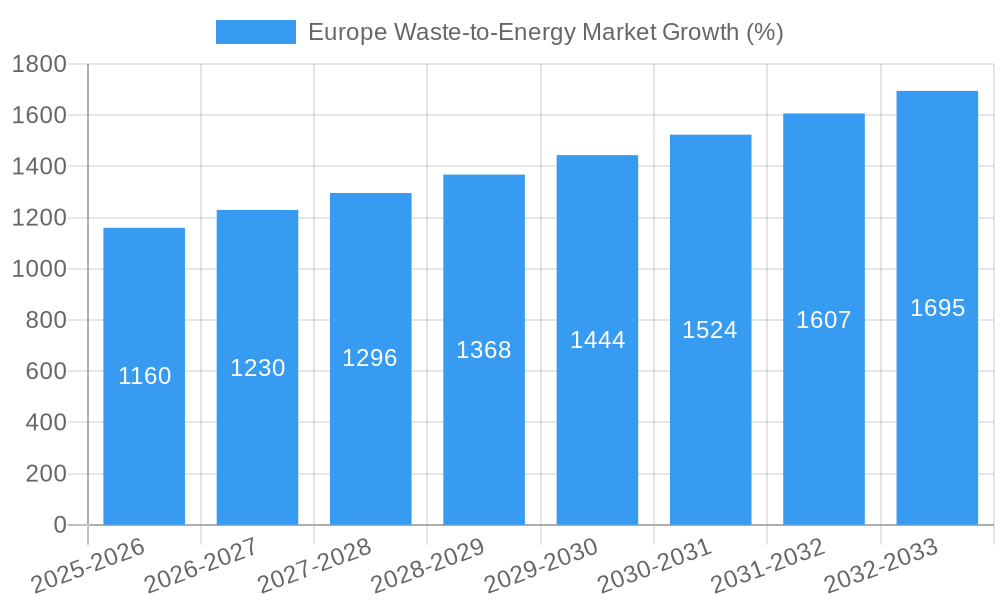
The European WtE market is experiencing robust growth, driven by increasing waste generation, stricter environmental regulations, and the growing need for sustainable waste management solutions. The market size, estimated at xx million in 2025, is projected to reach xx million by 2033, exhibiting a CAGR of xx% during the forecast period. Adoption rates are increasing across various sectors, including municipalities and industries. Technological disruptions, such as advancements in gasification and pyrolysis technologies, are improving efficiency and reducing environmental impact. Consumer behavior is shifting towards environmentally responsible waste disposal practices, boosting the demand for WtE solutions. Furthermore, the increasing focus on carbon neutrality further drives the adoption of WtE technologies.
Dominant Regions, Countries, or Segments in Europe Waste-to-Energy Market
Germany, the United Kingdom, and France are the leading markets within Europe, accounting for a combined xx% market share in 2025. The growth in these regions is driven by robust governmental support, established infrastructure, and a high concentration of waste generation. The physical source segment dominates the market, representing xx% of the total market share in 2025, given the higher volume of municipal solid waste (MSW) that lends itself to incineration compared to biological sources, which have more niche applications.
- Germany: Strong regulatory framework, advanced technology adoption, and high waste generation.
- United Kingdom: Increasing focus on waste reduction and resource efficiency, government incentives.
- France: Well-established WtE infrastructure and continuous government investments.
- Physical Source Segment: Dominant due to the larger volume of MSW suitable for incineration.
- Biological Source Segment: Niche applications, growth potential in specialized waste streams.
Europe Waste-to-Energy Market Product Landscape
The WtE market offers a range of technologies, including incineration, gasification, and anaerobic digestion, each with unique selling propositions based on efficiency, emissions reduction, and energy recovery potential. Recent advancements have focused on improving energy recovery efficiency, reducing greenhouse gas emissions, and recovering valuable materials from waste. These advancements are increasingly driving the adoption of WtE in the market.
Key Drivers, Barriers & Challenges in Europe Waste-to-Energy Market
Key Drivers: Stringent environmental regulations, increasing waste generation, and the need for renewable energy sources are driving market growth. Government incentives and subsidies also play a significant role, coupled with rising energy prices.
Key Challenges: High capital costs associated with WtE plant construction, public perception concerns regarding emissions and environmental impact, and potential supply chain disruptions due to resource scarcity or geopolitical instability present substantial hurdles. These challenges, coupled with permitting and regulatory complexities, contribute to slower adoption rates in some regions.
Emerging Opportunities in Europe Waste-to-Energy Market
The increasing focus on circular economy principles is creating opportunities for WtE plants to integrate with resource recovery technologies, extracting valuable materials from waste. Furthermore, advancements in carbon capture and utilization technologies are enabling WtE plants to capture CO2 emissions and transform them into valuable products, creating novel revenue streams. Untapped markets exist in Eastern European countries where waste management infrastructure is still developing.
Growth Accelerators in the Europe Waste-to-Energy Market Industry
Technological breakthroughs, such as advanced gasification and pyrolysis technologies, are improving the efficiency and environmental performance of WtE plants. Strategic partnerships between WtE operators, technology providers, and municipalities are streamlining project development and deployment. The expansion of WtE infrastructure in underserved regions will create significant growth opportunities in the coming years.
Key Players Shaping the Europe Waste-to-Energy Market Market
- Suez SA
- A2A SpA
- Martin GmbH
- Wheelabrator Technologies
- Hitachi Zosen Corp
- Veolia Environnement SA
- STEAG Energy Services GmbH
- Mitsubishi Heavy Industries Ltd
Notable Milestones in Europe Waste-to-Energy Market Sector
- September 2022: Fortum announced expansion of its UK operations and the development of a new WtE plant in Scotland, incorporating its Carbon2x concept for CO2 emissions capture and utilization.
- July 2022: The mayor of Rome announced the construction of an incinerator to handle unsorted waste, representing a significant market shift for waste management in the region.
In-Depth Europe Waste-to-Energy Market Market Outlook
The European WtE market is poised for sustained growth driven by increasing waste generation, stringent environmental regulations, and technological advancements. Strategic opportunities exist in expanding WtE infrastructure in underserved regions, integrating resource recovery technologies, and deploying carbon capture and utilization solutions. The long-term potential is significant, with opportunities for innovation, investment, and sustainable waste management across Europe.
Europe Waste-to-Energy Market Segmentation
- 1. Thermal
-
2. Source:
- 2.1. Physical
- 2.2. Biological
Europe Waste-to-Energy Market Segmentation By Geography
-
1. Europe
- 1.1. United Kingdom
- 1.2. Germany
- 1.3. France
- 1.4. Italy
- 1.5. Spain
- 1.6. Netherlands
- 1.7. Belgium
- 1.8. Sweden
- 1.9. Norway
- 1.10. Poland
- 1.11. Denmark
Europe Waste-to-Energy Market REPORT HIGHLIGHTS
| Aspects | Details |
|---|---|
| Study Period | 2019-2033 |
| Base Year | 2024 |
| Estimated Year | 2025 |
| Forecast Period | 2025-2033 |
| Historical Period | 2019-2024 |
| Growth Rate | CAGR of 5.54% from 2019-2033 |
| Segmentation |
|
Table of Contents
- 1. Introduction
- 1.1. Research Scope
- 1.2. Market Segmentation
- 1.3. Research Methodology
- 1.4. Definitions and Assumptions
- 2. Executive Summary
- 2.1. Introduction
- 3. Market Dynamics
- 3.1. Introduction
- 3.2. Market Drivers
- 3.2.1. 4.; Government Focus on Waste Management4.; Decline in Fossil-fuel based Electricity Generation
- 3.3. Market Restrains
- 3.3.1. 4.; High Price of Incinerators and Decline in Energy Price of Other Renewable Energy Sources
- 3.4. Market Trends
- 3.4.1. Thermal-based Waste-to-Energy Segment to Dominate the Market
- 4. Market Factor Analysis
- 4.1. Porters Five Forces
- 4.2. Supply/Value Chain
- 4.3. PESTEL analysis
- 4.4. Market Entropy
- 4.5. Patent/Trademark Analysis
- 5. Europe Waste-to-Energy Market Analysis, Insights and Forecast, 2019-2031
- 5.1. Market Analysis, Insights and Forecast - by Thermal
- 5.2. Market Analysis, Insights and Forecast - by Source:
- 5.2.1. Physical
- 5.2.2. Biological
- 5.3. Market Analysis, Insights and Forecast - by Region
- 5.3.1. Europe
- 5.1. Market Analysis, Insights and Forecast - by Thermal
- 6. Germany Europe Waste-to-Energy Market Analysis, Insights and Forecast, 2019-2031
- 7. France Europe Waste-to-Energy Market Analysis, Insights and Forecast, 2019-2031
- 8. Italy Europe Waste-to-Energy Market Analysis, Insights and Forecast, 2019-2031
- 9. United Kingdom Europe Waste-to-Energy Market Analysis, Insights and Forecast, 2019-2031
- 10. Netherlands Europe Waste-to-Energy Market Analysis, Insights and Forecast, 2019-2031
- 11. Sweden Europe Waste-to-Energy Market Analysis, Insights and Forecast, 2019-2031
- 12. Rest of Europe Europe Waste-to-Energy Market Analysis, Insights and Forecast, 2019-2031
- 13. Competitive Analysis
- 13.1. Market Share Analysis 2024
- 13.2. Company Profiles
- 13.2.1 Suez SA
- 13.2.1.1. Overview
- 13.2.1.2. Products
- 13.2.1.3. SWOT Analysis
- 13.2.1.4. Recent Developments
- 13.2.1.5. Financials (Based on Availability)
- 13.2.2 A2A SpA
- 13.2.2.1. Overview
- 13.2.2.2. Products
- 13.2.2.3. SWOT Analysis
- 13.2.2.4. Recent Developments
- 13.2.2.5. Financials (Based on Availability)
- 13.2.3 Martin GmbH
- 13.2.3.1. Overview
- 13.2.3.2. Products
- 13.2.3.3. SWOT Analysis
- 13.2.3.4. Recent Developments
- 13.2.3.5. Financials (Based on Availability)
- 13.2.4 Wheelabrator Technologies
- 13.2.4.1. Overview
- 13.2.4.2. Products
- 13.2.4.3. SWOT Analysis
- 13.2.4.4. Recent Developments
- 13.2.4.5. Financials (Based on Availability)
- 13.2.5 Hitachi Zosen Corp
- 13.2.5.1. Overview
- 13.2.5.2. Products
- 13.2.5.3. SWOT Analysis
- 13.2.5.4. Recent Developments
- 13.2.5.5. Financials (Based on Availability)
- 13.2.6 Veolia Environnement SA
- 13.2.6.1. Overview
- 13.2.6.2. Products
- 13.2.6.3. SWOT Analysis
- 13.2.6.4. Recent Developments
- 13.2.6.5. Financials (Based on Availability)
- 13.2.7 STEAG Energy Services GmbH
- 13.2.7.1. Overview
- 13.2.7.2. Products
- 13.2.7.3. SWOT Analysis
- 13.2.7.4. Recent Developments
- 13.2.7.5. Financials (Based on Availability)
- 13.2.8 Mitsubishi Heavy Industries Ltd
- 13.2.8.1. Overview
- 13.2.8.2. Products
- 13.2.8.3. SWOT Analysis
- 13.2.8.4. Recent Developments
- 13.2.8.5. Financials (Based on Availability)
- 13.2.1 Suez SA
List of Figures
- Figure 1: Europe Waste-to-Energy Market Revenue Breakdown (Million, %) by Product 2024 & 2032
- Figure 2: Europe Waste-to-Energy Market Share (%) by Company 2024
List of Tables
- Table 1: Europe Waste-to-Energy Market Revenue Million Forecast, by Region 2019 & 2032
- Table 2: Europe Waste-to-Energy Market Volume Gigawatt Forecast, by Region 2019 & 2032
- Table 3: Europe Waste-to-Energy Market Revenue Million Forecast, by Thermal 2019 & 2032
- Table 4: Europe Waste-to-Energy Market Volume Gigawatt Forecast, by Thermal 2019 & 2032
- Table 5: Europe Waste-to-Energy Market Revenue Million Forecast, by Source: 2019 & 2032
- Table 6: Europe Waste-to-Energy Market Volume Gigawatt Forecast, by Source: 2019 & 2032
- Table 7: Europe Waste-to-Energy Market Revenue Million Forecast, by Region 2019 & 2032
- Table 8: Europe Waste-to-Energy Market Volume Gigawatt Forecast, by Region 2019 & 2032
- Table 9: Europe Waste-to-Energy Market Revenue Million Forecast, by Country 2019 & 2032
- Table 10: Europe Waste-to-Energy Market Volume Gigawatt Forecast, by Country 2019 & 2032
- Table 11: Germany Europe Waste-to-Energy Market Revenue (Million) Forecast, by Application 2019 & 2032
- Table 12: Germany Europe Waste-to-Energy Market Volume (Gigawatt) Forecast, by Application 2019 & 2032
- Table 13: France Europe Waste-to-Energy Market Revenue (Million) Forecast, by Application 2019 & 2032
- Table 14: France Europe Waste-to-Energy Market Volume (Gigawatt) Forecast, by Application 2019 & 2032
- Table 15: Italy Europe Waste-to-Energy Market Revenue (Million) Forecast, by Application 2019 & 2032
- Table 16: Italy Europe Waste-to-Energy Market Volume (Gigawatt) Forecast, by Application 2019 & 2032
- Table 17: United Kingdom Europe Waste-to-Energy Market Revenue (Million) Forecast, by Application 2019 & 2032
- Table 18: United Kingdom Europe Waste-to-Energy Market Volume (Gigawatt) Forecast, by Application 2019 & 2032
- Table 19: Netherlands Europe Waste-to-Energy Market Revenue (Million) Forecast, by Application 2019 & 2032
- Table 20: Netherlands Europe Waste-to-Energy Market Volume (Gigawatt) Forecast, by Application 2019 & 2032
- Table 21: Sweden Europe Waste-to-Energy Market Revenue (Million) Forecast, by Application 2019 & 2032
- Table 22: Sweden Europe Waste-to-Energy Market Volume (Gigawatt) Forecast, by Application 2019 & 2032
- Table 23: Rest of Europe Europe Waste-to-Energy Market Revenue (Million) Forecast, by Application 2019 & 2032
- Table 24: Rest of Europe Europe Waste-to-Energy Market Volume (Gigawatt) Forecast, by Application 2019 & 2032
- Table 25: Europe Waste-to-Energy Market Revenue Million Forecast, by Thermal 2019 & 2032
- Table 26: Europe Waste-to-Energy Market Volume Gigawatt Forecast, by Thermal 2019 & 2032
- Table 27: Europe Waste-to-Energy Market Revenue Million Forecast, by Source: 2019 & 2032
- Table 28: Europe Waste-to-Energy Market Volume Gigawatt Forecast, by Source: 2019 & 2032
- Table 29: Europe Waste-to-Energy Market Revenue Million Forecast, by Country 2019 & 2032
- Table 30: Europe Waste-to-Energy Market Volume Gigawatt Forecast, by Country 2019 & 2032
- Table 31: United Kingdom Europe Waste-to-Energy Market Revenue (Million) Forecast, by Application 2019 & 2032
- Table 32: United Kingdom Europe Waste-to-Energy Market Volume (Gigawatt) Forecast, by Application 2019 & 2032
- Table 33: Germany Europe Waste-to-Energy Market Revenue (Million) Forecast, by Application 2019 & 2032
- Table 34: Germany Europe Waste-to-Energy Market Volume (Gigawatt) Forecast, by Application 2019 & 2032
- Table 35: France Europe Waste-to-Energy Market Revenue (Million) Forecast, by Application 2019 & 2032
- Table 36: France Europe Waste-to-Energy Market Volume (Gigawatt) Forecast, by Application 2019 & 2032
- Table 37: Italy Europe Waste-to-Energy Market Revenue (Million) Forecast, by Application 2019 & 2032
- Table 38: Italy Europe Waste-to-Energy Market Volume (Gigawatt) Forecast, by Application 2019 & 2032
- Table 39: Spain Europe Waste-to-Energy Market Revenue (Million) Forecast, by Application 2019 & 2032
- Table 40: Spain Europe Waste-to-Energy Market Volume (Gigawatt) Forecast, by Application 2019 & 2032
- Table 41: Netherlands Europe Waste-to-Energy Market Revenue (Million) Forecast, by Application 2019 & 2032
- Table 42: Netherlands Europe Waste-to-Energy Market Volume (Gigawatt) Forecast, by Application 2019 & 2032
- Table 43: Belgium Europe Waste-to-Energy Market Revenue (Million) Forecast, by Application 2019 & 2032
- Table 44: Belgium Europe Waste-to-Energy Market Volume (Gigawatt) Forecast, by Application 2019 & 2032
- Table 45: Sweden Europe Waste-to-Energy Market Revenue (Million) Forecast, by Application 2019 & 2032
- Table 46: Sweden Europe Waste-to-Energy Market Volume (Gigawatt) Forecast, by Application 2019 & 2032
- Table 47: Norway Europe Waste-to-Energy Market Revenue (Million) Forecast, by Application 2019 & 2032
- Table 48: Norway Europe Waste-to-Energy Market Volume (Gigawatt) Forecast, by Application 2019 & 2032
- Table 49: Poland Europe Waste-to-Energy Market Revenue (Million) Forecast, by Application 2019 & 2032
- Table 50: Poland Europe Waste-to-Energy Market Volume (Gigawatt) Forecast, by Application 2019 & 2032
- Table 51: Denmark Europe Waste-to-Energy Market Revenue (Million) Forecast, by Application 2019 & 2032
- Table 52: Denmark Europe Waste-to-Energy Market Volume (Gigawatt) Forecast, by Application 2019 & 2032
Frequently Asked Questions
1. What is the projected Compound Annual Growth Rate (CAGR) of the Europe Waste-to-Energy Market?
The projected CAGR is approximately 5.54%.
2. Which companies are prominent players in the Europe Waste-to-Energy Market?
Key companies in the market include Suez SA, A2A SpA, Martin GmbH, Wheelabrator Technologies, Hitachi Zosen Corp, Veolia Environnement SA, STEAG Energy Services GmbH, Mitsubishi Heavy Industries Ltd.
3. What are the main segments of the Europe Waste-to-Energy Market?
The market segments include Thermal, Source: .
4. Can you provide details about the market size?
The market size is estimated to be USD 20.84 Million as of 2022.
5. What are some drivers contributing to market growth?
4.; Government Focus on Waste Management4.; Decline in Fossil-fuel based Electricity Generation.
6. What are the notable trends driving market growth?
Thermal-based Waste-to-Energy Segment to Dominate the Market.
7. Are there any restraints impacting market growth?
4.; High Price of Incinerators and Decline in Energy Price of Other Renewable Energy Sources.
8. Can you provide examples of recent developments in the market?
September 2022: Fortum announced expanding its UK-based operations and is starting to develop a new WtE plant in Scotland. The market entry is a vital step forward in the company's ambition to transform the WtE sector with its novel Carbon2x concept, which already concluded the first round of pilot testing. The concept aimed to capture emissions from waste incineration and turn them into useful CO2-based, high-quality raw materials. Moreover, the Carbon2x will help reduce the dependence on fossil-based raw materials, improve Europe's self-sufficiency, and decarbonize waste incineration.
9. What pricing options are available for accessing the report?
Pricing options include single-user, multi-user, and enterprise licenses priced at USD 4750, USD 4950, and USD 6800 respectively.
10. Is the market size provided in terms of value or volume?
The market size is provided in terms of value, measured in Million and volume, measured in Gigawatt.
11. Are there any specific market keywords associated with the report?
Yes, the market keyword associated with the report is "Europe Waste-to-Energy Market," which aids in identifying and referencing the specific market segment covered.
12. How do I determine which pricing option suits my needs best?
The pricing options vary based on user requirements and access needs. Individual users may opt for single-user licenses, while businesses requiring broader access may choose multi-user or enterprise licenses for cost-effective access to the report.
13. Are there any additional resources or data provided in the Europe Waste-to-Energy Market report?
While the report offers comprehensive insights, it's advisable to review the specific contents or supplementary materials provided to ascertain if additional resources or data are available.
14. How can I stay updated on further developments or reports in the Europe Waste-to-Energy Market?
To stay informed about further developments, trends, and reports in the Europe Waste-to-Energy Market, consider subscribing to industry newsletters, following relevant companies and organizations, or regularly checking reputable industry news sources and publications.
Methodology
Step 1 - Identification of Relevant Samples Size from Population Database


Step 2 - Approaches for Defining Global Market Size (Value, Volume* & Price*)

Note*: In applicable scenarios
Step 3 - Data Sources
Primary Research
- Web Analytics
- Survey Reports
- Research Institute
- Latest Research Reports
- Opinion Leaders
Secondary Research
- Annual Reports
- White Paper
- Latest Press Release
- Industry Association
- Paid Database
- Investor Presentations

Step 4 - Data Triangulation
Involves using different sources of information in order to increase the validity of a study
These sources are likely to be stakeholders in a program - participants, other researchers, program staff, other community members, and so on.
Then we put all data in single framework & apply various statistical tools to find out the dynamic on the market.
During the analysis stage, feedback from the stakeholder groups would be compared to determine areas of agreement as well as areas of divergence
