

Key Insights
The global fluid loss additive market is poised for substantial expansion, projected to achieve a CAGR of 6.23% from a market size of 383.25 million in the base year of 2025, extending through 2033. This growth is primarily propelled by the escalating need for efficient drilling and cementing operations across the oil and gas and construction sectors. Increased global infrastructure development, particularly in emerging economies, is driving demand for high-performance additives that enhance fluid properties and mitigate fluid loss during these critical processes. The market is segmented by additive type, including synthetic, natural, and synthetically modified natural variants, and by application, encompassing drilling fluids and cement slurries. Synthetic additives currently lead the market due to their superior performance, while natural and synthetically modified natural segments are gaining traction, influenced by environmental consciousness and cost-effectiveness. Leading companies such as Clariant, Nouryon, and Solvay are spearheading innovation with advanced additives offering improved rheology control, filtration reduction, and temperature stability. The Asia-Pacific region, driven by significant infrastructure projects and exploration activities in China and India, represents a key growth engine. Challenges include fluctuating oil prices and stringent environmental regulations, while intense competition fuels strategic collaborations and product differentiation.
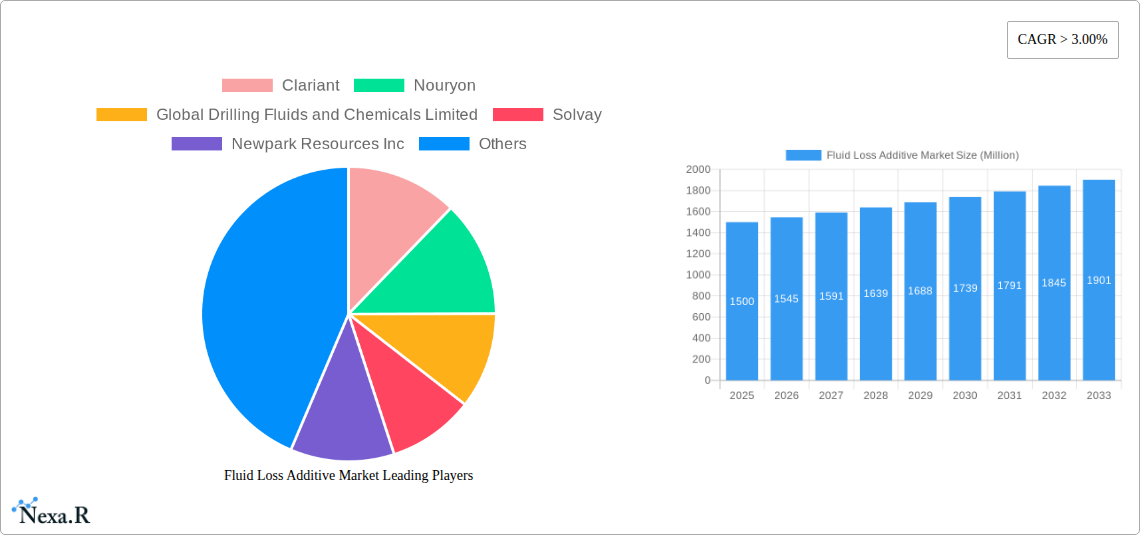
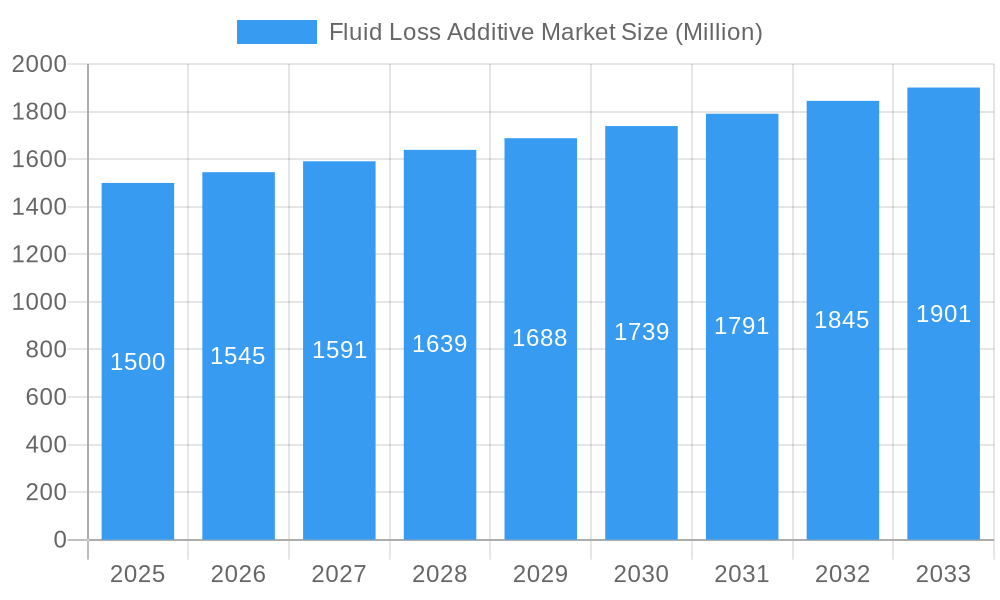
Fluid Loss Additive Market Market Size (In Million)
The forecast period (2025-2033) anticipates sustained market growth, with its pace influenced by global economic conditions and energy market dynamics. A heightened focus on sustainable solutions is expected to accelerate the adoption of eco-friendly fluid loss additives. Regional growth disparities are anticipated, with areas undergoing significant infrastructure development likely to experience accelerated expansion. The market's future trajectory will be shaped by technological advancements, regulatory landscapes, and the overall health of the oil and gas and construction industries. The development of innovative, high-functionality, and environmentally responsible additives will be paramount in defining the market's evolution. A granular analysis of specific additive sub-types within each category will further enhance market understanding.
Fluid Loss Additive Market Company Market Share
Fluid Loss Additive Market: A Comprehensive Report (2019-2033)
This comprehensive report provides an in-depth analysis of the Fluid Loss Additive market, encompassing market dynamics, growth trends, regional analysis, product landscape, and key player strategies. The study period covers 2019-2033, with 2025 as the base year and a forecast period of 2025-2033. The report segments the market by Additive Type (Synthetic, Natural, Synthetically Modified Natural) and Application (Drilling Fluid, Cement Slurry), providing granular insights into market size and growth across various segments. The total market size is projected to reach xx Million by 2033.
Fluid Loss Additive Market Market Dynamics & Structure
The Fluid Loss Additive market is characterized by moderate concentration, with several multinational corporations and specialized chemical companies dominating the landscape. Technological innovation, particularly in developing environmentally friendly and high-performance additives, is a key driver. Stringent environmental regulations regarding waste disposal and water usage are shaping product development and adoption. The market faces competitive pressure from substitute materials and emerging technologies. Mergers and acquisitions (M&A) activity has been relatively moderate, primarily focused on expanding product portfolios and geographical reach.
- Market Concentration: Moderately concentrated, with top 10 players holding approximately xx% market share in 2025.
- Technological Innovation: Focus on bio-based additives, enhanced performance characteristics (e.g., temperature resistance, shale compatibility), and reduced environmental impact.
- Regulatory Framework: Stringent environmental regulations influence product formulation and disposal methods, driving innovation in sustainable alternatives.
- Competitive Substitutes: Competition from alternative drilling fluids and cement additives with similar functionality.
- End-User Demographics: Primarily oil & gas exploration and production companies, construction companies, and related service providers.
- M&A Trends: Moderate M&A activity, primarily driven by strategic acquisitions to broaden product lines and expand market presence (xx deals recorded between 2019-2024).
Fluid Loss Additive Market Growth Trends & Insights
The Fluid Loss Additive market experienced steady growth during the historical period (2019-2024), driven by increased oil & gas exploration and construction activity. The market is projected to witness a CAGR of xx% during the forecast period (2025-2033), fueled by growing demand from emerging economies and ongoing infrastructure development projects. Technological advancements, particularly the adoption of environmentally friendly additives, are expected to further stimulate market growth. Adoption rates are increasing across various applications due to improved performance and regulatory compliance requirements. Consumer behavior is shifting towards sustainable and high-performance solutions, driving demand for advanced additives. Market penetration is expected to reach xx% by 2033, with a significant increase in the adoption of synthetic and synthetically modified natural additives.
Dominant Regions, Countries, or Segments in Fluid Loss Additive Market
North America currently holds the largest market share due to robust oil & gas exploration and significant infrastructure development. However, the Asia-Pacific region is anticipated to exhibit the highest growth rate during the forecast period, driven by rapid industrialization and increasing energy demand. Within additive types, the synthetic segment dominates due to its superior performance characteristics, whereas the drilling fluid application segment holds the largest share due to its higher consumption in the oil & gas sector.
- North America: High market share driven by strong oil & gas activity and established infrastructure.
- Asia-Pacific: Fastest-growing region driven by rapid industrialization and energy infrastructure development.
- Europe: Mature market with steady growth, driven by ongoing infrastructure projects and environmental regulations.
- Synthetic Additives: Dominates due to superior performance and versatility.
- Drilling Fluid Application: Holds the largest market share due to extensive use in the oil & gas industry.
Fluid Loss Additive Market Product Landscape
The fluid loss additive market offers a diverse range of products, tailored to specific applications and operational conditions. Innovations focus on enhancing performance characteristics like temperature resistance, filtration control, and environmental compatibility. Key advancements include the development of bio-based additives, reducing reliance on petroleum-derived materials. Unique selling propositions include improved rheological properties, reduced environmental impact, and cost-effectiveness.
Key Drivers, Barriers & Challenges in Fluid Loss Additive Market
Key Drivers:
- Increasing oil & gas exploration and production activities.
- Growing infrastructure development globally.
- Stringent environmental regulations promoting the use of eco-friendly additives.
- Technological advancements leading to the development of high-performance additives.
Key Challenges & Restraints:
- Fluctuations in oil & gas prices impacting investment decisions.
- Supply chain disruptions affecting raw material availability and pricing.
- Intense competition among existing players.
- Regulatory hurdles and compliance costs related to environmental regulations. (Estimated impact on market growth: xx%)
Emerging Opportunities in Fluid Loss Additive Market
- Growing demand for sustainable and environmentally friendly additives.
- Expansion into untapped markets in emerging economies.
- Development of innovative applications in specialized industries (e.g., geothermal energy).
- Focus on customized solutions to meet specific customer requirements.
Growth Accelerators in the Fluid Loss Additive Market Industry
Long-term growth is expected to be propelled by strategic partnerships between chemical companies and oil & gas operators, fostering innovation and market expansion. Technological breakthroughs in developing high-performance bio-based additives will further drive market growth. Increased investment in R&D and expansion into new geographical markets will also play a crucial role in market expansion.
Key Players Shaping the Fluid Loss Additive Market Market
- Clariant
- Nouryon
- Global Drilling Fluids and Chemicals Limited
- Solvay
- Newpark Resources Inc
- Kemira OYJ
- BASF SE
- Tytan Organics Pvt Ltd
- Halliburton
- Schlumberger Limited
Notable Milestones in Fluid Loss Additive Market Sector
- 2020: Clariant launched a new range of bio-based fluid loss additives.
- 2021: Nouryon acquired a smaller specialized additive manufacturer, expanding its product portfolio.
- 2022: New regulations on wastewater disposal impacted the market, driving innovation in eco-friendly additives.
- 2023: Several key players announced significant investments in R&D for sustainable fluid loss additives.
In-Depth Fluid Loss Additive Market Market Outlook
The Fluid Loss Additive market is poised for robust growth over the next decade, driven by several key factors. Continued infrastructure development, particularly in emerging economies, will fuel strong demand for these essential additives. Furthermore, the growing emphasis on environmental sustainability will drive innovation and adoption of eco-friendly solutions, creating significant opportunities for market participants. Strategic partnerships and investments in R&D will be crucial for companies seeking to capitalize on this future growth potential.
Fluid Loss Additive Market Segmentation
-
1. Additive Type
- 1.1. Synthetic
- 1.2. Natural
- 1.3. Synthetically Modified Natural
-
2. Application
- 2.1. Drilling Fluid
- 2.2. Cement Slurry
Fluid Loss Additive Market Segmentation By Geography
-
1. Asia Pacific
- 1.1. China
- 1.2. India
- 1.3. Japan
- 1.4. South Korea
- 1.5. Rest of Asia Pacific
-
2. North America
- 2.1. United States
- 2.2. Canada
- 2.3. Mexico
-
3. Europe
- 3.1. Germany
- 3.2. United Kingdom
- 3.3. France
- 3.4. Italy
- 3.5. Rest of Europe
-
4. South America
- 4.1. Brazil
- 4.2. Argentina
- 4.3. Rest of South America
-
5. Middle East and Africa
- 5.1. Saudi Arabia
- 5.2. South Africa
- 5.3. Rest of Middle East and Africa
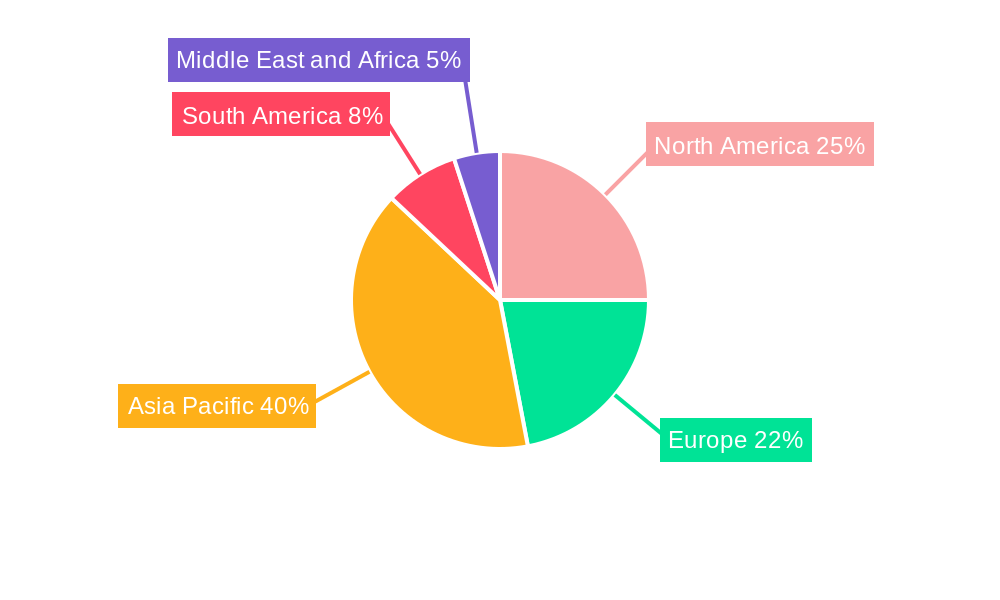
Fluid Loss Additive Market Regional Market Share
Geographic Coverage of Fluid Loss Additive Market
Fluid Loss Additive Market REPORT HIGHLIGHTS
| Aspects | Details |
|---|---|
| Study Period | 2020-2034 |
| Base Year | 2025 |
| Estimated Year | 2026 |
| Forecast Period | 2026-2034 |
| Historical Period | 2020-2025 |
| Growth Rate | CAGR of 6.23% from 2020-2034 |
| Segmentation |
|
Table of Contents
- 1. Introduction
- 1.1. Research Scope
- 1.2. Market Segmentation
- 1.3. Research Objective
- 1.4. Definitions and Assumptions
- 2. Executive Summary
- 2.1. Market Snapshot
- 3. Market Dynamics
- 3.1. Market Drivers
- 3.2. Market Restrains
- 3.3. Market Trends
- 3.4. Market Opportunities
- 4. Market Factor Analysis
- 4.1. Porters Five Forces
- 4.1.1. Bargaining Power of Suppliers
- 4.1.2. Bargaining Power of Buyers
- 4.1.3. Threat of New Entrants
- 4.1.4. Threat of Substitutes
- 4.1.5. Competitive Rivalry
- 4.2. PESTEL analysis
- 4.3. BCG Analysis
- 4.3.1. Stars (High Growth, High Market Share)
- 4.3.2. Cash Cows (Low Growth, High Market Share)
- 4.3.3. Question Mark (High Growth, Low Market Share)
- 4.3.4. Dogs (Low Growth, Low Market Share)
- 4.4. Ansoff Matrix Analysis
- 4.5. Supply Chain Analysis
- 4.6. Regulatory Landscape
- 4.7. Current Market Potential and Opportunity Assessment (TAM–SAM–SOM Framework)
- 4.8. NRP Analyst Note
- 4.1. Porters Five Forces
- 5. Market Analysis, Insights and Forecast 2021-2033
- 5.1. Market Analysis, Insights and Forecast - by Additive Type
- 5.1.1. Synthetic
- 5.1.2. Natural
- 5.1.3. Synthetically Modified Natural
- 5.2. Market Analysis, Insights and Forecast - by Application
- 5.2.1. Drilling Fluid
- 5.2.2. Cement Slurry
- 5.3. Market Analysis, Insights and Forecast - by Region
- 5.3.1. Asia Pacific
- 5.3.2. North America
- 5.3.3. Europe
- 5.3.4. South America
- 5.3.5. Middle East and Africa
- 5.1. Market Analysis, Insights and Forecast - by Additive Type
- 6. Global Fluid Loss Additive Market Analysis, Insights and Forecast, 2021-2033
- 6.1. Market Analysis, Insights and Forecast - by Additive Type
- 6.1.1. Synthetic
- 6.1.2. Natural
- 6.1.3. Synthetically Modified Natural
- 6.2. Market Analysis, Insights and Forecast - by Application
- 6.2.1. Drilling Fluid
- 6.2.2. Cement Slurry
- 6.1. Market Analysis, Insights and Forecast - by Additive Type
- 7. Asia Pacific Fluid Loss Additive Market Analysis, Insights and Forecast, 2020-2032
- 7.1. Market Analysis, Insights and Forecast - by Additive Type
- 7.1.1. Synthetic
- 7.1.2. Natural
- 7.1.3. Synthetically Modified Natural
- 7.2. Market Analysis, Insights and Forecast - by Application
- 7.2.1. Drilling Fluid
- 7.2.2. Cement Slurry
- 7.1. Market Analysis, Insights and Forecast - by Additive Type
- 8. North America Fluid Loss Additive Market Analysis, Insights and Forecast, 2020-2032
- 8.1. Market Analysis, Insights and Forecast - by Additive Type
- 8.1.1. Synthetic
- 8.1.2. Natural
- 8.1.3. Synthetically Modified Natural
- 8.2. Market Analysis, Insights and Forecast - by Application
- 8.2.1. Drilling Fluid
- 8.2.2. Cement Slurry
- 8.1. Market Analysis, Insights and Forecast - by Additive Type
- 9. Europe Fluid Loss Additive Market Analysis, Insights and Forecast, 2020-2032
- 9.1. Market Analysis, Insights and Forecast - by Additive Type
- 9.1.1. Synthetic
- 9.1.2. Natural
- 9.1.3. Synthetically Modified Natural
- 9.2. Market Analysis, Insights and Forecast - by Application
- 9.2.1. Drilling Fluid
- 9.2.2. Cement Slurry
- 9.1. Market Analysis, Insights and Forecast - by Additive Type
- 10. South America Fluid Loss Additive Market Analysis, Insights and Forecast, 2020-2032
- 10.1. Market Analysis, Insights and Forecast - by Additive Type
- 10.1.1. Synthetic
- 10.1.2. Natural
- 10.1.3. Synthetically Modified Natural
- 10.2. Market Analysis, Insights and Forecast - by Application
- 10.2.1. Drilling Fluid
- 10.2.2. Cement Slurry
- 10.1. Market Analysis, Insights and Forecast - by Additive Type
- 11. Middle East and Africa Fluid Loss Additive Market Analysis, Insights and Forecast, 2020-2032
- 11.1. Market Analysis, Insights and Forecast - by Additive Type
- 11.1.1. Synthetic
- 11.1.2. Natural
- 11.1.3. Synthetically Modified Natural
- 11.2. Market Analysis, Insights and Forecast - by Application
- 11.2.1. Drilling Fluid
- 11.2.2. Cement Slurry
- 11.1. Market Analysis, Insights and Forecast - by Additive Type
- 12. Competitive Analysis
- 12.1. Company Profiles
- 12.1.1 Clariant
- 12.1.1.1. Company Overview
- 12.1.1.2. Products
- 12.1.1.3. Company Financials
- 12.1.1.4. SWOT Analysis
- 12.1.2 Nouryon
- 12.1.2.1. Company Overview
- 12.1.2.2. Products
- 12.1.2.3. Company Financials
- 12.1.2.4. SWOT Analysis
- 12.1.3 Global Drilling Fluids and Chemicals Limited
- 12.1.3.1. Company Overview
- 12.1.3.2. Products
- 12.1.3.3. Company Financials
- 12.1.3.4. SWOT Analysis
- 12.1.4 Solvay
- 12.1.4.1. Company Overview
- 12.1.4.2. Products
- 12.1.4.3. Company Financials
- 12.1.4.4. SWOT Analysis
- 12.1.5 Newpark Resources Inc
- 12.1.5.1. Company Overview
- 12.1.5.2. Products
- 12.1.5.3. Company Financials
- 12.1.5.4. SWOT Analysis
- 12.1.6 Kemira OYJ
- 12.1.6.1. Company Overview
- 12.1.6.2. Products
- 12.1.6.3. Company Financials
- 12.1.6.4. SWOT Analysis
- 12.1.7 BASF SE
- 12.1.7.1. Company Overview
- 12.1.7.2. Products
- 12.1.7.3. Company Financials
- 12.1.7.4. SWOT Analysis
- 12.1.8 Tytan Organics Pvt Ltd
- 12.1.8.1. Company Overview
- 12.1.8.2. Products
- 12.1.8.3. Company Financials
- 12.1.8.4. SWOT Analysis
- 12.1.9 Halliburton
- 12.1.9.1. Company Overview
- 12.1.9.2. Products
- 12.1.9.3. Company Financials
- 12.1.9.4. SWOT Analysis
- 12.1.10 Schlumberger Limited
- 12.1.10.1. Company Overview
- 12.1.10.2. Products
- 12.1.10.3. Company Financials
- 12.1.10.4. SWOT Analysis
- 12.1.1 Clariant
- 12.2. Market Entropy
- 12.2.1 Company's Key Areas Served
- 12.2.2 Recent Developments
- 12.3. Company Market Share Analysis 2025
- 12.3.1 Top 5 Companies Market Share Analysis
- 12.3.2 Top 3 Companies Market Share Analysis
- 12.4. List of Potential Customers
- 13. Research Methodology
List of Figures
- Figure 1: Global Fluid Loss Additive Market Revenue Breakdown (million, %) by Region 2025 & 2033
- Figure 2: Global Fluid Loss Additive Market Volume Breakdown (kg/m3, %) by Region 2025 & 2033
- Figure 3: Asia Pacific Fluid Loss Additive Market Revenue (million), by Additive Type 2025 & 2033
- Figure 4: Asia Pacific Fluid Loss Additive Market Volume (kg/m3), by Additive Type 2025 & 2033
- Figure 5: Asia Pacific Fluid Loss Additive Market Revenue Share (%), by Additive Type 2025 & 2033
- Figure 6: Asia Pacific Fluid Loss Additive Market Volume Share (%), by Additive Type 2025 & 2033
- Figure 7: Asia Pacific Fluid Loss Additive Market Revenue (million), by Application 2025 & 2033
- Figure 8: Asia Pacific Fluid Loss Additive Market Volume (kg/m3), by Application 2025 & 2033
- Figure 9: Asia Pacific Fluid Loss Additive Market Revenue Share (%), by Application 2025 & 2033
- Figure 10: Asia Pacific Fluid Loss Additive Market Volume Share (%), by Application 2025 & 2033
- Figure 11: Asia Pacific Fluid Loss Additive Market Revenue (million), by Country 2025 & 2033
- Figure 12: Asia Pacific Fluid Loss Additive Market Volume (kg/m3), by Country 2025 & 2033
- Figure 13: Asia Pacific Fluid Loss Additive Market Revenue Share (%), by Country 2025 & 2033
- Figure 14: Asia Pacific Fluid Loss Additive Market Volume Share (%), by Country 2025 & 2033
- Figure 15: North America Fluid Loss Additive Market Revenue (million), by Additive Type 2025 & 2033
- Figure 16: North America Fluid Loss Additive Market Volume (kg/m3), by Additive Type 2025 & 2033
- Figure 17: North America Fluid Loss Additive Market Revenue Share (%), by Additive Type 2025 & 2033
- Figure 18: North America Fluid Loss Additive Market Volume Share (%), by Additive Type 2025 & 2033
- Figure 19: North America Fluid Loss Additive Market Revenue (million), by Application 2025 & 2033
- Figure 20: North America Fluid Loss Additive Market Volume (kg/m3), by Application 2025 & 2033
- Figure 21: North America Fluid Loss Additive Market Revenue Share (%), by Application 2025 & 2033
- Figure 22: North America Fluid Loss Additive Market Volume Share (%), by Application 2025 & 2033
- Figure 23: North America Fluid Loss Additive Market Revenue (million), by Country 2025 & 2033
- Figure 24: North America Fluid Loss Additive Market Volume (kg/m3), by Country 2025 & 2033
- Figure 25: North America Fluid Loss Additive Market Revenue Share (%), by Country 2025 & 2033
- Figure 26: North America Fluid Loss Additive Market Volume Share (%), by Country 2025 & 2033
- Figure 27: Europe Fluid Loss Additive Market Revenue (million), by Additive Type 2025 & 2033
- Figure 28: Europe Fluid Loss Additive Market Volume (kg/m3), by Additive Type 2025 & 2033
- Figure 29: Europe Fluid Loss Additive Market Revenue Share (%), by Additive Type 2025 & 2033
- Figure 30: Europe Fluid Loss Additive Market Volume Share (%), by Additive Type 2025 & 2033
- Figure 31: Europe Fluid Loss Additive Market Revenue (million), by Application 2025 & 2033
- Figure 32: Europe Fluid Loss Additive Market Volume (kg/m3), by Application 2025 & 2033
- Figure 33: Europe Fluid Loss Additive Market Revenue Share (%), by Application 2025 & 2033
- Figure 34: Europe Fluid Loss Additive Market Volume Share (%), by Application 2025 & 2033
- Figure 35: Europe Fluid Loss Additive Market Revenue (million), by Country 2025 & 2033
- Figure 36: Europe Fluid Loss Additive Market Volume (kg/m3), by Country 2025 & 2033
- Figure 37: Europe Fluid Loss Additive Market Revenue Share (%), by Country 2025 & 2033
- Figure 38: Europe Fluid Loss Additive Market Volume Share (%), by Country 2025 & 2033
- Figure 39: South America Fluid Loss Additive Market Revenue (million), by Additive Type 2025 & 2033
- Figure 40: South America Fluid Loss Additive Market Volume (kg/m3), by Additive Type 2025 & 2033
- Figure 41: South America Fluid Loss Additive Market Revenue Share (%), by Additive Type 2025 & 2033
- Figure 42: South America Fluid Loss Additive Market Volume Share (%), by Additive Type 2025 & 2033
- Figure 43: South America Fluid Loss Additive Market Revenue (million), by Application 2025 & 2033
- Figure 44: South America Fluid Loss Additive Market Volume (kg/m3), by Application 2025 & 2033
- Figure 45: South America Fluid Loss Additive Market Revenue Share (%), by Application 2025 & 2033
- Figure 46: South America Fluid Loss Additive Market Volume Share (%), by Application 2025 & 2033
- Figure 47: South America Fluid Loss Additive Market Revenue (million), by Country 2025 & 2033
- Figure 48: South America Fluid Loss Additive Market Volume (kg/m3), by Country 2025 & 2033
- Figure 49: South America Fluid Loss Additive Market Revenue Share (%), by Country 2025 & 2033
- Figure 50: South America Fluid Loss Additive Market Volume Share (%), by Country 2025 & 2033
- Figure 51: Middle East and Africa Fluid Loss Additive Market Revenue (million), by Additive Type 2025 & 2033
- Figure 52: Middle East and Africa Fluid Loss Additive Market Volume (kg/m3), by Additive Type 2025 & 2033
- Figure 53: Middle East and Africa Fluid Loss Additive Market Revenue Share (%), by Additive Type 2025 & 2033
- Figure 54: Middle East and Africa Fluid Loss Additive Market Volume Share (%), by Additive Type 2025 & 2033
- Figure 55: Middle East and Africa Fluid Loss Additive Market Revenue (million), by Application 2025 & 2033
- Figure 56: Middle East and Africa Fluid Loss Additive Market Volume (kg/m3), by Application 2025 & 2033
- Figure 57: Middle East and Africa Fluid Loss Additive Market Revenue Share (%), by Application 2025 & 2033
- Figure 58: Middle East and Africa Fluid Loss Additive Market Volume Share (%), by Application 2025 & 2033
- Figure 59: Middle East and Africa Fluid Loss Additive Market Revenue (million), by Country 2025 & 2033
- Figure 60: Middle East and Africa Fluid Loss Additive Market Volume (kg/m3), by Country 2025 & 2033
- Figure 61: Middle East and Africa Fluid Loss Additive Market Revenue Share (%), by Country 2025 & 2033
- Figure 62: Middle East and Africa Fluid Loss Additive Market Volume Share (%), by Country 2025 & 2033
List of Tables
- Table 1: Global Fluid Loss Additive Market Revenue million Forecast, by Additive Type 2020 & 2033
- Table 2: Global Fluid Loss Additive Market Volume kg/m3 Forecast, by Additive Type 2020 & 2033
- Table 3: Global Fluid Loss Additive Market Revenue million Forecast, by Application 2020 & 2033
- Table 4: Global Fluid Loss Additive Market Volume kg/m3 Forecast, by Application 2020 & 2033
- Table 5: Global Fluid Loss Additive Market Revenue million Forecast, by Region 2020 & 2033
- Table 6: Global Fluid Loss Additive Market Volume kg/m3 Forecast, by Region 2020 & 2033
- Table 7: Global Fluid Loss Additive Market Revenue million Forecast, by Additive Type 2020 & 2033
- Table 8: Global Fluid Loss Additive Market Volume kg/m3 Forecast, by Additive Type 2020 & 2033
- Table 9: Global Fluid Loss Additive Market Revenue million Forecast, by Application 2020 & 2033
- Table 10: Global Fluid Loss Additive Market Volume kg/m3 Forecast, by Application 2020 & 2033
- Table 11: Global Fluid Loss Additive Market Revenue million Forecast, by Country 2020 & 2033
- Table 12: Global Fluid Loss Additive Market Volume kg/m3 Forecast, by Country 2020 & 2033
- Table 13: China Fluid Loss Additive Market Revenue (million) Forecast, by Application 2020 & 2033
- Table 14: China Fluid Loss Additive Market Volume (kg/m3) Forecast, by Application 2020 & 2033
- Table 15: India Fluid Loss Additive Market Revenue (million) Forecast, by Application 2020 & 2033
- Table 16: India Fluid Loss Additive Market Volume (kg/m3) Forecast, by Application 2020 & 2033
- Table 17: Japan Fluid Loss Additive Market Revenue (million) Forecast, by Application 2020 & 2033
- Table 18: Japan Fluid Loss Additive Market Volume (kg/m3) Forecast, by Application 2020 & 2033
- Table 19: South Korea Fluid Loss Additive Market Revenue (million) Forecast, by Application 2020 & 2033
- Table 20: South Korea Fluid Loss Additive Market Volume (kg/m3) Forecast, by Application 2020 & 2033
- Table 21: Rest of Asia Pacific Fluid Loss Additive Market Revenue (million) Forecast, by Application 2020 & 2033
- Table 22: Rest of Asia Pacific Fluid Loss Additive Market Volume (kg/m3) Forecast, by Application 2020 & 2033
- Table 23: Global Fluid Loss Additive Market Revenue million Forecast, by Additive Type 2020 & 2033
- Table 24: Global Fluid Loss Additive Market Volume kg/m3 Forecast, by Additive Type 2020 & 2033
- Table 25: Global Fluid Loss Additive Market Revenue million Forecast, by Application 2020 & 2033
- Table 26: Global Fluid Loss Additive Market Volume kg/m3 Forecast, by Application 2020 & 2033
- Table 27: Global Fluid Loss Additive Market Revenue million Forecast, by Country 2020 & 2033
- Table 28: Global Fluid Loss Additive Market Volume kg/m3 Forecast, by Country 2020 & 2033
- Table 29: United States Fluid Loss Additive Market Revenue (million) Forecast, by Application 2020 & 2033
- Table 30: United States Fluid Loss Additive Market Volume (kg/m3) Forecast, by Application 2020 & 2033
- Table 31: Canada Fluid Loss Additive Market Revenue (million) Forecast, by Application 2020 & 2033
- Table 32: Canada Fluid Loss Additive Market Volume (kg/m3) Forecast, by Application 2020 & 2033
- Table 33: Mexico Fluid Loss Additive Market Revenue (million) Forecast, by Application 2020 & 2033
- Table 34: Mexico Fluid Loss Additive Market Volume (kg/m3) Forecast, by Application 2020 & 2033
- Table 35: Global Fluid Loss Additive Market Revenue million Forecast, by Additive Type 2020 & 2033
- Table 36: Global Fluid Loss Additive Market Volume kg/m3 Forecast, by Additive Type 2020 & 2033
- Table 37: Global Fluid Loss Additive Market Revenue million Forecast, by Application 2020 & 2033
- Table 38: Global Fluid Loss Additive Market Volume kg/m3 Forecast, by Application 2020 & 2033
- Table 39: Global Fluid Loss Additive Market Revenue million Forecast, by Country 2020 & 2033
- Table 40: Global Fluid Loss Additive Market Volume kg/m3 Forecast, by Country 2020 & 2033
- Table 41: Germany Fluid Loss Additive Market Revenue (million) Forecast, by Application 2020 & 2033
- Table 42: Germany Fluid Loss Additive Market Volume (kg/m3) Forecast, by Application 2020 & 2033
- Table 43: United Kingdom Fluid Loss Additive Market Revenue (million) Forecast, by Application 2020 & 2033
- Table 44: United Kingdom Fluid Loss Additive Market Volume (kg/m3) Forecast, by Application 2020 & 2033
- Table 45: France Fluid Loss Additive Market Revenue (million) Forecast, by Application 2020 & 2033
- Table 46: France Fluid Loss Additive Market Volume (kg/m3) Forecast, by Application 2020 & 2033
- Table 47: Italy Fluid Loss Additive Market Revenue (million) Forecast, by Application 2020 & 2033
- Table 48: Italy Fluid Loss Additive Market Volume (kg/m3) Forecast, by Application 2020 & 2033
- Table 49: Rest of Europe Fluid Loss Additive Market Revenue (million) Forecast, by Application 2020 & 2033
- Table 50: Rest of Europe Fluid Loss Additive Market Volume (kg/m3) Forecast, by Application 2020 & 2033
- Table 51: Global Fluid Loss Additive Market Revenue million Forecast, by Additive Type 2020 & 2033
- Table 52: Global Fluid Loss Additive Market Volume kg/m3 Forecast, by Additive Type 2020 & 2033
- Table 53: Global Fluid Loss Additive Market Revenue million Forecast, by Application 2020 & 2033
- Table 54: Global Fluid Loss Additive Market Volume kg/m3 Forecast, by Application 2020 & 2033
- Table 55: Global Fluid Loss Additive Market Revenue million Forecast, by Country 2020 & 2033
- Table 56: Global Fluid Loss Additive Market Volume kg/m3 Forecast, by Country 2020 & 2033
- Table 57: Brazil Fluid Loss Additive Market Revenue (million) Forecast, by Application 2020 & 2033
- Table 58: Brazil Fluid Loss Additive Market Volume (kg/m3) Forecast, by Application 2020 & 2033
- Table 59: Argentina Fluid Loss Additive Market Revenue (million) Forecast, by Application 2020 & 2033
- Table 60: Argentina Fluid Loss Additive Market Volume (kg/m3) Forecast, by Application 2020 & 2033
- Table 61: Rest of South America Fluid Loss Additive Market Revenue (million) Forecast, by Application 2020 & 2033
- Table 62: Rest of South America Fluid Loss Additive Market Volume (kg/m3) Forecast, by Application 2020 & 2033
- Table 63: Global Fluid Loss Additive Market Revenue million Forecast, by Additive Type 2020 & 2033
- Table 64: Global Fluid Loss Additive Market Volume kg/m3 Forecast, by Additive Type 2020 & 2033
- Table 65: Global Fluid Loss Additive Market Revenue million Forecast, by Application 2020 & 2033
- Table 66: Global Fluid Loss Additive Market Volume kg/m3 Forecast, by Application 2020 & 2033
- Table 67: Global Fluid Loss Additive Market Revenue million Forecast, by Country 2020 & 2033
- Table 68: Global Fluid Loss Additive Market Volume kg/m3 Forecast, by Country 2020 & 2033
- Table 69: Saudi Arabia Fluid Loss Additive Market Revenue (million) Forecast, by Application 2020 & 2033
- Table 70: Saudi Arabia Fluid Loss Additive Market Volume (kg/m3) Forecast, by Application 2020 & 2033
- Table 71: South Africa Fluid Loss Additive Market Revenue (million) Forecast, by Application 2020 & 2033
- Table 72: South Africa Fluid Loss Additive Market Volume (kg/m3) Forecast, by Application 2020 & 2033
- Table 73: Rest of Middle East and Africa Fluid Loss Additive Market Revenue (million) Forecast, by Application 2020 & 2033
- Table 74: Rest of Middle East and Africa Fluid Loss Additive Market Volume (kg/m3) Forecast, by Application 2020 & 2033
Frequently Asked Questions
1. What is the projected Compound Annual Growth Rate (CAGR) of the Fluid Loss Additive Market?
The projected CAGR is approximately 6.23%.
2. Which companies are prominent players in the Fluid Loss Additive Market?
Key companies in the market include Clariant, Nouryon, Global Drilling Fluids and Chemicals Limited, Solvay, Newpark Resources Inc, Kemira OYJ, BASF SE, Tytan Organics Pvt Ltd, Halliburton, Schlumberger Limited.
3. What are the main segments of the Fluid Loss Additive Market?
The market segments include Additive Type, Application.
4. Can you provide details about the market size?
The market size is estimated to be USD 383.25 million as of 2022.
5. What are some drivers contributing to market growth?
; Increase in Shale Gas Exploration; Increasing Investments in the Latest and Unconventional Drilling Technologies.
6. What are the notable trends driving market growth?
Drilling Fluid Application to Dominate the Market.
7. Are there any restraints impacting market growth?
; Growing Demand for Electric Vehicles; Harmful Impact on Environment.
8. Can you provide examples of recent developments in the market?
N/A
9. What pricing options are available for accessing the report?
Pricing options include single-user, multi-user, and enterprise licenses priced at USD 4750, USD 5250, and USD 8750 respectively.
10. Is the market size provided in terms of value or volume?
The market size is provided in terms of value, measured in million and volume, measured in kg/m3.
11. Are there any specific market keywords associated with the report?
Yes, the market keyword associated with the report is "Fluid Loss Additive Market," which aids in identifying and referencing the specific market segment covered.
12. How do I determine which pricing option suits my needs best?
The pricing options vary based on user requirements and access needs. Individual users may opt for single-user licenses, while businesses requiring broader access may choose multi-user or enterprise licenses for cost-effective access to the report.
13. Are there any additional resources or data provided in the Fluid Loss Additive Market report?
While the report offers comprehensive insights, it's advisable to review the specific contents or supplementary materials provided to ascertain if additional resources or data are available.
14. How can I stay updated on further developments or reports in the Fluid Loss Additive Market?
To stay informed about further developments, trends, and reports in the Fluid Loss Additive Market, consider subscribing to industry newsletters, following relevant companies and organizations, or regularly checking reputable industry news sources and publications.
Methodology
Step 1 - Identification of Relevant Samples Size from Population Database


Step 2 - Approaches for Defining Global Market Size (Value, Volume* & Price*)

Note*: In applicable scenarios
Step 3 - Data Sources
Primary Research
- Web Analytics
- Survey Reports
- Research Institute
- Latest Research Reports
- Opinion Leaders
Secondary Research
- Annual Reports
- White Paper
- Latest Press Release
- Industry Association
- Paid Database
- Investor Presentations

Step 4 - Data Triangulation
Involves using different sources of information in order to increase the validity of a study
These sources are likely to be stakeholders in a program - participants, other researchers, program staff, other community members, and so on.
Then we put all data in single framework & apply various statistical tools to find out the dynamic on the market.
During the analysis stage, feedback from the stakeholder groups would be compared to determine areas of agreement as well as areas of divergence