

Key Insights
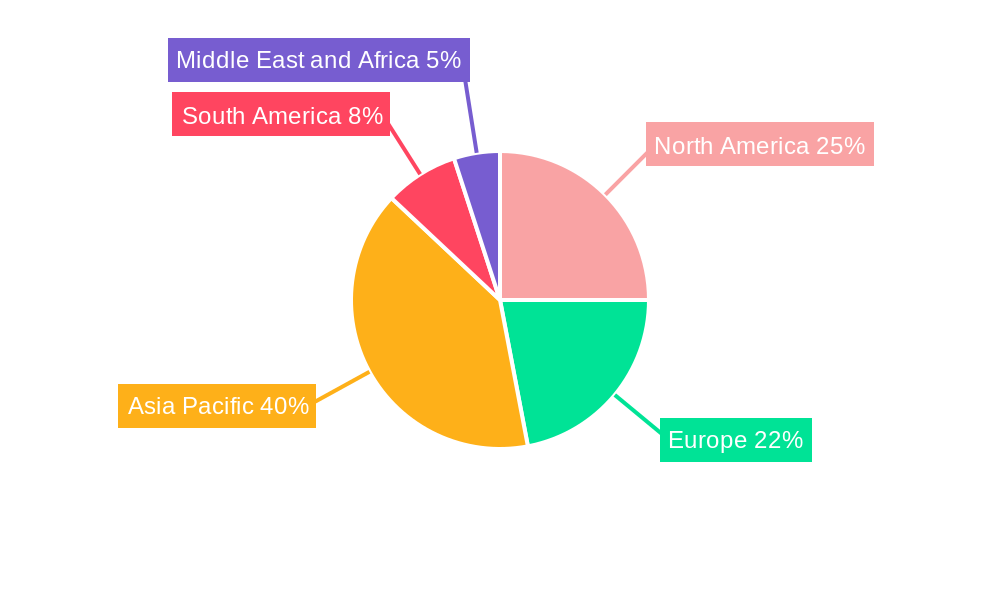
The formic acid market, valued at approximately $XX million in 2025, is projected to experience robust growth, exceeding a 3.50% CAGR from 2025 to 2033. This expansion is fueled by increasing demand across diverse sectors. The animal feed and silage additive segment is a major driver, leveraging formic acid's preservative and antimicrobial properties to enhance feed efficiency and livestock health. Growth in the leather tanning industry also contributes significantly, with formic acid playing a crucial role in the processing and preservation of hides. Furthermore, the textile dyeing and finishing industry uses formic acid as a pH regulator and mordant, contributing to the overall market demand. While pharmaceutical applications represent a smaller segment currently, potential for growth exists as formic acid's properties are further explored in drug synthesis and formulation. Other applications, including those in the cleaning and agriculture sectors, contribute to overall market diversification. Geographical analysis reveals a strong presence in the Asia-Pacific region, driven by the rapid industrialization and economic growth in countries like China and India. North America and Europe also contribute significantly to market revenue, benefiting from established chemical industries and stringent environmental regulations driving sustainable manufacturing processes. However, fluctuating raw material prices and the potential environmental concerns associated with production pose some restraints to the market's growth trajectory.
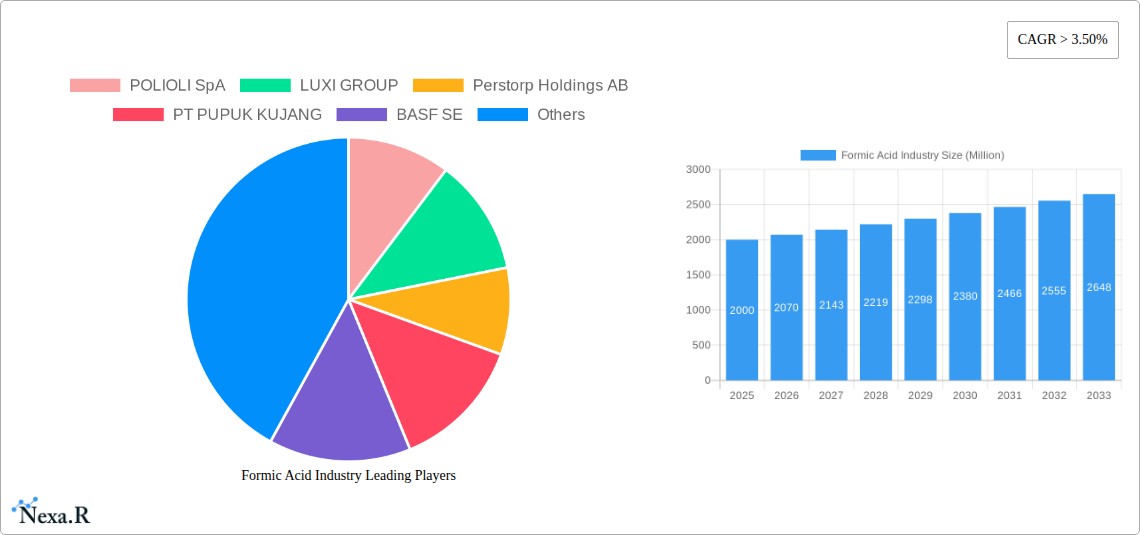
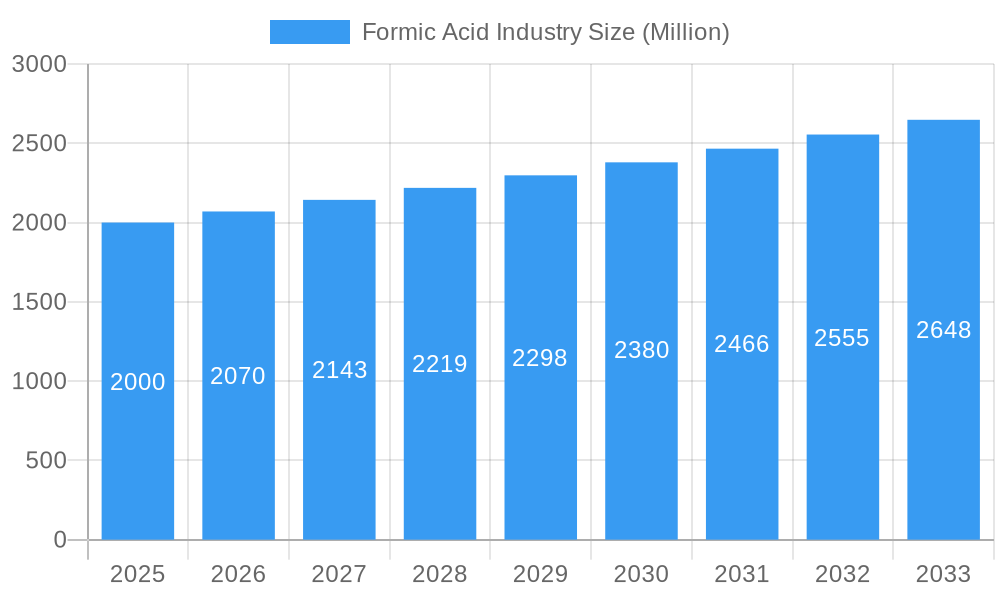
Formic Acid Industry Market Size (In Billion)
Despite these challenges, the formic acid market demonstrates strong prospects for future expansion. Ongoing research into new applications, coupled with technological advancements in production methods, will likely enhance efficiency and reduce environmental impact. Strategic partnerships between manufacturers and end-users across various sectors will be pivotal in optimizing supply chains and expanding market reach. The continued growth in the livestock industry globally and the increasing adoption of sustainable practices across various industrial sectors provide a strong foundation for the long-term success of the formic acid market. Companies like POLIOLI SpA, LUXI GROUP, and BASF SE are key players shaping market dynamics through innovation and expansion strategies. The market’s performance will likely be influenced by factors such as global economic growth, regulatory changes, and the adoption of sustainable chemical manufacturing technologies.
Formic Acid Industry Company Market Share
Formic Acid Industry Market Report: 2019-2033
This comprehensive report provides a detailed analysis of the global formic acid industry, covering market dynamics, growth trends, regional analysis, product landscape, key players, and future outlook. The report utilizes data from the historical period (2019-2024), base year (2025), and estimated year (2025) to forecast market trends until 2033. The report segments the market by application, including Animal Feed and Silage Additives, Leather Tanning, Textile Dying and Finishing, Intermediary in Pharmaceuticals, and Other Applications, allowing for a granular understanding of market performance across various sectors. This in-depth analysis is crucial for businesses involved in the production, distribution, or application of formic acid.
Formic Acid Industry Market Dynamics & Structure
The formic acid market is characterized by moderate concentration, with several key players holding significant market share. The market is influenced by technological advancements in production processes, leading to increased efficiency and lower costs. Stringent environmental regulations related to chemical manufacturing and usage are key factors impacting market dynamics. Several competitive product substitutes exist, impacting market growth and creating pressure on pricing. End-user demographics are diverse, encompassing agricultural, industrial, and pharmaceutical sectors. The market has seen a moderate level of M&A activity in recent years, with companies strategically consolidating to enhance their market position.
- Market Concentration: Moderately concentrated, with top 5 players holding approximately xx% market share in 2025.
- Technological Innovation: Focus on improving production efficiency, reducing environmental impact, and developing new applications.
- Regulatory Framework: Stringent environmental regulations influence production methods and waste management practices.
- Competitive Substitutes: Acetic acid and other organic acids pose competitive challenges.
- End-User Demographics: Diverse, spanning agriculture, textiles, leather, pharmaceuticals, and other industries.
- M&A Trends: Moderate M&A activity observed, primarily focused on consolidation and expansion. An estimated xx M&A deals occurred between 2019 and 2024.
Formic Acid Industry Growth Trends & Insights
The global formic acid market is projected to experience significant growth during the forecast period (2025-2033). Driven by increasing demand from various end-use sectors, particularly animal feed and silage additives, the market size is estimated to reach xx million units by 2033. The compound annual growth rate (CAGR) is expected to be xx% from 2025 to 2033. This growth is attributed to several factors, including the increasing adoption of formic acid in various applications, technological advancements resulting in cost-effective production, and favorable government policies promoting sustainable agriculture. Changes in consumer behavior towards environmentally friendly products are further bolstering market growth. Technological disruptions, such as the development of more efficient production processes and innovative applications, are also playing a significant role. Market penetration across various sectors is expected to increase, particularly in emerging economies.
Dominant Regions, Countries, or Segments in Formic Acid Industry
Asia Pacific is currently the dominant region in the formic acid market, driven by strong growth in the animal feed and silage additives segment. China and India are key contributors to this growth, supported by robust economic growth, expanding agricultural sectors, and rising demand for efficient livestock management techniques. The Animal Feed and Silage Additives segment holds the largest market share, driven by the growing demand for animal feed preservatives and silage inoculants.
Key Drivers in Asia Pacific:
- Rapid economic growth
- Expanding agricultural sector
- Increasing livestock population
- Government support for sustainable agriculture practices
Dominance Factors: High consumption in animal feed, growing textile industry, and increasing pharmaceutical production contribute significantly to the region’s dominance. The market in Asia Pacific is projected to grow at a CAGR of xx% during the forecast period.
Formic Acid Industry Product Landscape
Formic acid is primarily available in various grades based on purity and concentration. Innovations focus on developing higher purity grades to meet the stringent requirements of specific applications, particularly in the pharmaceutical industry. Technological advancements in production methods have led to improved efficiency and cost reduction. Unique selling propositions include its biodegradability, making it an environmentally friendly alternative compared to other chemicals.
Key Drivers, Barriers & Challenges in Formic Acid Industry
Key Drivers:
- Growing demand from the animal feed and silage industry.
- Increasing application in textile and leather processing.
- Expanding use as a pharmaceutical intermediary.
- Technological advancements leading to efficient production.
Key Challenges:
- Fluctuations in raw material prices.
- Stringent environmental regulations.
- Intense competition from substitute products. (Estimated xx% market share loss to substitutes by 2033)
- Supply chain disruptions leading to price volatility.
Emerging Opportunities in Formic Acid Industry
Emerging opportunities lie in the development of new applications for formic acid in various industries. The expanding bio-based chemicals market presents significant growth potential. Untapped markets in developing economies offer substantial growth prospects. The increasing focus on sustainable and eco-friendly solutions further boosts demand.
Growth Accelerators in the Formic Acid Industry Industry
Technological advancements in production processes and development of new, high-value applications will significantly accelerate market growth. Strategic partnerships between manufacturers and end-users will enhance market penetration. Expansion into untapped markets, especially in developing economies, will further drive growth.
Key Players Shaping the Formic Acid Industry Market
- POLIOLI SpA
- LUXI GROUP
- Perstorp Holdings AB
- PT PUPUK KUJANG
- BASF SE
- Eastman Chemical Company
- Wuhan Ruisunny Chemical Co Ltd
- Shandong Acid Technology Co Ltd
- Gujarat Narmada Valley Fertilizers & Chemicals Limited
- Rashtriya Chemicals and Fertilizers Limited
Notable Milestones in Formic Acid Industry Sector
- March 2021: BASF SE announced a USD 0.05 per pound price increase for formic acid in North America.
In-Depth Formic Acid Industry Market Outlook
The formic acid market is poised for continued growth, driven by strong demand from various sectors. Strategic investments in research and development, focusing on innovative applications and sustainable production methods, will further enhance market potential. Companies focusing on efficient supply chain management and strategic partnerships will be well-positioned to capitalize on the growing opportunities.
Formic Acid Industry Segmentation
-
1. Application
- 1.1. Animal Feed and Silage Additives
- 1.2. Leather Tanning
- 1.3. Textile Dying and Finishing
- 1.4. Intermediary in Pharmaceuticals
- 1.5. Other Applications
Formic Acid Industry Segmentation By Geography
-
1. Asia Pacific
- 1.1. China
- 1.2. India
- 1.3. Japan
- 1.4. South Korea
- 1.5. Rest of Asia Pacific
-
2. North America
- 2.1. United States
- 2.2. Canada
- 2.3. Mexico
-
3. Europe
- 3.1. Germany
- 3.2. United Kingdom
- 3.3. Italy
- 3.4. France
- 3.5. Rest of Europe
-
4. South America
- 4.1. Brazil
- 4.2. Argentina
- 4.3. Rest of South America
-
5. Middle East and Africa
- 5.1. Saudi Arabia
- 5.2. South Africa
- 5.3. Rest of Middle East and Africa
Formic Acid Industry Regional Market Share
Geographic Coverage of Formic Acid Industry
Formic Acid Industry REPORT HIGHLIGHTS
| Aspects | Details |
|---|---|
| Study Period | 2020-2034 |
| Base Year | 2025 |
| Estimated Year | 2026 |
| Forecast Period | 2026-2034 |
| Historical Period | 2020-2025 |
| Growth Rate | CAGR of > 3.50% from 2020-2034 |
| Segmentation |
|
Table of Contents
- 1. Introduction
- 1.1. Research Scope
- 1.2. Market Segmentation
- 1.3. Research Objective
- 1.4. Definitions and Assumptions
- 2. Executive Summary
- 2.1. Market Snapshot
- 3. Market Dynamics
- 3.1. Market Drivers
- 3.2. Market Restrains
- 3.3. Market Trends
- 3.4. Market Opportunities
- 4. Market Factor Analysis
- 4.1. Porters Five Forces
- 4.1.1. Bargaining Power of Suppliers
- 4.1.2. Bargaining Power of Buyers
- 4.1.3. Threat of New Entrants
- 4.1.4. Threat of Substitutes
- 4.1.5. Competitive Rivalry
- 4.2. PESTEL analysis
- 4.3. BCG Analysis
- 4.3.1. Stars (High Growth, High Market Share)
- 4.3.2. Cash Cows (Low Growth, High Market Share)
- 4.3.3. Question Mark (High Growth, Low Market Share)
- 4.3.4. Dogs (Low Growth, Low Market Share)
- 4.4. Ansoff Matrix Analysis
- 4.5. Supply Chain Analysis
- 4.6. Regulatory Landscape
- 4.7. Current Market Potential and Opportunity Assessment (TAM–SAM–SOM Framework)
- 4.8. NRP Analyst Note
- 4.1. Porters Five Forces
- 5. Market Analysis, Insights and Forecast 2021-2033
- 5.1. Market Analysis, Insights and Forecast - by Application
- 5.1.1. Animal Feed and Silage Additives
- 5.1.2. Leather Tanning
- 5.1.3. Textile Dying and Finishing
- 5.1.4. Intermediary in Pharmaceuticals
- 5.1.5. Other Applications
- 5.2. Market Analysis, Insights and Forecast - by Region
- 5.2.1. Asia Pacific
- 5.2.2. North America
- 5.2.3. Europe
- 5.2.4. South America
- 5.2.5. Middle East and Africa
- 5.1. Market Analysis, Insights and Forecast - by Application
- 6. Global Formic Acid Industry Analysis, Insights and Forecast, 2021-2033
- 6.1. Market Analysis, Insights and Forecast - by Application
- 6.1.1. Animal Feed and Silage Additives
- 6.1.2. Leather Tanning
- 6.1.3. Textile Dying and Finishing
- 6.1.4. Intermediary in Pharmaceuticals
- 6.1.5. Other Applications
- 6.1. Market Analysis, Insights and Forecast - by Application
- 7. Asia Pacific Formic Acid Industry Analysis, Insights and Forecast, 2020-2032
- 7.1. Market Analysis, Insights and Forecast - by Application
- 7.1.1. Animal Feed and Silage Additives
- 7.1.2. Leather Tanning
- 7.1.3. Textile Dying and Finishing
- 7.1.4. Intermediary in Pharmaceuticals
- 7.1.5. Other Applications
- 7.1. Market Analysis, Insights and Forecast - by Application
- 8. North America Formic Acid Industry Analysis, Insights and Forecast, 2020-2032
- 8.1. Market Analysis, Insights and Forecast - by Application
- 8.1.1. Animal Feed and Silage Additives
- 8.1.2. Leather Tanning
- 8.1.3. Textile Dying and Finishing
- 8.1.4. Intermediary in Pharmaceuticals
- 8.1.5. Other Applications
- 8.1. Market Analysis, Insights and Forecast - by Application
- 9. Europe Formic Acid Industry Analysis, Insights and Forecast, 2020-2032
- 9.1. Market Analysis, Insights and Forecast - by Application
- 9.1.1. Animal Feed and Silage Additives
- 9.1.2. Leather Tanning
- 9.1.3. Textile Dying and Finishing
- 9.1.4. Intermediary in Pharmaceuticals
- 9.1.5. Other Applications
- 9.1. Market Analysis, Insights and Forecast - by Application
- 10. South America Formic Acid Industry Analysis, Insights and Forecast, 2020-2032
- 10.1. Market Analysis, Insights and Forecast - by Application
- 10.1.1. Animal Feed and Silage Additives
- 10.1.2. Leather Tanning
- 10.1.3. Textile Dying and Finishing
- 10.1.4. Intermediary in Pharmaceuticals
- 10.1.5. Other Applications
- 10.1. Market Analysis, Insights and Forecast - by Application
- 11. Middle East and Africa Formic Acid Industry Analysis, Insights and Forecast, 2020-2032
- 11.1. Market Analysis, Insights and Forecast - by Application
- 11.1.1. Animal Feed and Silage Additives
- 11.1.2. Leather Tanning
- 11.1.3. Textile Dying and Finishing
- 11.1.4. Intermediary in Pharmaceuticals
- 11.1.5. Other Applications
- 11.1. Market Analysis, Insights and Forecast - by Application
- 12. Competitive Analysis
- 12.1. Company Profiles
- 12.1.1 POLIOLI SpA
- 12.1.1.1. Company Overview
- 12.1.1.2. Products
- 12.1.1.3. Company Financials
- 12.1.1.4. SWOT Analysis
- 12.1.2 LUXI GROUP
- 12.1.2.1. Company Overview
- 12.1.2.2. Products
- 12.1.2.3. Company Financials
- 12.1.2.4. SWOT Analysis
- 12.1.3 Perstorp Holdings AB
- 12.1.3.1. Company Overview
- 12.1.3.2. Products
- 12.1.3.3. Company Financials
- 12.1.3.4. SWOT Analysis
- 12.1.4 PT PUPUK KUJANG
- 12.1.4.1. Company Overview
- 12.1.4.2. Products
- 12.1.4.3. Company Financials
- 12.1.4.4. SWOT Analysis
- 12.1.5 BASF SE
- 12.1.5.1. Company Overview
- 12.1.5.2. Products
- 12.1.5.3. Company Financials
- 12.1.5.4. SWOT Analysis
- 12.1.6 Eastman Chemical Company
- 12.1.6.1. Company Overview
- 12.1.6.2. Products
- 12.1.6.3. Company Financials
- 12.1.6.4. SWOT Analysis
- 12.1.7 Wuhan Ruisunny Chemical Co Ltd
- 12.1.7.1. Company Overview
- 12.1.7.2. Products
- 12.1.7.3. Company Financials
- 12.1.7.4. SWOT Analysis
- 12.1.8 Shandong Acid Technology Co Ltd
- 12.1.8.1. Company Overview
- 12.1.8.2. Products
- 12.1.8.3. Company Financials
- 12.1.8.4. SWOT Analysis
- 12.1.9 Gujarat Narmada Valley Fertilizers & Chemicals Limited
- 12.1.9.1. Company Overview
- 12.1.9.2. Products
- 12.1.9.3. Company Financials
- 12.1.9.4. SWOT Analysis
- 12.1.10 Rashtriya Chemicals and Fertilizers Limited
- 12.1.10.1. Company Overview
- 12.1.10.2. Products
- 12.1.10.3. Company Financials
- 12.1.10.4. SWOT Analysis
- 12.1.1 POLIOLI SpA
- 12.2. Market Entropy
- 12.2.1 Company's Key Areas Served
- 12.2.2 Recent Developments
- 12.3. Company Market Share Analysis 2025
- 12.3.1 Top 5 Companies Market Share Analysis
- 12.3.2 Top 3 Companies Market Share Analysis
- 12.4. List of Potential Customers
- 13. Research Methodology
List of Figures
- Figure 1: Global Formic Acid Industry Revenue Breakdown (Million, %) by Region 2025 & 2033
- Figure 2: Global Formic Acid Industry Volume Breakdown (liter, %) by Region 2025 & 2033
- Figure 3: Asia Pacific Formic Acid Industry Revenue (Million), by Application 2025 & 2033
- Figure 4: Asia Pacific Formic Acid Industry Volume (liter), by Application 2025 & 2033
- Figure 5: Asia Pacific Formic Acid Industry Revenue Share (%), by Application 2025 & 2033
- Figure 6: Asia Pacific Formic Acid Industry Volume Share (%), by Application 2025 & 2033
- Figure 7: Asia Pacific Formic Acid Industry Revenue (Million), by Country 2025 & 2033
- Figure 8: Asia Pacific Formic Acid Industry Volume (liter), by Country 2025 & 2033
- Figure 9: Asia Pacific Formic Acid Industry Revenue Share (%), by Country 2025 & 2033
- Figure 10: Asia Pacific Formic Acid Industry Volume Share (%), by Country 2025 & 2033
- Figure 11: North America Formic Acid Industry Revenue (Million), by Application 2025 & 2033
- Figure 12: North America Formic Acid Industry Volume (liter), by Application 2025 & 2033
- Figure 13: North America Formic Acid Industry Revenue Share (%), by Application 2025 & 2033
- Figure 14: North America Formic Acid Industry Volume Share (%), by Application 2025 & 2033
- Figure 15: North America Formic Acid Industry Revenue (Million), by Country 2025 & 2033
- Figure 16: North America Formic Acid Industry Volume (liter), by Country 2025 & 2033
- Figure 17: North America Formic Acid Industry Revenue Share (%), by Country 2025 & 2033
- Figure 18: North America Formic Acid Industry Volume Share (%), by Country 2025 & 2033
- Figure 19: Europe Formic Acid Industry Revenue (Million), by Application 2025 & 2033
- Figure 20: Europe Formic Acid Industry Volume (liter), by Application 2025 & 2033
- Figure 21: Europe Formic Acid Industry Revenue Share (%), by Application 2025 & 2033
- Figure 22: Europe Formic Acid Industry Volume Share (%), by Application 2025 & 2033
- Figure 23: Europe Formic Acid Industry Revenue (Million), by Country 2025 & 2033
- Figure 24: Europe Formic Acid Industry Volume (liter), by Country 2025 & 2033
- Figure 25: Europe Formic Acid Industry Revenue Share (%), by Country 2025 & 2033
- Figure 26: Europe Formic Acid Industry Volume Share (%), by Country 2025 & 2033
- Figure 27: South America Formic Acid Industry Revenue (Million), by Application 2025 & 2033
- Figure 28: South America Formic Acid Industry Volume (liter), by Application 2025 & 2033
- Figure 29: South America Formic Acid Industry Revenue Share (%), by Application 2025 & 2033
- Figure 30: South America Formic Acid Industry Volume Share (%), by Application 2025 & 2033
- Figure 31: South America Formic Acid Industry Revenue (Million), by Country 2025 & 2033
- Figure 32: South America Formic Acid Industry Volume (liter), by Country 2025 & 2033
- Figure 33: South America Formic Acid Industry Revenue Share (%), by Country 2025 & 2033
- Figure 34: South America Formic Acid Industry Volume Share (%), by Country 2025 & 2033
- Figure 35: Middle East and Africa Formic Acid Industry Revenue (Million), by Application 2025 & 2033
- Figure 36: Middle East and Africa Formic Acid Industry Volume (liter), by Application 2025 & 2033
- Figure 37: Middle East and Africa Formic Acid Industry Revenue Share (%), by Application 2025 & 2033
- Figure 38: Middle East and Africa Formic Acid Industry Volume Share (%), by Application 2025 & 2033
- Figure 39: Middle East and Africa Formic Acid Industry Revenue (Million), by Country 2025 & 2033
- Figure 40: Middle East and Africa Formic Acid Industry Volume (liter), by Country 2025 & 2033
- Figure 41: Middle East and Africa Formic Acid Industry Revenue Share (%), by Country 2025 & 2033
- Figure 42: Middle East and Africa Formic Acid Industry Volume Share (%), by Country 2025 & 2033
List of Tables
- Table 1: Global Formic Acid Industry Revenue Million Forecast, by Application 2020 & 2033
- Table 2: Global Formic Acid Industry Volume liter Forecast, by Application 2020 & 2033
- Table 3: Global Formic Acid Industry Revenue Million Forecast, by Region 2020 & 2033
- Table 4: Global Formic Acid Industry Volume liter Forecast, by Region 2020 & 2033
- Table 5: Global Formic Acid Industry Revenue Million Forecast, by Application 2020 & 2033
- Table 6: Global Formic Acid Industry Volume liter Forecast, by Application 2020 & 2033
- Table 7: Global Formic Acid Industry Revenue Million Forecast, by Country 2020 & 2033
- Table 8: Global Formic Acid Industry Volume liter Forecast, by Country 2020 & 2033
- Table 9: China Formic Acid Industry Revenue (Million) Forecast, by Application 2020 & 2033
- Table 10: China Formic Acid Industry Volume (liter) Forecast, by Application 2020 & 2033
- Table 11: India Formic Acid Industry Revenue (Million) Forecast, by Application 2020 & 2033
- Table 12: India Formic Acid Industry Volume (liter) Forecast, by Application 2020 & 2033
- Table 13: Japan Formic Acid Industry Revenue (Million) Forecast, by Application 2020 & 2033
- Table 14: Japan Formic Acid Industry Volume (liter) Forecast, by Application 2020 & 2033
- Table 15: South Korea Formic Acid Industry Revenue (Million) Forecast, by Application 2020 & 2033
- Table 16: South Korea Formic Acid Industry Volume (liter) Forecast, by Application 2020 & 2033
- Table 17: Rest of Asia Pacific Formic Acid Industry Revenue (Million) Forecast, by Application 2020 & 2033
- Table 18: Rest of Asia Pacific Formic Acid Industry Volume (liter) Forecast, by Application 2020 & 2033
- Table 19: Global Formic Acid Industry Revenue Million Forecast, by Application 2020 & 2033
- Table 20: Global Formic Acid Industry Volume liter Forecast, by Application 2020 & 2033
- Table 21: Global Formic Acid Industry Revenue Million Forecast, by Country 2020 & 2033
- Table 22: Global Formic Acid Industry Volume liter Forecast, by Country 2020 & 2033
- Table 23: United States Formic Acid Industry Revenue (Million) Forecast, by Application 2020 & 2033
- Table 24: United States Formic Acid Industry Volume (liter) Forecast, by Application 2020 & 2033
- Table 25: Canada Formic Acid Industry Revenue (Million) Forecast, by Application 2020 & 2033
- Table 26: Canada Formic Acid Industry Volume (liter) Forecast, by Application 2020 & 2033
- Table 27: Mexico Formic Acid Industry Revenue (Million) Forecast, by Application 2020 & 2033
- Table 28: Mexico Formic Acid Industry Volume (liter) Forecast, by Application 2020 & 2033
- Table 29: Global Formic Acid Industry Revenue Million Forecast, by Application 2020 & 2033
- Table 30: Global Formic Acid Industry Volume liter Forecast, by Application 2020 & 2033
- Table 31: Global Formic Acid Industry Revenue Million Forecast, by Country 2020 & 2033
- Table 32: Global Formic Acid Industry Volume liter Forecast, by Country 2020 & 2033
- Table 33: Germany Formic Acid Industry Revenue (Million) Forecast, by Application 2020 & 2033
- Table 34: Germany Formic Acid Industry Volume (liter) Forecast, by Application 2020 & 2033
- Table 35: United Kingdom Formic Acid Industry Revenue (Million) Forecast, by Application 2020 & 2033
- Table 36: United Kingdom Formic Acid Industry Volume (liter) Forecast, by Application 2020 & 2033
- Table 37: Italy Formic Acid Industry Revenue (Million) Forecast, by Application 2020 & 2033
- Table 38: Italy Formic Acid Industry Volume (liter) Forecast, by Application 2020 & 2033
- Table 39: France Formic Acid Industry Revenue (Million) Forecast, by Application 2020 & 2033
- Table 40: France Formic Acid Industry Volume (liter) Forecast, by Application 2020 & 2033
- Table 41: Rest of Europe Formic Acid Industry Revenue (Million) Forecast, by Application 2020 & 2033
- Table 42: Rest of Europe Formic Acid Industry Volume (liter) Forecast, by Application 2020 & 2033
- Table 43: Global Formic Acid Industry Revenue Million Forecast, by Application 2020 & 2033
- Table 44: Global Formic Acid Industry Volume liter Forecast, by Application 2020 & 2033
- Table 45: Global Formic Acid Industry Revenue Million Forecast, by Country 2020 & 2033
- Table 46: Global Formic Acid Industry Volume liter Forecast, by Country 2020 & 2033
- Table 47: Brazil Formic Acid Industry Revenue (Million) Forecast, by Application 2020 & 2033
- Table 48: Brazil Formic Acid Industry Volume (liter) Forecast, by Application 2020 & 2033
- Table 49: Argentina Formic Acid Industry Revenue (Million) Forecast, by Application 2020 & 2033
- Table 50: Argentina Formic Acid Industry Volume (liter) Forecast, by Application 2020 & 2033
- Table 51: Rest of South America Formic Acid Industry Revenue (Million) Forecast, by Application 2020 & 2033
- Table 52: Rest of South America Formic Acid Industry Volume (liter) Forecast, by Application 2020 & 2033
- Table 53: Global Formic Acid Industry Revenue Million Forecast, by Application 2020 & 2033
- Table 54: Global Formic Acid Industry Volume liter Forecast, by Application 2020 & 2033
- Table 55: Global Formic Acid Industry Revenue Million Forecast, by Country 2020 & 2033
- Table 56: Global Formic Acid Industry Volume liter Forecast, by Country 2020 & 2033
- Table 57: Saudi Arabia Formic Acid Industry Revenue (Million) Forecast, by Application 2020 & 2033
- Table 58: Saudi Arabia Formic Acid Industry Volume (liter) Forecast, by Application 2020 & 2033
- Table 59: South Africa Formic Acid Industry Revenue (Million) Forecast, by Application 2020 & 2033
- Table 60: South Africa Formic Acid Industry Volume (liter) Forecast, by Application 2020 & 2033
- Table 61: Rest of Middle East and Africa Formic Acid Industry Revenue (Million) Forecast, by Application 2020 & 2033
- Table 62: Rest of Middle East and Africa Formic Acid Industry Volume (liter) Forecast, by Application 2020 & 2033
Frequently Asked Questions
1. What is the projected Compound Annual Growth Rate (CAGR) of the Formic Acid Industry?
The projected CAGR is approximately > 3.50%.
2. Which companies are prominent players in the Formic Acid Industry?
Key companies in the market include POLIOLI SpA, LUXI GROUP, Perstorp Holdings AB, PT PUPUK KUJANG, BASF SE, Eastman Chemical Company, Wuhan Ruisunny Chemical Co Ltd, Shandong Acid Technology Co Ltd, Gujarat Narmada Valley Fertilizers & Chemicals Limited, Rashtriya Chemicals and Fertilizers Limited.
3. What are the main segments of the Formic Acid Industry?
The market segments include Application.
4. Can you provide details about the market size?
The market size is estimated to be USD XX Million as of 2022.
5. What are some drivers contributing to market growth?
Growing Demand for Animal Feed and Silage Additives; Other Drivers.
6. What are the notable trends driving market growth?
Animal Feed and Silage Additives to Dominate the Market.
7. Are there any restraints impacting market growth?
Other Restraints.
8. Can you provide examples of recent developments in the market?
In March 2021, BASF SE announced an increase in formic acid prices in North America for all grades, which would be USD 0.05 per pound.
9. What pricing options are available for accessing the report?
Pricing options include single-user, multi-user, and enterprise licenses priced at USD 4750, USD 5250, and USD 8750 respectively.
10. Is the market size provided in terms of value or volume?
The market size is provided in terms of value, measured in Million and volume, measured in liter.
11. Are there any specific market keywords associated with the report?
Yes, the market keyword associated with the report is "Formic Acid Industry," which aids in identifying and referencing the specific market segment covered.
12. How do I determine which pricing option suits my needs best?
The pricing options vary based on user requirements and access needs. Individual users may opt for single-user licenses, while businesses requiring broader access may choose multi-user or enterprise licenses for cost-effective access to the report.
13. Are there any additional resources or data provided in the Formic Acid Industry report?
While the report offers comprehensive insights, it's advisable to review the specific contents or supplementary materials provided to ascertain if additional resources or data are available.
14. How can I stay updated on further developments or reports in the Formic Acid Industry?
To stay informed about further developments, trends, and reports in the Formic Acid Industry, consider subscribing to industry newsletters, following relevant companies and organizations, or regularly checking reputable industry news sources and publications.
Methodology
Step 1 - Identification of Relevant Samples Size from Population Database


Step 2 - Approaches for Defining Global Market Size (Value, Volume* & Price*)

Note*: In applicable scenarios
Step 3 - Data Sources
Primary Research
- Web Analytics
- Survey Reports
- Research Institute
- Latest Research Reports
- Opinion Leaders
Secondary Research
- Annual Reports
- White Paper
- Latest Press Release
- Industry Association
- Paid Database
- Investor Presentations

Step 4 - Data Triangulation
Involves using different sources of information in order to increase the validity of a study
These sources are likely to be stakeholders in a program - participants, other researchers, program staff, other community members, and so on.
Then we put all data in single framework & apply various statistical tools to find out the dynamic on the market.
During the analysis stage, feedback from the stakeholder groups would be compared to determine areas of agreement as well as areas of divergence