

Key Insights
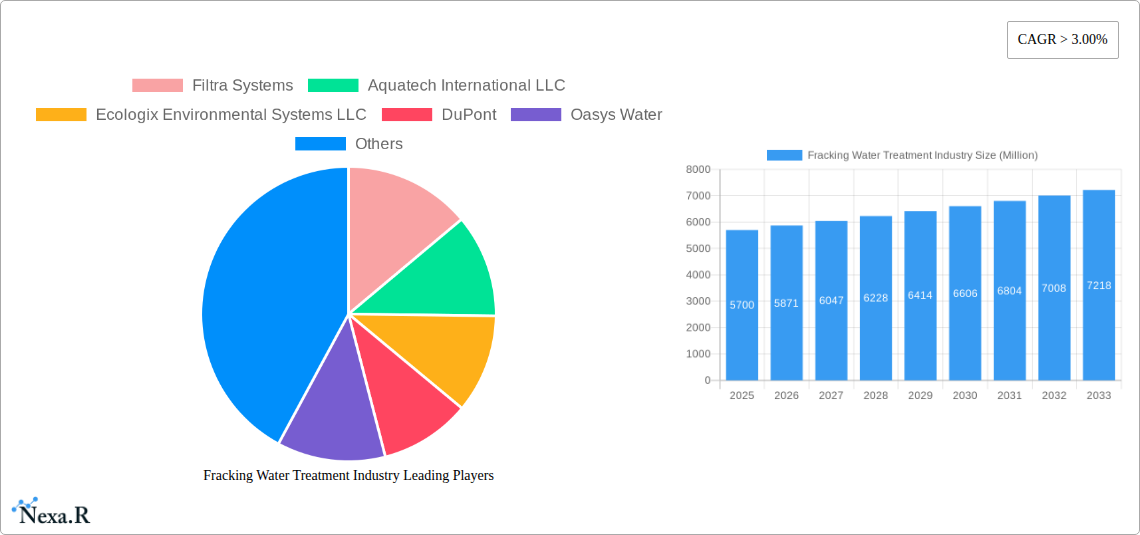
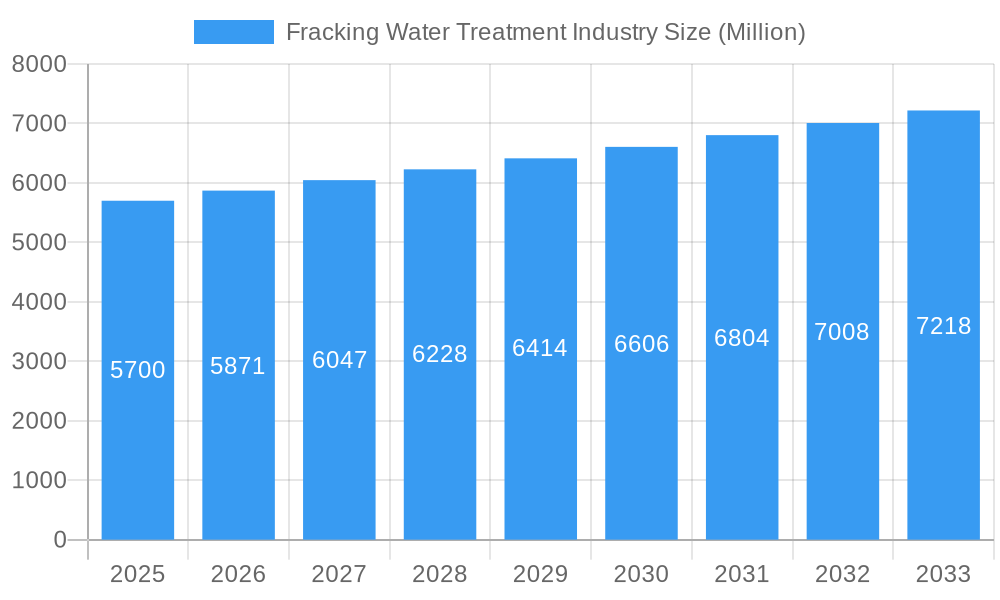
The fracking water treatment market, currently valued at $5.7 billion (2025), is projected to experience robust growth, driven by increasing shale gas and oil production globally. A compound annual growth rate (CAGR) exceeding 3% from 2025 to 2033 indicates a significant expansion, fueled primarily by stringent environmental regulations mandating effective wastewater treatment and a rising awareness of water scarcity issues. The need to minimize the environmental impact of hydraulic fracturing is a key driver, leading to increased investments in advanced treatment technologies. Key application segments include treatment and recycling, which is expected to dominate due to cost-effectiveness and sustainability concerns, and deep well injection, a solution for managing produced water safely and efficiently. Major players such as Filtra Systems, Aquatech International, and Halliburton are leveraging technological advancements and strategic partnerships to cater to this growing demand. Regional variations are expected, with North America currently holding a substantial market share due to significant shale gas activity. However, the Asia-Pacific region, especially China and India, is poised for substantial growth, driven by increasing energy demands and ongoing infrastructure development in the oil and gas sector. The market's growth trajectory is anticipated to remain positive throughout the forecast period, with technological innovations focusing on improved efficiency and cost-reduction methods further accelerating market expansion.
Fracking Water Treatment Industry Market Size (In Billion)
The restraining factors include the high capital costs associated with implementing advanced treatment technologies and the fluctuating oil and gas prices. However, government incentives for sustainable water management and technological innovations in areas like membrane filtration and advanced oxidation processes are mitigating these challenges. The segment of treatment and recycle is projected to continue its dominance, with increasing adoption of water reuse strategies within the fracking industry. Furthermore, collaborations between treatment providers and energy companies are expected to facilitate greater efficiency and innovation within the market. The focus on minimizing environmental liabilities and achieving cost-effective solutions will drive strategic partnerships and mergers and acquisitions throughout the forecast period. This ongoing industry consolidation will shape the competitive landscape and accelerate the adoption of best practices in fracking water treatment.
Fracking Water Treatment Industry Company Market Share
This comprehensive report provides an in-depth analysis of the Fracking Water Treatment industry, offering invaluable insights for industry professionals, investors, and stakeholders. Covering the period 2019-2033, with a focus on 2025, this report meticulously examines market dynamics, growth trends, key players, and future opportunities within this crucial segment of the broader water treatment market.
Fracking Water Treatment Industry Market Dynamics & Structure
The global fracking water treatment market is a dynamic and evolving sector, projected to reach a significant valuation by 2025. The landscape is characterized by a healthy level of competition among established players and innovative newcomers, all striving to capture market share. A primary impetus for market growth is the relentless pursuit of technological innovation, driven by the imperative to develop highly efficient, cost-effective, and environmentally responsible water treatment solutions. Furthermore, evolving and increasingly stringent regulatory frameworks worldwide, particularly those focused on the responsible management and disposal of wastewater and broader environmental protection, play a pivotal role in shaping market operations and dictating treatment standards. The industry also faces ongoing competitive pressures not only from direct technological alternatives but also from the emergence of methods designed to minimize water usage in fracking operations themselves. The primary end-users consist of major oil and gas exploration and production companies, complemented by specialized water treatment service providers who offer expertise and infrastructure. Mergers and acquisitions (M&A) continue to be a notable feature, with a consistent flow of deals facilitating market consolidation, the acquisition of innovative technologies, and strategic expansion of service portfolios.
- Market Concentration: The market exhibits moderate concentration, with a significant portion of the market share held by a few leading entities.
- Technological Innovation: Continuous advancements are being made to enhance treatment efficiency, reduce operational costs, and promote greater environmental sustainability, including the development of zero-liquid discharge (ZLD) systems and advanced separation technologies.
- Regulatory Framework: The influence of comprehensive environmental regulations, including stricter discharge limits and mandates for water recycling, is a defining factor in market dynamics, pushing for higher standards and advanced treatment capabilities.
- Competitive Substitutes: The threat from alternative water management strategies, such as dry fracking methods and advanced water reuse technologies, necessitates constant innovation and cost optimization in traditional treatment processes.
- M&A Trends: Strategic acquisitions and partnerships remain active, signaling a trend towards consolidation, portfolio diversification, and the integration of cutting-edge technologies.
- Innovation Barriers: Significant upfront capital investment for the deployment of new technologies, coupled with the need for industry-wide standardization in testing and performance metrics, can pose challenges to rapid innovation adoption.
Fracking Water Treatment Industry Growth Trends & Insights
The fracking water treatment market experienced substantial growth during the historical period (2019-2024), exhibiting a CAGR of XX%. This growth is primarily attributed to the increasing demand for efficient water treatment solutions in the oil and gas industry, coupled with stricter environmental regulations. The adoption rate of advanced water treatment technologies, such as membrane filtration and advanced oxidation processes, has accelerated. Technological disruptions, particularly in membrane technology and automation, are continuously reshaping the industry landscape. Consumer behavior shifts toward sustainable and environmentally friendly practices are further driving market expansion. The market is projected to reach $XX million by 2033, with a forecast CAGR of XX% during 2025-2033. Market penetration of advanced technologies is expected to increase from XX% in 2025 to XX% by 2033.
Dominant Regions, Countries, or Segments in Fracking Water Treatment Industry
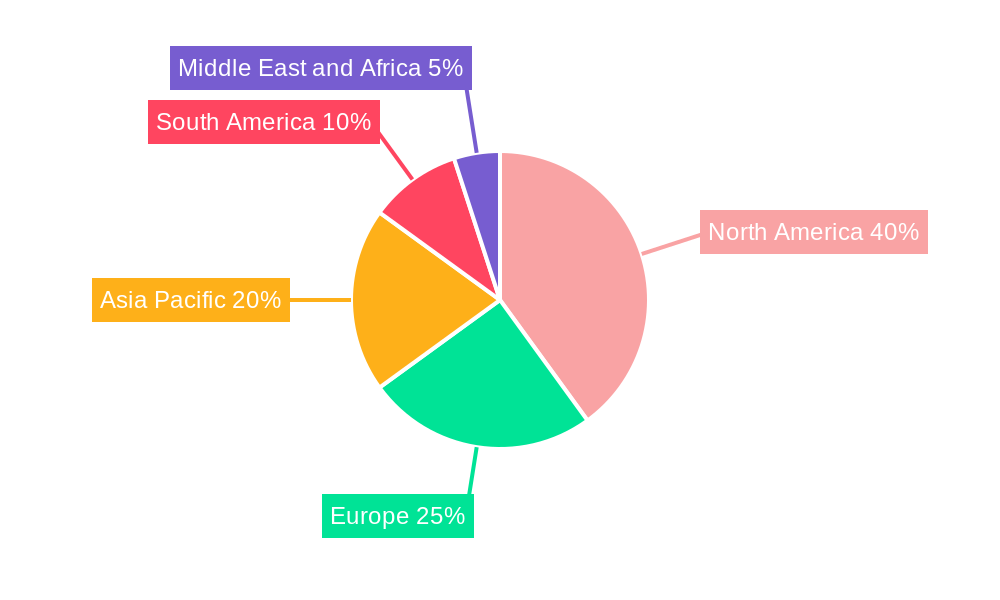
North America currently stands as the leading market for fracking water treatment solutions. This dominance is largely attributable to the extensive and ongoing shale gas exploration and production activities, particularly in the United States and Canada. These regions also benefit from established and robust environmental regulations that mandate effective wastewater management. Within the application segments, Treatment & Recycle commands a larger market share than Deep Well Injection. This is primarily due to the substantial volumes of produced water generated that require sophisticated treatment for beneficial reuse in subsequent fracking operations or safe discharge. The key drivers underpinning North America's market leadership include supportive government policies encouraging water stewardship, well-developed infrastructure for water management, and a high concentration of major oil and gas corporations with significant investment capacity.
- North America Dominance: Fueled by extensive shale resource development, stringent environmental mandates, and a strong presence of major energy companies, North America is the primary market.
- Treatment & Recycle Segment Leadership: This segment is outperforming others due to the imperative to treat and reuse produced water, driven by both regulatory requirements and economic advantages.
- Key Drivers: Government initiatives promoting sustainable water management, continuous technological progress in treatment processes, and sustained demand from the energy sector are critical growth catalysts.
- Growth Potential: Emerging markets in regions such as Latin America and the Middle East are showing considerable promise, offering significant opportunities for expansion and investment in water treatment infrastructure.
Fracking Water Treatment Industry Product Landscape
The product landscape is characterized by a diverse range of technologies, including membrane filtration (reverse osmosis, ultrafiltration, nanofiltration), advanced oxidation processes, and biological treatment methods. These technologies are tailored to address the specific challenges posed by produced water, such as high salinity, organic contaminants, and radioactive materials. Recent innovations focus on improving efficiency, reducing energy consumption, and minimizing environmental impact. Unique selling propositions often revolve around the reduction of discharge volumes, the recovery of valuable resources (e.g., salts), and the overall sustainability of the treatment process.
Key Drivers, Barriers & Challenges in Fracking Water Treatment Industry
Key Drivers:
- Increased global demand for oil and gas, leading to expanded exploration and production activities.
- Evolving and increasingly stringent environmental regulations, coupled with substantial penalties for non-compliance, necessitating advanced water treatment solutions.
- Ongoing technological advancements that are yielding more efficient, reliable, and cost-effective water treatment methodologies, including advanced filtration, membrane technologies, and chemical treatments.
- Government initiatives, grants, and incentives aimed at promoting sustainable water management practices and the adoption of circular economy principles within the energy sector.
Challenges and Restraints:
- Significant upfront capital expenditure required for the construction of treatment facilities and the implementation of advanced treatment technologies.
- Volatility in global oil and gas prices can impact investment decisions and the pace of project development within the fracking industry, consequently affecting demand for water treatment services.
- Potential disruptions in supply chains for critical materials, chemicals, and specialized equipment, which can impact project timelines and operational continuity.
- Regulatory uncertainty, including the possibility of future changes in environmental policies and permitting requirements, can create operational and investment risks for companies.
- The high energy consumption of certain advanced treatment processes can be a challenge, especially in regions with high energy costs.
Emerging Opportunities in Fracking Water Treatment Industry
- Growing demand for zero-liquid-discharge (ZLD) systems.
- Development of innovative technologies for treating challenging produced water characteristics.
- Expansion into emerging oil and gas producing regions.
- Integration of digital technologies for improved monitoring and control.
Growth Accelerators in the Fracking Water Treatment Industry Industry
The long-term growth of the fracking water treatment market will be fueled by continued advancements in membrane technologies, the development of more energy-efficient treatment processes, and increased collaborations between water treatment companies and oil & gas producers. Strategic partnerships to develop innovative solutions and expand market reach will also play a vital role. Expanding into emerging markets and focusing on sustainable and environmentally friendly practices will further accelerate market growth.
Key Players Shaping the Fracking Water Treatment Market
- Filtra Systems
- Aquatech International LLC
- Ecologix Environmental Systems LLC
- DuPont
- Oasys Water
- Halliburton
- Schlumberger Limited
- Agua Dulce Technologies LLC
- Veolia Water Technologies
- Filtra Systems
Notable Milestones in Fracking Water Treatment Industry Sector
- 2021: Filtra Systems and Aquatech International announced a significant partnership to co-develop and commercialize a novel membrane filtration technology specifically engineered for the efficient treatment of produced water.
- 2022: Ecologix Environmental Systems successfully secured substantial government funding to accelerate research and development into innovative and sustainable water treatment solutions for the oil and gas industry.
- 2023: Halliburton introduced a cutting-edge automated water treatment system featuring advanced AI-powered monitoring and real-time control capabilities, enhancing operational efficiency and data analytics.
- 2024: Schlumberger Limited executed a strategic acquisition of a specialized water treatment company, thereby expanding its service offerings, technological capabilities, and overall market footprint.
- 2025: Several leading companies are investing heavily in pilot projects for Zero Liquid Discharge (ZLD) technologies, aiming to eliminate the need for wastewater disposal and maximize water recycling.
In-Depth Fracking Water Treatment Industry Market Outlook
The outlook for the fracking water treatment industry is exceptionally positive, poised for sustained growth driven by the escalating global emphasis on environmental sustainability, the continuous surge in technological innovation, and the projected expansion of the oil and gas sector. Strategic alliances, substantial investment in research and development (R&D), and a steadfast commitment to developing sustainable solutions will be the cornerstones of market leadership. Companies that proactively embrace and integrate advanced treatment technologies, demonstrate unwavering dedication to environmental responsibility, and offer comprehensive, end-to-end water management solutions will be exceptionally well-positioned to thrive and achieve long-term success in this highly dynamic and rapidly evolving global market.
Fracking Water Treatment Industry Segmentation
-
1. Application
- 1.1. Treatment & Recycle
- 1.2. Deep well Injection
Fracking Water Treatment Industry Segmentation By Geography
-
1. Asia Pacific
- 1.1. China
- 1.2. India
- 1.3. Japan
- 1.4. South Korea
- 1.5. Rest of Asia Pacific
-
2. North America
- 2.1. United States
- 2.2. Canada
- 2.3. Mexico
-
3. Europe
- 3.1. Germany
- 3.2. United Kingdom
- 3.3. France
- 3.4. Italy
- 3.5. Rest of Europe
-
4. South America
- 4.1. Brazil
- 4.2. Argentina
- 4.3. Rest of South America
-
5. Middle East and Africa
- 5.1. Saudi Arabia
- 5.2. South Africa
- 5.3. Rest of Middle East and Africa
Fracking Water Treatment Industry Regional Market Share
Geographic Coverage of Fracking Water Treatment Industry
Fracking Water Treatment Industry REPORT HIGHLIGHTS
| Aspects | Details |
|---|---|
| Study Period | 2020-2034 |
| Base Year | 2025 |
| Estimated Year | 2026 |
| Forecast Period | 2026-2034 |
| Historical Period | 2020-2025 |
| Growth Rate | CAGR of > 3.00% from 2020-2034 |
| Segmentation |
|
Table of Contents
- 1. Introduction
- 1.1. Research Scope
- 1.2. Market Segmentation
- 1.3. Research Objective
- 1.4. Definitions and Assumptions
- 2. Executive Summary
- 2.1. Market Snapshot
- 3. Market Dynamics
- 3.1. Market Drivers
- 3.2. Market Restrains
- 3.3. Market Trends
- 3.4. Market Opportunities
- 4. Market Factor Analysis
- 4.1. Porters Five Forces
- 4.1.1. Bargaining Power of Suppliers
- 4.1.2. Bargaining Power of Buyers
- 4.1.3. Threat of New Entrants
- 4.1.4. Threat of Substitutes
- 4.1.5. Competitive Rivalry
- 4.2. PESTEL analysis
- 4.3. BCG Analysis
- 4.3.1. Stars (High Growth, High Market Share)
- 4.3.2. Cash Cows (Low Growth, High Market Share)
- 4.3.3. Question Mark (High Growth, Low Market Share)
- 4.3.4. Dogs (Low Growth, Low Market Share)
- 4.4. Ansoff Matrix Analysis
- 4.5. Supply Chain Analysis
- 4.6. Regulatory Landscape
- 4.7. Current Market Potential and Opportunity Assessment (TAM–SAM–SOM Framework)
- 4.8. NRP Analyst Note
- 4.1. Porters Five Forces
- 5. Market Analysis, Insights and Forecast 2021-2033
- 5.1. Market Analysis, Insights and Forecast - by Application
- 5.1.1. Treatment & Recycle
- 5.1.2. Deep well Injection
- 5.2. Market Analysis, Insights and Forecast - by Region
- 5.2.1. Asia Pacific
- 5.2.2. North America
- 5.2.3. Europe
- 5.2.4. South America
- 5.2.5. Middle East and Africa
- 5.1. Market Analysis, Insights and Forecast - by Application
- 6. Global Fracking Water Treatment Industry Analysis, Insights and Forecast, 2021-2033
- 6.1. Market Analysis, Insights and Forecast - by Application
- 6.1.1. Treatment & Recycle
- 6.1.2. Deep well Injection
- 6.1. Market Analysis, Insights and Forecast - by Application
- 7. Asia Pacific Fracking Water Treatment Industry Analysis, Insights and Forecast, 2020-2032
- 7.1. Market Analysis, Insights and Forecast - by Application
- 7.1.1. Treatment & Recycle
- 7.1.2. Deep well Injection
- 7.1. Market Analysis, Insights and Forecast - by Application
- 8. North America Fracking Water Treatment Industry Analysis, Insights and Forecast, 2020-2032
- 8.1. Market Analysis, Insights and Forecast - by Application
- 8.1.1. Treatment & Recycle
- 8.1.2. Deep well Injection
- 8.1. Market Analysis, Insights and Forecast - by Application
- 9. Europe Fracking Water Treatment Industry Analysis, Insights and Forecast, 2020-2032
- 9.1. Market Analysis, Insights and Forecast - by Application
- 9.1.1. Treatment & Recycle
- 9.1.2. Deep well Injection
- 9.1. Market Analysis, Insights and Forecast - by Application
- 10. South America Fracking Water Treatment Industry Analysis, Insights and Forecast, 2020-2032
- 10.1. Market Analysis, Insights and Forecast - by Application
- 10.1.1. Treatment & Recycle
- 10.1.2. Deep well Injection
- 10.1. Market Analysis, Insights and Forecast - by Application
- 11. Middle East and Africa Fracking Water Treatment Industry Analysis, Insights and Forecast, 2020-2032
- 11.1. Market Analysis, Insights and Forecast - by Application
- 11.1.1. Treatment & Recycle
- 11.1.2. Deep well Injection
- 11.1. Market Analysis, Insights and Forecast - by Application
- 12. Competitive Analysis
- 12.1. Company Profiles
- 12.1.1 Filtra Systems
- 12.1.1.1. Company Overview
- 12.1.1.2. Products
- 12.1.1.3. Company Financials
- 12.1.1.4. SWOT Analysis
- 12.1.2 Aquatech International LLC
- 12.1.2.1. Company Overview
- 12.1.2.2. Products
- 12.1.2.3. Company Financials
- 12.1.2.4. SWOT Analysis
- 12.1.3 Ecologix Environmental Systems LLC
- 12.1.3.1. Company Overview
- 12.1.3.2. Products
- 12.1.3.3. Company Financials
- 12.1.3.4. SWOT Analysis
- 12.1.4 DuPont
- 12.1.4.1. Company Overview
- 12.1.4.2. Products
- 12.1.4.3. Company Financials
- 12.1.4.4. SWOT Analysis
- 12.1.5 Oasys Water
- 12.1.5.1. Company Overview
- 12.1.5.2. Products
- 12.1.5.3. Company Financials
- 12.1.5.4. SWOT Analysis
- 12.1.6 Halliburton
- 12.1.6.1. Company Overview
- 12.1.6.2. Products
- 12.1.6.3. Company Financials
- 12.1.6.4. SWOT Analysis
- 12.1.7 Schlumberger Limited
- 12.1.7.1. Company Overview
- 12.1.7.2. Products
- 12.1.7.3. Company Financials
- 12.1.7.4. SWOT Analysis
- 12.1.8 Agua Dulce Technologies LLC
- 12.1.8.1. Company Overview
- 12.1.8.2. Products
- 12.1.8.3. Company Financials
- 12.1.8.4. SWOT Analysis
- 12.1.9 Veolia Water Technologies*List Not Exhaustive
- 12.1.9.1. Company Overview
- 12.1.9.2. Products
- 12.1.9.3. Company Financials
- 12.1.9.4. SWOT Analysis
- 12.1.10 Filtra Systems
- 12.1.10.1. Company Overview
- 12.1.10.2. Products
- 12.1.10.3. Company Financials
- 12.1.10.4. SWOT Analysis
- 12.1.1 Filtra Systems
- 12.2. Market Entropy
- 12.2.1 Company's Key Areas Served
- 12.2.2 Recent Developments
- 12.3. Company Market Share Analysis 2025
- 12.3.1 Top 5 Companies Market Share Analysis
- 12.3.2 Top 3 Companies Market Share Analysis
- 12.4. List of Potential Customers
- 13. Research Methodology
List of Figures
- Figure 1: Global Fracking Water Treatment Industry Revenue Breakdown (Million, %) by Region 2025 & 2033
- Figure 2: Global Fracking Water Treatment Industry Volume Breakdown (liter , %) by Region 2025 & 2033
- Figure 3: Asia Pacific Fracking Water Treatment Industry Revenue (Million), by Application 2025 & 2033
- Figure 4: Asia Pacific Fracking Water Treatment Industry Volume (liter ), by Application 2025 & 2033
- Figure 5: Asia Pacific Fracking Water Treatment Industry Revenue Share (%), by Application 2025 & 2033
- Figure 6: Asia Pacific Fracking Water Treatment Industry Volume Share (%), by Application 2025 & 2033
- Figure 7: Asia Pacific Fracking Water Treatment Industry Revenue (Million), by Country 2025 & 2033
- Figure 8: Asia Pacific Fracking Water Treatment Industry Volume (liter ), by Country 2025 & 2033
- Figure 9: Asia Pacific Fracking Water Treatment Industry Revenue Share (%), by Country 2025 & 2033
- Figure 10: Asia Pacific Fracking Water Treatment Industry Volume Share (%), by Country 2025 & 2033
- Figure 11: North America Fracking Water Treatment Industry Revenue (Million), by Application 2025 & 2033
- Figure 12: North America Fracking Water Treatment Industry Volume (liter ), by Application 2025 & 2033
- Figure 13: North America Fracking Water Treatment Industry Revenue Share (%), by Application 2025 & 2033
- Figure 14: North America Fracking Water Treatment Industry Volume Share (%), by Application 2025 & 2033
- Figure 15: North America Fracking Water Treatment Industry Revenue (Million), by Country 2025 & 2033
- Figure 16: North America Fracking Water Treatment Industry Volume (liter ), by Country 2025 & 2033
- Figure 17: North America Fracking Water Treatment Industry Revenue Share (%), by Country 2025 & 2033
- Figure 18: North America Fracking Water Treatment Industry Volume Share (%), by Country 2025 & 2033
- Figure 19: Europe Fracking Water Treatment Industry Revenue (Million), by Application 2025 & 2033
- Figure 20: Europe Fracking Water Treatment Industry Volume (liter ), by Application 2025 & 2033
- Figure 21: Europe Fracking Water Treatment Industry Revenue Share (%), by Application 2025 & 2033
- Figure 22: Europe Fracking Water Treatment Industry Volume Share (%), by Application 2025 & 2033
- Figure 23: Europe Fracking Water Treatment Industry Revenue (Million), by Country 2025 & 2033
- Figure 24: Europe Fracking Water Treatment Industry Volume (liter ), by Country 2025 & 2033
- Figure 25: Europe Fracking Water Treatment Industry Revenue Share (%), by Country 2025 & 2033
- Figure 26: Europe Fracking Water Treatment Industry Volume Share (%), by Country 2025 & 2033
- Figure 27: South America Fracking Water Treatment Industry Revenue (Million), by Application 2025 & 2033
- Figure 28: South America Fracking Water Treatment Industry Volume (liter ), by Application 2025 & 2033
- Figure 29: South America Fracking Water Treatment Industry Revenue Share (%), by Application 2025 & 2033
- Figure 30: South America Fracking Water Treatment Industry Volume Share (%), by Application 2025 & 2033
- Figure 31: South America Fracking Water Treatment Industry Revenue (Million), by Country 2025 & 2033
- Figure 32: South America Fracking Water Treatment Industry Volume (liter ), by Country 2025 & 2033
- Figure 33: South America Fracking Water Treatment Industry Revenue Share (%), by Country 2025 & 2033
- Figure 34: South America Fracking Water Treatment Industry Volume Share (%), by Country 2025 & 2033
- Figure 35: Middle East and Africa Fracking Water Treatment Industry Revenue (Million), by Application 2025 & 2033
- Figure 36: Middle East and Africa Fracking Water Treatment Industry Volume (liter ), by Application 2025 & 2033
- Figure 37: Middle East and Africa Fracking Water Treatment Industry Revenue Share (%), by Application 2025 & 2033
- Figure 38: Middle East and Africa Fracking Water Treatment Industry Volume Share (%), by Application 2025 & 2033
- Figure 39: Middle East and Africa Fracking Water Treatment Industry Revenue (Million), by Country 2025 & 2033
- Figure 40: Middle East and Africa Fracking Water Treatment Industry Volume (liter ), by Country 2025 & 2033
- Figure 41: Middle East and Africa Fracking Water Treatment Industry Revenue Share (%), by Country 2025 & 2033
- Figure 42: Middle East and Africa Fracking Water Treatment Industry Volume Share (%), by Country 2025 & 2033
List of Tables
- Table 1: Global Fracking Water Treatment Industry Revenue Million Forecast, by Application 2020 & 2033
- Table 2: Global Fracking Water Treatment Industry Volume liter Forecast, by Application 2020 & 2033
- Table 3: Global Fracking Water Treatment Industry Revenue Million Forecast, by Region 2020 & 2033
- Table 4: Global Fracking Water Treatment Industry Volume liter Forecast, by Region 2020 & 2033
- Table 5: Global Fracking Water Treatment Industry Revenue Million Forecast, by Application 2020 & 2033
- Table 6: Global Fracking Water Treatment Industry Volume liter Forecast, by Application 2020 & 2033
- Table 7: Global Fracking Water Treatment Industry Revenue Million Forecast, by Country 2020 & 2033
- Table 8: Global Fracking Water Treatment Industry Volume liter Forecast, by Country 2020 & 2033
- Table 9: China Fracking Water Treatment Industry Revenue (Million) Forecast, by Application 2020 & 2033
- Table 10: China Fracking Water Treatment Industry Volume (liter ) Forecast, by Application 2020 & 2033
- Table 11: India Fracking Water Treatment Industry Revenue (Million) Forecast, by Application 2020 & 2033
- Table 12: India Fracking Water Treatment Industry Volume (liter ) Forecast, by Application 2020 & 2033
- Table 13: Japan Fracking Water Treatment Industry Revenue (Million) Forecast, by Application 2020 & 2033
- Table 14: Japan Fracking Water Treatment Industry Volume (liter ) Forecast, by Application 2020 & 2033
- Table 15: South Korea Fracking Water Treatment Industry Revenue (Million) Forecast, by Application 2020 & 2033
- Table 16: South Korea Fracking Water Treatment Industry Volume (liter ) Forecast, by Application 2020 & 2033
- Table 17: Rest of Asia Pacific Fracking Water Treatment Industry Revenue (Million) Forecast, by Application 2020 & 2033
- Table 18: Rest of Asia Pacific Fracking Water Treatment Industry Volume (liter ) Forecast, by Application 2020 & 2033
- Table 19: Global Fracking Water Treatment Industry Revenue Million Forecast, by Application 2020 & 2033
- Table 20: Global Fracking Water Treatment Industry Volume liter Forecast, by Application 2020 & 2033
- Table 21: Global Fracking Water Treatment Industry Revenue Million Forecast, by Country 2020 & 2033
- Table 22: Global Fracking Water Treatment Industry Volume liter Forecast, by Country 2020 & 2033
- Table 23: United States Fracking Water Treatment Industry Revenue (Million) Forecast, by Application 2020 & 2033
- Table 24: United States Fracking Water Treatment Industry Volume (liter ) Forecast, by Application 2020 & 2033
- Table 25: Canada Fracking Water Treatment Industry Revenue (Million) Forecast, by Application 2020 & 2033
- Table 26: Canada Fracking Water Treatment Industry Volume (liter ) Forecast, by Application 2020 & 2033
- Table 27: Mexico Fracking Water Treatment Industry Revenue (Million) Forecast, by Application 2020 & 2033
- Table 28: Mexico Fracking Water Treatment Industry Volume (liter ) Forecast, by Application 2020 & 2033
- Table 29: Global Fracking Water Treatment Industry Revenue Million Forecast, by Application 2020 & 2033
- Table 30: Global Fracking Water Treatment Industry Volume liter Forecast, by Application 2020 & 2033
- Table 31: Global Fracking Water Treatment Industry Revenue Million Forecast, by Country 2020 & 2033
- Table 32: Global Fracking Water Treatment Industry Volume liter Forecast, by Country 2020 & 2033
- Table 33: Germany Fracking Water Treatment Industry Revenue (Million) Forecast, by Application 2020 & 2033
- Table 34: Germany Fracking Water Treatment Industry Volume (liter ) Forecast, by Application 2020 & 2033
- Table 35: United Kingdom Fracking Water Treatment Industry Revenue (Million) Forecast, by Application 2020 & 2033
- Table 36: United Kingdom Fracking Water Treatment Industry Volume (liter ) Forecast, by Application 2020 & 2033
- Table 37: France Fracking Water Treatment Industry Revenue (Million) Forecast, by Application 2020 & 2033
- Table 38: France Fracking Water Treatment Industry Volume (liter ) Forecast, by Application 2020 & 2033
- Table 39: Italy Fracking Water Treatment Industry Revenue (Million) Forecast, by Application 2020 & 2033
- Table 40: Italy Fracking Water Treatment Industry Volume (liter ) Forecast, by Application 2020 & 2033
- Table 41: Rest of Europe Fracking Water Treatment Industry Revenue (Million) Forecast, by Application 2020 & 2033
- Table 42: Rest of Europe Fracking Water Treatment Industry Volume (liter ) Forecast, by Application 2020 & 2033
- Table 43: Global Fracking Water Treatment Industry Revenue Million Forecast, by Application 2020 & 2033
- Table 44: Global Fracking Water Treatment Industry Volume liter Forecast, by Application 2020 & 2033
- Table 45: Global Fracking Water Treatment Industry Revenue Million Forecast, by Country 2020 & 2033
- Table 46: Global Fracking Water Treatment Industry Volume liter Forecast, by Country 2020 & 2033
- Table 47: Brazil Fracking Water Treatment Industry Revenue (Million) Forecast, by Application 2020 & 2033
- Table 48: Brazil Fracking Water Treatment Industry Volume (liter ) Forecast, by Application 2020 & 2033
- Table 49: Argentina Fracking Water Treatment Industry Revenue (Million) Forecast, by Application 2020 & 2033
- Table 50: Argentina Fracking Water Treatment Industry Volume (liter ) Forecast, by Application 2020 & 2033
- Table 51: Rest of South America Fracking Water Treatment Industry Revenue (Million) Forecast, by Application 2020 & 2033
- Table 52: Rest of South America Fracking Water Treatment Industry Volume (liter ) Forecast, by Application 2020 & 2033
- Table 53: Global Fracking Water Treatment Industry Revenue Million Forecast, by Application 2020 & 2033
- Table 54: Global Fracking Water Treatment Industry Volume liter Forecast, by Application 2020 & 2033
- Table 55: Global Fracking Water Treatment Industry Revenue Million Forecast, by Country 2020 & 2033
- Table 56: Global Fracking Water Treatment Industry Volume liter Forecast, by Country 2020 & 2033
- Table 57: Saudi Arabia Fracking Water Treatment Industry Revenue (Million) Forecast, by Application 2020 & 2033
- Table 58: Saudi Arabia Fracking Water Treatment Industry Volume (liter ) Forecast, by Application 2020 & 2033
- Table 59: South Africa Fracking Water Treatment Industry Revenue (Million) Forecast, by Application 2020 & 2033
- Table 60: South Africa Fracking Water Treatment Industry Volume (liter ) Forecast, by Application 2020 & 2033
- Table 61: Rest of Middle East and Africa Fracking Water Treatment Industry Revenue (Million) Forecast, by Application 2020 & 2033
- Table 62: Rest of Middle East and Africa Fracking Water Treatment Industry Volume (liter ) Forecast, by Application 2020 & 2033
Frequently Asked Questions
1. What is the projected Compound Annual Growth Rate (CAGR) of the Fracking Water Treatment Industry?
The projected CAGR is approximately > 3.00%.
2. Which companies are prominent players in the Fracking Water Treatment Industry?
Key companies in the market include Filtra Systems, Aquatech International LLC, Ecologix Environmental Systems LLC, DuPont, Oasys Water, Halliburton, Schlumberger Limited, Agua Dulce Technologies LLC, Veolia Water Technologies*List Not Exhaustive, Filtra Systems.
3. What are the main segments of the Fracking Water Treatment Industry?
The market segments include Application.
4. Can you provide details about the market size?
The market size is estimated to be USD 5700 Million as of 2022.
5. What are some drivers contributing to market growth?
; High Demand from Treatment & Recycle Segment; Stringent Government Regulations.
6. What are the notable trends driving market growth?
High Demand from Treatment & Recycle Segment.
7. Are there any restraints impacting market growth?
; Outbreak of COVID-19; Other Restraints.
8. Can you provide examples of recent developments in the market?
Partnerships between industry players to develop innovative technologies
9. What pricing options are available for accessing the report?
Pricing options include single-user, multi-user, and enterprise licenses priced at USD 4750, USD 5250, and USD 8750 respectively.
10. Is the market size provided in terms of value or volume?
The market size is provided in terms of value, measured in Million and volume, measured in liter .
11. Are there any specific market keywords associated with the report?
Yes, the market keyword associated with the report is "Fracking Water Treatment Industry," which aids in identifying and referencing the specific market segment covered.
12. How do I determine which pricing option suits my needs best?
The pricing options vary based on user requirements and access needs. Individual users may opt for single-user licenses, while businesses requiring broader access may choose multi-user or enterprise licenses for cost-effective access to the report.
13. Are there any additional resources or data provided in the Fracking Water Treatment Industry report?
While the report offers comprehensive insights, it's advisable to review the specific contents or supplementary materials provided to ascertain if additional resources or data are available.
14. How can I stay updated on further developments or reports in the Fracking Water Treatment Industry?
To stay informed about further developments, trends, and reports in the Fracking Water Treatment Industry, consider subscribing to industry newsletters, following relevant companies and organizations, or regularly checking reputable industry news sources and publications.
Methodology
Step 1 - Identification of Relevant Samples Size from Population Database


Step 2 - Approaches for Defining Global Market Size (Value, Volume* & Price*)

Note*: In applicable scenarios
Step 3 - Data Sources
Primary Research
- Web Analytics
- Survey Reports
- Research Institute
- Latest Research Reports
- Opinion Leaders
Secondary Research
- Annual Reports
- White Paper
- Latest Press Release
- Industry Association
- Paid Database
- Investor Presentations

Step 4 - Data Triangulation
Involves using different sources of information in order to increase the validity of a study
These sources are likely to be stakeholders in a program - participants, other researchers, program staff, other community members, and so on.
Then we put all data in single framework & apply various statistical tools to find out the dynamic on the market.
During the analysis stage, feedback from the stakeholder groups would be compared to determine areas of agreement as well as areas of divergence