

Key Insights
The global graphite electrode market, currently valued at $4.48 billion, is projected for robust expansion, exhibiting a Compound Annual Growth Rate (CAGR) of 6.48% from 2025 to 2033. This growth is underpinned by escalating steel demand, where graphite electrodes are integral to Electric Arc Furnace (EAF) operations. The international pivot towards sustainable steel manufacturing, prioritizing EAFs over traditional blast furnaces, is a significant market driver. Innovations enhancing electrode performance, including improved durability and reduced consumption, further stimulate industry growth. Nevertheless, market expansion faces headwinds from volatile raw material costs and potential supply chain vulnerabilities. The market is segmented by electrode type (e.g., high-power, ultra-high-power), application (e.g., steelmaking, aluminum smelting), and geography. Leading entities such as EL6 LLC, Fangda Carbon, and GrafTech International are engaged in fierce competition, emphasizing innovation and geographical expansion to fortify market positions.
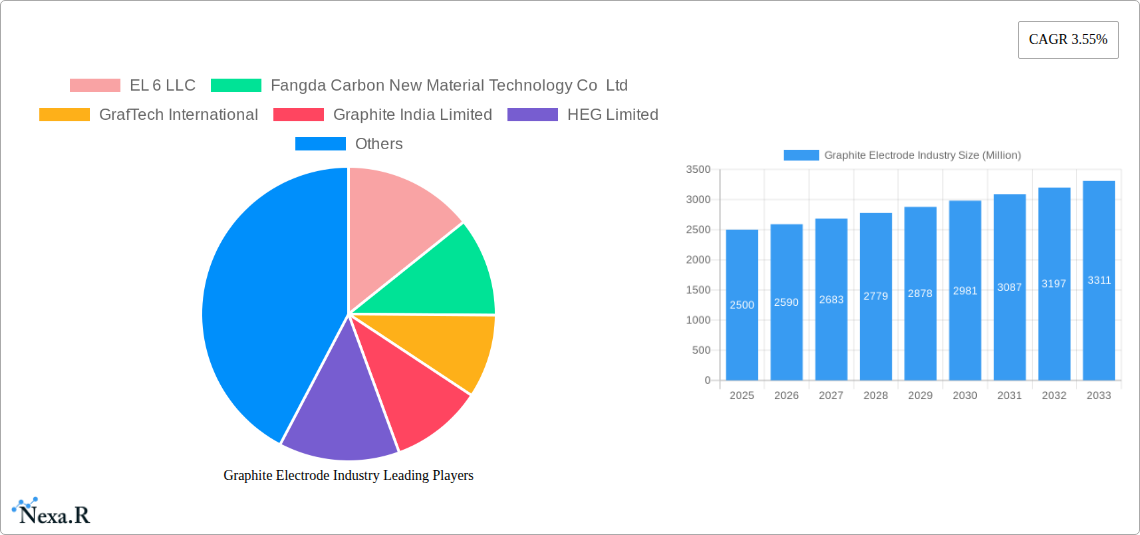
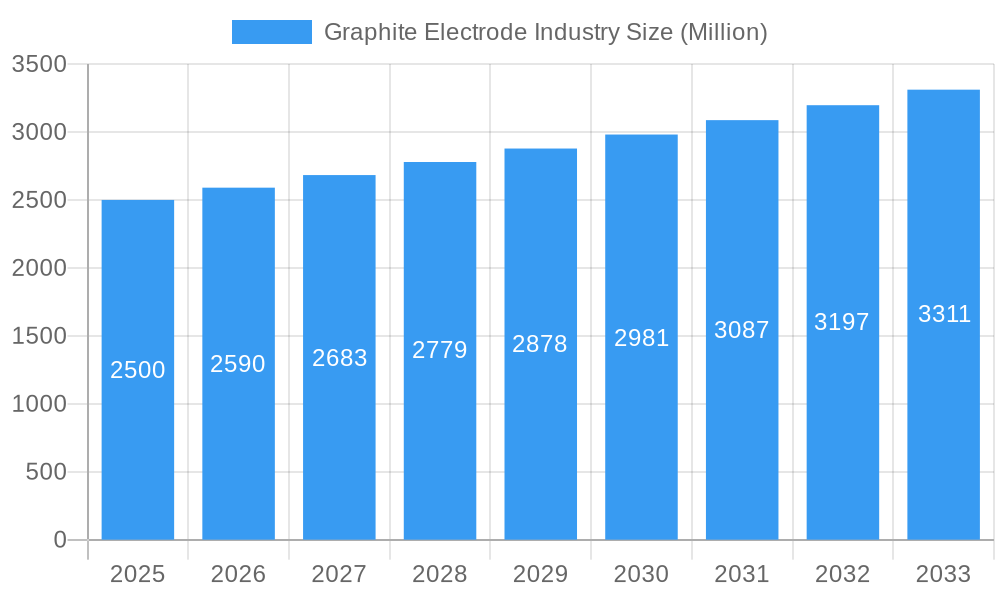
Graphite Electrode Industry Market Size (In Billion)
The forecast period (2025-2033) anticipates sustained market expansion, contingent upon macroeconomic stability and evolving industry trends. The competitive environment remains dynamic, with key players pursuing strategic alliances, mergers, acquisitions, and technological advancements to maintain a competitive edge. Regional growth trajectories will vary, influenced by steel production capacities, regulatory landscapes, and economic development. A comprehensive understanding of these dynamics is essential for market participants and prospective entrants. Industry stakeholders are increasingly channeling investments into research and development for advanced graphite electrode technologies, promising superior performance and efficiency, thereby solidifying the market's long-term outlook.
Graphite Electrode Industry Company Market Share
Graphite Electrode Industry Market Report: 2019-2033
This comprehensive report provides a detailed analysis of the Graphite Electrode industry, encompassing market dynamics, growth trends, regional segmentation, product landscape, key players, and future outlook. The study period covers 2019-2033, with 2025 as the base and estimated year. The forecast period spans 2025-2033, and the historical period encompasses 2019-2024. This report is a crucial resource for industry professionals, investors, and stakeholders seeking in-depth insights into this vital sector. Parent market: Carbon Materials; Child Market: Graphite Electrodes.
Graphite Electrode Industry Market Dynamics & Structure
The graphite electrode market is characterized by moderate concentration, with several major players holding significant market share. Technological innovation, particularly in improving electrode performance and durability, is a key driver. Stringent environmental regulations regarding emissions and waste management present significant challenges. Competitive pressures from substitute materials, such as alternative electrode technologies, are also notable. End-users are primarily steel producers, with market demand closely tied to global steel production volumes. The industry has witnessed several mergers and acquisitions (M&A) in recent years, reflecting consolidation trends.
- Market Concentration: Oligopolistic, with top 5 players holding xx% market share (2024).
- Technological Innovation: Focus on increasing conductivity, reducing consumption, and enhancing durability.
- Regulatory Framework: Stringent environmental regulations impacting production costs and processes.
- Competitive Substitutes: Alternative electrode materials and technologies pose a threat.
- End-User Demographics: Primarily steel mills and other metallurgical industries.
- M&A Activity: xx deals recorded between 2019-2024, valued at approximately xx million USD.
Graphite Electrode Industry Growth Trends & Insights
The global graphite electrode market is projected to witness robust growth during the forecast period (2025-2033). Driven by increasing steel production, particularly in developing economies, the market size is estimated at xx million units in 2025, expected to reach xx million units by 2033, exhibiting a CAGR of xx%. This growth is further fueled by technological advancements resulting in higher efficiency and improved product performance. Shifting consumer preferences toward sustainable and high-performance materials contribute to market expansion. Increased adoption rates in emerging applications, such as lithium-ion batteries, also contribute significantly.
Dominant Regions, Countries, or Segments in Graphite Electrode Industry
China currently dominates the graphite electrode market, accounting for xx% of global production in 2024. This dominance stems from several factors, including a large and rapidly growing steel industry, robust government support for the carbon materials sector, and a well-established manufacturing base. Other key regions include Japan, India, and the United States, each exhibiting unique market dynamics influenced by factors like local steel production, economic policies, and technological advancements.
- Key Drivers in China: Large steel production capacity, supportive government policies, and cost-competitive manufacturing.
- Other Key Regions: Japan (advanced technology), India (growing steel production), USA (specialized applications).
- Market Share: China (xx%), Japan (xx%), India (xx%), USA (xx%), Other (xx%).
Graphite Electrode Industry Product Landscape
Graphite electrodes are primarily categorized by their size and grade, influencing their performance in different applications. Recent innovations focus on enhancing conductivity, thermal stability, and wear resistance through advanced manufacturing processes and material formulations. Unique selling propositions include superior strength, extended lifespan, and improved energy efficiency, delivering cost savings for end-users. Technological advancements such as the use of high-purity graphite and optimized microstructure design are driving further performance improvements.
Key Drivers, Barriers & Challenges in Graphite Electrode Industry
Key Drivers:
- Growing global steel production.
- Technological advancements enhancing electrode performance.
- Increasing demand for high-quality graphite electrodes in specialized applications.
- Government initiatives promoting sustainable manufacturing practices.
Key Challenges:
- Fluctuations in raw material prices (petroleum coke).
- Stringent environmental regulations impacting production costs.
- Intense competition from established and emerging players.
- Supply chain disruptions causing production delays and price volatility. This led to a xx% increase in prices in 2022.
Emerging Opportunities in Graphite Electrode Industry
- Expansion into new applications, including lithium-ion batteries and other advanced energy storage systems.
- Development of high-performance graphite electrodes for specialized industries (e.g., aerospace).
- Growth in developing economies with increasing demand for steel and infrastructure development.
- Adoption of sustainable manufacturing practices to enhance environmental performance and meet regulatory requirements.
Growth Accelerators in the Graphite Electrode Industry
Technological innovation will play a crucial role in driving long-term growth. Strategic partnerships between graphite producers and downstream users will enhance efficiency and optimize the supply chain. Market expansion into high-growth regions, coupled with product diversification, will further fuel the industry's expansion.
Key Players Shaping the Graphite Electrode Industry Market
- EL 6 LLC
- Fangda Carbon New Material Technology Co Ltd
- GrafTech International
- Graphite India Limited
- HEG Limited
- Kaifeng Pingmei New Carbon Materials Technology Co Ltd
- Liaoning Dantan Technology Group Co Ltd (Dan Carbon)
- Nantong Yangzi Carbon Co Ltd
- Nippon Carbon Co Ltd
- Sangraf International Inc
- SEC Carbon Limited
- Resonac Holdings Corporation
- Tokai Carbon Co Ltd
- Zhongze Group
Notable Milestones in Graphite Electrode Industry Sector
- January 2023: Showa Denko K.K. (SDK) and Showa Denko Materials Co. Ltd. merged to form Resonac Holdings Corporation, significantly impacting the market through streamlined operations and supply chain optimization in the graphite electrode sector.
In-Depth Graphite Electrode Industry Market Outlook
The graphite electrode market is poised for continued expansion, driven by technological advancements, strategic partnerships, and increasing demand from key industries. The focus on sustainability and enhanced product performance will shape future market dynamics, presenting significant opportunities for companies to innovate and capture market share. The development of new applications, particularly in advanced energy storage, represents a significant growth driver in the coming years.
Graphite Electrode Industry Segmentation
-
1. Electrode Grade
- 1.1. Ultra High Power (UHP)
- 1.2. High Power (SHP)
- 1.3. Regular Power (RP)
-
2. Application
- 2.1. Electric Arc Furnace
- 2.2. Basic Oxygen Furnace
- 2.3. Non-steel Application
Graphite Electrode Industry Segmentation By Geography
-
1. Asia Pacific
- 1.1. China
- 1.2. India
- 1.3. Japan
- 1.4. South Korea
- 1.5. Malaysia
- 1.6. Thailand
- 1.7. Indonesia
- 1.8. Vietnam
- 1.9. Rest of Asia Pacific
-
2. North America
- 2.1. United States
- 2.2. Canada
- 2.3. Mexico
-
3. Europe
- 3.1. Germany
- 3.2. United Kingdom
- 3.3. France
- 3.4. Italy
- 3.5. Spain
- 3.6. Nordic Countries
- 3.7. Turkey
- 3.8. Russia
- 3.9. Rest of Europe
-
4. South America
- 4.1. Brazil
- 4.2. Argentina
- 4.3. Colombia
- 4.4. Rest of South America
-
5. Middle East and Africa
- 5.1. Saudi Arabia
- 5.2. Qatar
- 5.3. United Arab Emirates
- 5.4. Egypt
- 5.5. South Africa
- 5.6. Rest of Middle East and Africa
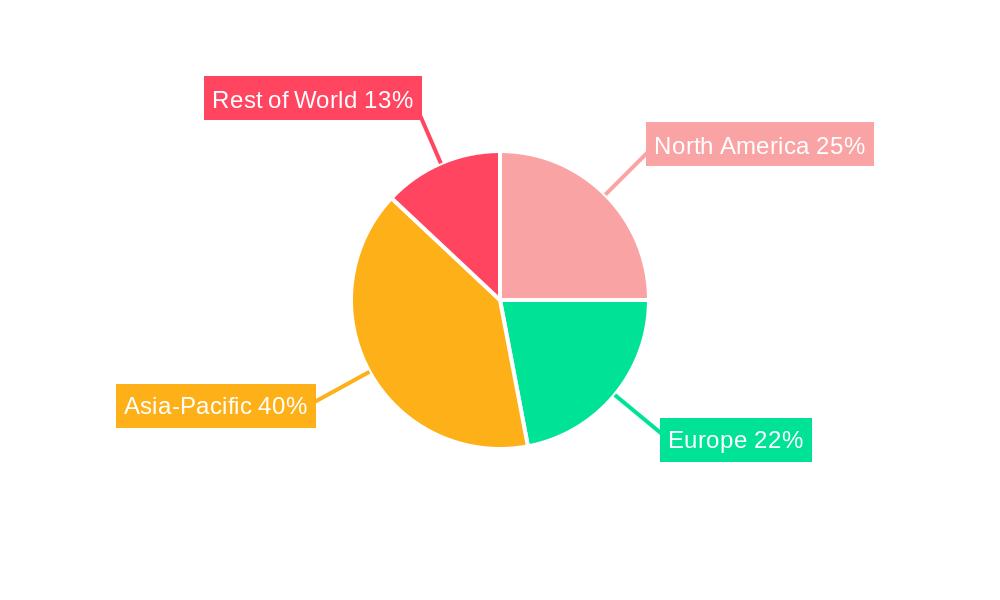
Graphite Electrode Industry Regional Market Share
Geographic Coverage of Graphite Electrode Industry
Graphite Electrode Industry REPORT HIGHLIGHTS
| Aspects | Details |
|---|---|
| Study Period | 2020-2034 |
| Base Year | 2025 |
| Estimated Year | 2026 |
| Forecast Period | 2026-2034 |
| Historical Period | 2020-2025 |
| Growth Rate | CAGR of 6.48% from 2020-2034 |
| Segmentation |
|
Table of Contents
- 1. Introduction
- 1.1. Research Scope
- 1.2. Market Segmentation
- 1.3. Research Objective
- 1.4. Definitions and Assumptions
- 2. Executive Summary
- 2.1. Market Snapshot
- 3. Market Dynamics
- 3.1. Market Drivers
- 3.2. Market Restrains
- 3.3. Market Trends
- 3.4. Market Opportunities
- 4. Market Factor Analysis
- 4.1. Porters Five Forces
- 4.1.1. Bargaining Power of Suppliers
- 4.1.2. Bargaining Power of Buyers
- 4.1.3. Threat of New Entrants
- 4.1.4. Threat of Substitutes
- 4.1.5. Competitive Rivalry
- 4.2. PESTEL analysis
- 4.3. BCG Analysis
- 4.3.1. Stars (High Growth, High Market Share)
- 4.3.2. Cash Cows (Low Growth, High Market Share)
- 4.3.3. Question Mark (High Growth, Low Market Share)
- 4.3.4. Dogs (Low Growth, Low Market Share)
- 4.4. Ansoff Matrix Analysis
- 4.5. Supply Chain Analysis
- 4.6. Regulatory Landscape
- 4.7. Current Market Potential and Opportunity Assessment (TAM–SAM–SOM Framework)
- 4.8. NRP Analyst Note
- 4.1. Porters Five Forces
- 5. Market Analysis, Insights and Forecast 2021-2033
- 5.1. Market Analysis, Insights and Forecast - by Electrode Grade
- 5.1.1. Ultra High Power (UHP)
- 5.1.2. High Power (SHP)
- 5.1.3. Regular Power (RP)
- 5.2. Market Analysis, Insights and Forecast - by Application
- 5.2.1. Electric Arc Furnace
- 5.2.2. Basic Oxygen Furnace
- 5.2.3. Non-steel Application
- 5.3. Market Analysis, Insights and Forecast - by Region
- 5.3.1. Asia Pacific
- 5.3.2. North America
- 5.3.3. Europe
- 5.3.4. South America
- 5.3.5. Middle East and Africa
- 5.1. Market Analysis, Insights and Forecast - by Electrode Grade
- 6. Global Graphite Electrode Industry Analysis, Insights and Forecast, 2021-2033
- 6.1. Market Analysis, Insights and Forecast - by Electrode Grade
- 6.1.1. Ultra High Power (UHP)
- 6.1.2. High Power (SHP)
- 6.1.3. Regular Power (RP)
- 6.2. Market Analysis, Insights and Forecast - by Application
- 6.2.1. Electric Arc Furnace
- 6.2.2. Basic Oxygen Furnace
- 6.2.3. Non-steel Application
- 6.1. Market Analysis, Insights and Forecast - by Electrode Grade
- 7. Asia Pacific Graphite Electrode Industry Analysis, Insights and Forecast, 2020-2032
- 7.1. Market Analysis, Insights and Forecast - by Electrode Grade
- 7.1.1. Ultra High Power (UHP)
- 7.1.2. High Power (SHP)
- 7.1.3. Regular Power (RP)
- 7.2. Market Analysis, Insights and Forecast - by Application
- 7.2.1. Electric Arc Furnace
- 7.2.2. Basic Oxygen Furnace
- 7.2.3. Non-steel Application
- 7.1. Market Analysis, Insights and Forecast - by Electrode Grade
- 8. North America Graphite Electrode Industry Analysis, Insights and Forecast, 2020-2032
- 8.1. Market Analysis, Insights and Forecast - by Electrode Grade
- 8.1.1. Ultra High Power (UHP)
- 8.1.2. High Power (SHP)
- 8.1.3. Regular Power (RP)
- 8.2. Market Analysis, Insights and Forecast - by Application
- 8.2.1. Electric Arc Furnace
- 8.2.2. Basic Oxygen Furnace
- 8.2.3. Non-steel Application
- 8.1. Market Analysis, Insights and Forecast - by Electrode Grade
- 9. Europe Graphite Electrode Industry Analysis, Insights and Forecast, 2020-2032
- 9.1. Market Analysis, Insights and Forecast - by Electrode Grade
- 9.1.1. Ultra High Power (UHP)
- 9.1.2. High Power (SHP)
- 9.1.3. Regular Power (RP)
- 9.2. Market Analysis, Insights and Forecast - by Application
- 9.2.1. Electric Arc Furnace
- 9.2.2. Basic Oxygen Furnace
- 9.2.3. Non-steel Application
- 9.1. Market Analysis, Insights and Forecast - by Electrode Grade
- 10. South America Graphite Electrode Industry Analysis, Insights and Forecast, 2020-2032
- 10.1. Market Analysis, Insights and Forecast - by Electrode Grade
- 10.1.1. Ultra High Power (UHP)
- 10.1.2. High Power (SHP)
- 10.1.3. Regular Power (RP)
- 10.2. Market Analysis, Insights and Forecast - by Application
- 10.2.1. Electric Arc Furnace
- 10.2.2. Basic Oxygen Furnace
- 10.2.3. Non-steel Application
- 10.1. Market Analysis, Insights and Forecast - by Electrode Grade
- 11. Middle East and Africa Graphite Electrode Industry Analysis, Insights and Forecast, 2020-2032
- 11.1. Market Analysis, Insights and Forecast - by Electrode Grade
- 11.1.1. Ultra High Power (UHP)
- 11.1.2. High Power (SHP)
- 11.1.3. Regular Power (RP)
- 11.2. Market Analysis, Insights and Forecast - by Application
- 11.2.1. Electric Arc Furnace
- 11.2.2. Basic Oxygen Furnace
- 11.2.3. Non-steel Application
- 11.1. Market Analysis, Insights and Forecast - by Electrode Grade
- 12. Competitive Analysis
- 12.1. Company Profiles
- 12.1.1 EL 6 LLC
- 12.1.1.1. Company Overview
- 12.1.1.2. Products
- 12.1.1.3. Company Financials
- 12.1.1.4. SWOT Analysis
- 12.1.2 Fangda Carbon New Material Technology Co Ltd
- 12.1.2.1. Company Overview
- 12.1.2.2. Products
- 12.1.2.3. Company Financials
- 12.1.2.4. SWOT Analysis
- 12.1.3 GrafTech International
- 12.1.3.1. Company Overview
- 12.1.3.2. Products
- 12.1.3.3. Company Financials
- 12.1.3.4. SWOT Analysis
- 12.1.4 Graphite India Limited
- 12.1.4.1. Company Overview
- 12.1.4.2. Products
- 12.1.4.3. Company Financials
- 12.1.4.4. SWOT Analysis
- 12.1.5 HEG Limited
- 12.1.5.1. Company Overview
- 12.1.5.2. Products
- 12.1.5.3. Company Financials
- 12.1.5.4. SWOT Analysis
- 12.1.6 Kaifeng Pingmei New Carbon Materials Technology Co Ltd
- 12.1.6.1. Company Overview
- 12.1.6.2. Products
- 12.1.6.3. Company Financials
- 12.1.6.4. SWOT Analysis
- 12.1.7 Liaoning Dantan Technology Group Co Ltd (Dan Carbon)
- 12.1.7.1. Company Overview
- 12.1.7.2. Products
- 12.1.7.3. Company Financials
- 12.1.7.4. SWOT Analysis
- 12.1.8 Nantong Yangzi Carbon Co Ltd
- 12.1.8.1. Company Overview
- 12.1.8.2. Products
- 12.1.8.3. Company Financials
- 12.1.8.4. SWOT Analysis
- 12.1.9 Nippon Carbon Co Ltd
- 12.1.9.1. Company Overview
- 12.1.9.2. Products
- 12.1.9.3. Company Financials
- 12.1.9.4. SWOT Analysis
- 12.1.10 Sangraf International Inc
- 12.1.10.1. Company Overview
- 12.1.10.2. Products
- 12.1.10.3. Company Financials
- 12.1.10.4. SWOT Analysis
- 12.1.11 SEC Carbon Limited
- 12.1.11.1. Company Overview
- 12.1.11.2. Products
- 12.1.11.3. Company Financials
- 12.1.11.4. SWOT Analysis
- 12.1.12 Resonac Holdings Corporation
- 12.1.12.1. Company Overview
- 12.1.12.2. Products
- 12.1.12.3. Company Financials
- 12.1.12.4. SWOT Analysis
- 12.1.13 Tokai Carbon Co Ltd
- 12.1.13.1. Company Overview
- 12.1.13.2. Products
- 12.1.13.3. Company Financials
- 12.1.13.4. SWOT Analysis
- 12.1.14 Zhongze Group*List Not Exhaustive
- 12.1.14.1. Company Overview
- 12.1.14.2. Products
- 12.1.14.3. Company Financials
- 12.1.14.4. SWOT Analysis
- 12.1.1 EL 6 LLC
- 12.2. Market Entropy
- 12.2.1 Company's Key Areas Served
- 12.2.2 Recent Developments
- 12.3. Company Market Share Analysis 2025
- 12.3.1 Top 5 Companies Market Share Analysis
- 12.3.2 Top 3 Companies Market Share Analysis
- 12.4. List of Potential Customers
- 13. Research Methodology
List of Figures
- Figure 1: Global Graphite Electrode Industry Revenue Breakdown (billion, %) by Region 2025 & 2033
- Figure 2: Asia Pacific Graphite Electrode Industry Revenue (billion), by Electrode Grade 2025 & 2033
- Figure 3: Asia Pacific Graphite Electrode Industry Revenue Share (%), by Electrode Grade 2025 & 2033
- Figure 4: Asia Pacific Graphite Electrode Industry Revenue (billion), by Application 2025 & 2033
- Figure 5: Asia Pacific Graphite Electrode Industry Revenue Share (%), by Application 2025 & 2033
- Figure 6: Asia Pacific Graphite Electrode Industry Revenue (billion), by Country 2025 & 2033
- Figure 7: Asia Pacific Graphite Electrode Industry Revenue Share (%), by Country 2025 & 2033
- Figure 8: North America Graphite Electrode Industry Revenue (billion), by Electrode Grade 2025 & 2033
- Figure 9: North America Graphite Electrode Industry Revenue Share (%), by Electrode Grade 2025 & 2033
- Figure 10: North America Graphite Electrode Industry Revenue (billion), by Application 2025 & 2033
- Figure 11: North America Graphite Electrode Industry Revenue Share (%), by Application 2025 & 2033
- Figure 12: North America Graphite Electrode Industry Revenue (billion), by Country 2025 & 2033
- Figure 13: North America Graphite Electrode Industry Revenue Share (%), by Country 2025 & 2033
- Figure 14: Europe Graphite Electrode Industry Revenue (billion), by Electrode Grade 2025 & 2033
- Figure 15: Europe Graphite Electrode Industry Revenue Share (%), by Electrode Grade 2025 & 2033
- Figure 16: Europe Graphite Electrode Industry Revenue (billion), by Application 2025 & 2033
- Figure 17: Europe Graphite Electrode Industry Revenue Share (%), by Application 2025 & 2033
- Figure 18: Europe Graphite Electrode Industry Revenue (billion), by Country 2025 & 2033
- Figure 19: Europe Graphite Electrode Industry Revenue Share (%), by Country 2025 & 2033
- Figure 20: South America Graphite Electrode Industry Revenue (billion), by Electrode Grade 2025 & 2033
- Figure 21: South America Graphite Electrode Industry Revenue Share (%), by Electrode Grade 2025 & 2033
- Figure 22: South America Graphite Electrode Industry Revenue (billion), by Application 2025 & 2033
- Figure 23: South America Graphite Electrode Industry Revenue Share (%), by Application 2025 & 2033
- Figure 24: South America Graphite Electrode Industry Revenue (billion), by Country 2025 & 2033
- Figure 25: South America Graphite Electrode Industry Revenue Share (%), by Country 2025 & 2033
- Figure 26: Middle East and Africa Graphite Electrode Industry Revenue (billion), by Electrode Grade 2025 & 2033
- Figure 27: Middle East and Africa Graphite Electrode Industry Revenue Share (%), by Electrode Grade 2025 & 2033
- Figure 28: Middle East and Africa Graphite Electrode Industry Revenue (billion), by Application 2025 & 2033
- Figure 29: Middle East and Africa Graphite Electrode Industry Revenue Share (%), by Application 2025 & 2033
- Figure 30: Middle East and Africa Graphite Electrode Industry Revenue (billion), by Country 2025 & 2033
- Figure 31: Middle East and Africa Graphite Electrode Industry Revenue Share (%), by Country 2025 & 2033
List of Tables
- Table 1: Global Graphite Electrode Industry Revenue billion Forecast, by Electrode Grade 2020 & 2033
- Table 2: Global Graphite Electrode Industry Revenue billion Forecast, by Application 2020 & 2033
- Table 3: Global Graphite Electrode Industry Revenue billion Forecast, by Region 2020 & 2033
- Table 4: Global Graphite Electrode Industry Revenue billion Forecast, by Electrode Grade 2020 & 2033
- Table 5: Global Graphite Electrode Industry Revenue billion Forecast, by Application 2020 & 2033
- Table 6: Global Graphite Electrode Industry Revenue billion Forecast, by Country 2020 & 2033
- Table 7: China Graphite Electrode Industry Revenue (billion) Forecast, by Application 2020 & 2033
- Table 8: India Graphite Electrode Industry Revenue (billion) Forecast, by Application 2020 & 2033
- Table 9: Japan Graphite Electrode Industry Revenue (billion) Forecast, by Application 2020 & 2033
- Table 10: South Korea Graphite Electrode Industry Revenue (billion) Forecast, by Application 2020 & 2033
- Table 11: Malaysia Graphite Electrode Industry Revenue (billion) Forecast, by Application 2020 & 2033
- Table 12: Thailand Graphite Electrode Industry Revenue (billion) Forecast, by Application 2020 & 2033
- Table 13: Indonesia Graphite Electrode Industry Revenue (billion) Forecast, by Application 2020 & 2033
- Table 14: Vietnam Graphite Electrode Industry Revenue (billion) Forecast, by Application 2020 & 2033
- Table 15: Rest of Asia Pacific Graphite Electrode Industry Revenue (billion) Forecast, by Application 2020 & 2033
- Table 16: Global Graphite Electrode Industry Revenue billion Forecast, by Electrode Grade 2020 & 2033
- Table 17: Global Graphite Electrode Industry Revenue billion Forecast, by Application 2020 & 2033
- Table 18: Global Graphite Electrode Industry Revenue billion Forecast, by Country 2020 & 2033
- Table 19: United States Graphite Electrode Industry Revenue (billion) Forecast, by Application 2020 & 2033
- Table 20: Canada Graphite Electrode Industry Revenue (billion) Forecast, by Application 2020 & 2033
- Table 21: Mexico Graphite Electrode Industry Revenue (billion) Forecast, by Application 2020 & 2033
- Table 22: Global Graphite Electrode Industry Revenue billion Forecast, by Electrode Grade 2020 & 2033
- Table 23: Global Graphite Electrode Industry Revenue billion Forecast, by Application 2020 & 2033
- Table 24: Global Graphite Electrode Industry Revenue billion Forecast, by Country 2020 & 2033
- Table 25: Germany Graphite Electrode Industry Revenue (billion) Forecast, by Application 2020 & 2033
- Table 26: United Kingdom Graphite Electrode Industry Revenue (billion) Forecast, by Application 2020 & 2033
- Table 27: France Graphite Electrode Industry Revenue (billion) Forecast, by Application 2020 & 2033
- Table 28: Italy Graphite Electrode Industry Revenue (billion) Forecast, by Application 2020 & 2033
- Table 29: Spain Graphite Electrode Industry Revenue (billion) Forecast, by Application 2020 & 2033
- Table 30: Nordic Countries Graphite Electrode Industry Revenue (billion) Forecast, by Application 2020 & 2033
- Table 31: Turkey Graphite Electrode Industry Revenue (billion) Forecast, by Application 2020 & 2033
- Table 32: Russia Graphite Electrode Industry Revenue (billion) Forecast, by Application 2020 & 2033
- Table 33: Rest of Europe Graphite Electrode Industry Revenue (billion) Forecast, by Application 2020 & 2033
- Table 34: Global Graphite Electrode Industry Revenue billion Forecast, by Electrode Grade 2020 & 2033
- Table 35: Global Graphite Electrode Industry Revenue billion Forecast, by Application 2020 & 2033
- Table 36: Global Graphite Electrode Industry Revenue billion Forecast, by Country 2020 & 2033
- Table 37: Brazil Graphite Electrode Industry Revenue (billion) Forecast, by Application 2020 & 2033
- Table 38: Argentina Graphite Electrode Industry Revenue (billion) Forecast, by Application 2020 & 2033
- Table 39: Colombia Graphite Electrode Industry Revenue (billion) Forecast, by Application 2020 & 2033
- Table 40: Rest of South America Graphite Electrode Industry Revenue (billion) Forecast, by Application 2020 & 2033
- Table 41: Global Graphite Electrode Industry Revenue billion Forecast, by Electrode Grade 2020 & 2033
- Table 42: Global Graphite Electrode Industry Revenue billion Forecast, by Application 2020 & 2033
- Table 43: Global Graphite Electrode Industry Revenue billion Forecast, by Country 2020 & 2033
- Table 44: Saudi Arabia Graphite Electrode Industry Revenue (billion) Forecast, by Application 2020 & 2033
- Table 45: Qatar Graphite Electrode Industry Revenue (billion) Forecast, by Application 2020 & 2033
- Table 46: United Arab Emirates Graphite Electrode Industry Revenue (billion) Forecast, by Application 2020 & 2033
- Table 47: Egypt Graphite Electrode Industry Revenue (billion) Forecast, by Application 2020 & 2033
- Table 48: South Africa Graphite Electrode Industry Revenue (billion) Forecast, by Application 2020 & 2033
- Table 49: Rest of Middle East and Africa Graphite Electrode Industry Revenue (billion) Forecast, by Application 2020 & 2033
Frequently Asked Questions
1. What is the projected Compound Annual Growth Rate (CAGR) of the Graphite Electrode Industry?
The projected CAGR is approximately 6.48%.
2. Which companies are prominent players in the Graphite Electrode Industry?
Key companies in the market include EL 6 LLC, Fangda Carbon New Material Technology Co Ltd, GrafTech International, Graphite India Limited, HEG Limited, Kaifeng Pingmei New Carbon Materials Technology Co Ltd, Liaoning Dantan Technology Group Co Ltd (Dan Carbon), Nantong Yangzi Carbon Co Ltd, Nippon Carbon Co Ltd, Sangraf International Inc, SEC Carbon Limited, Resonac Holdings Corporation, Tokai Carbon Co Ltd, Zhongze Group*List Not Exhaustive.
3. What are the main segments of the Graphite Electrode Industry?
The market segments include Electrode Grade , Application.
4. Can you provide details about the market size?
The market size is estimated to be USD 4.48 billion as of 2022.
5. What are some drivers contributing to market growth?
Strong Demand for EAF Technology for Steelmaking; Rising Availability of Steel Scrap in China.
6. What are the notable trends driving market growth?
The Electric Arc Furnace Segment to Dominate the Market.
7. Are there any restraints impacting market growth?
Strong Demand for EAF Technology for Steelmaking; Rising Availability of Steel Scrap in China.
8. Can you provide examples of recent developments in the market?
January 2023: Showa Denko K.K. (SDK) and Showa Denko Materials Co. Ltd (formerly Hitachi Chemical Company Ltd) underwent a merger. This transformation gave rise to two distinct entities, i.e., a holding company, now known as "Resonac Holdings Corporation," and a manufacturing company, named "Resonac Corporation." This merger consolidated both companies' operations, particularly in the graphite electrode sector, streamlining their manufacturing and supply chains.
9. What pricing options are available for accessing the report?
Pricing options include single-user, multi-user, and enterprise licenses priced at USD 4750, USD 5250, and USD 8750 respectively.
10. Is the market size provided in terms of value or volume?
The market size is provided in terms of value, measured in billion.
11. Are there any specific market keywords associated with the report?
Yes, the market keyword associated with the report is "Graphite Electrode Industry," which aids in identifying and referencing the specific market segment covered.
12. How do I determine which pricing option suits my needs best?
The pricing options vary based on user requirements and access needs. Individual users may opt for single-user licenses, while businesses requiring broader access may choose multi-user or enterprise licenses for cost-effective access to the report.
13. Are there any additional resources or data provided in the Graphite Electrode Industry report?
While the report offers comprehensive insights, it's advisable to review the specific contents or supplementary materials provided to ascertain if additional resources or data are available.
14. How can I stay updated on further developments or reports in the Graphite Electrode Industry?
To stay informed about further developments, trends, and reports in the Graphite Electrode Industry, consider subscribing to industry newsletters, following relevant companies and organizations, or regularly checking reputable industry news sources and publications.
Methodology
Step 1 - Identification of Relevant Samples Size from Population Database


Step 2 - Approaches for Defining Global Market Size (Value, Volume* & Price*)

Note*: In applicable scenarios
Step 3 - Data Sources
Primary Research
- Web Analytics
- Survey Reports
- Research Institute
- Latest Research Reports
- Opinion Leaders
Secondary Research
- Annual Reports
- White Paper
- Latest Press Release
- Industry Association
- Paid Database
- Investor Presentations

Step 4 - Data Triangulation
Involves using different sources of information in order to increase the validity of a study
These sources are likely to be stakeholders in a program - participants, other researchers, program staff, other community members, and so on.
Then we put all data in single framework & apply various statistical tools to find out the dynamic on the market.
During the analysis stage, feedback from the stakeholder groups would be compared to determine areas of agreement as well as areas of divergence