

Key Insights
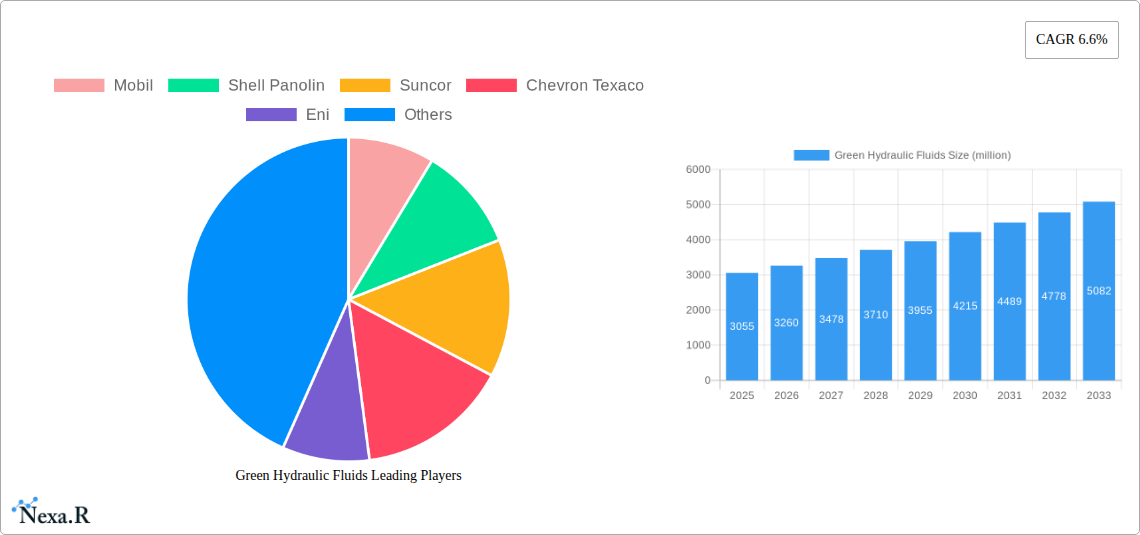
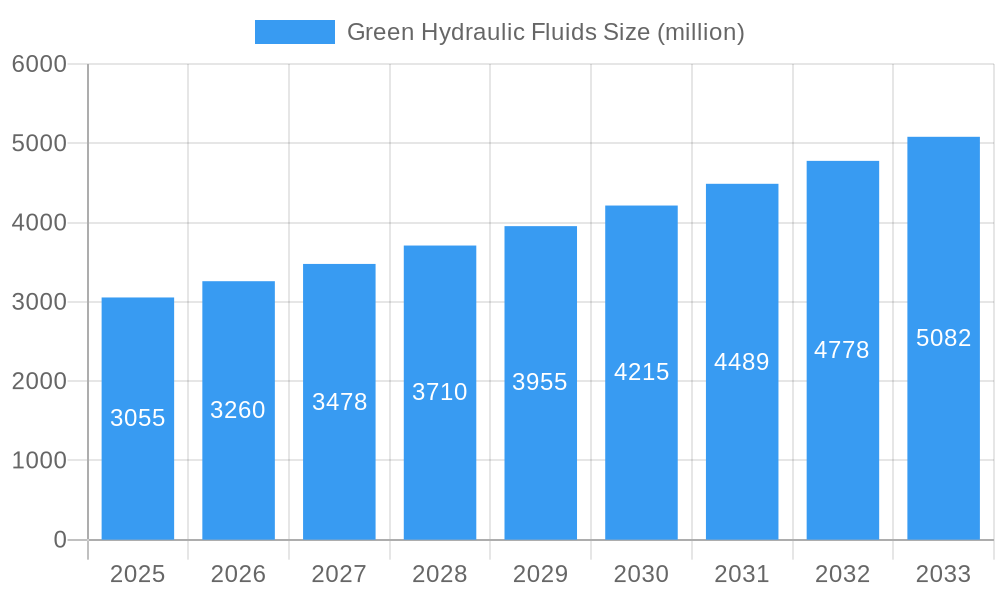
The global green hydraulic fluids market, valued at approximately $3.055 billion in 2025, is projected to experience robust growth, driven by increasing environmental regulations, rising demand for sustainable industrial practices, and a growing focus on reducing carbon footprints across various sectors. The 6.6% CAGR signifies a substantial expansion over the forecast period (2025-2033), indicating strong market potential. Key drivers include stringent emission norms, particularly in the automotive, manufacturing, and construction industries, pushing manufacturers to adopt eco-friendly hydraulic fluids. Furthermore, the growing awareness of the environmental impact of traditional petroleum-based hydraulic fluids is accelerating the adoption of biodegradable and renewable alternatives. This market is segmented based on fluid type (e.g., vegetable-based, bio-based synthetic), application (e.g., mobile equipment, industrial machinery), and geography. Leading players like Mobil, Shell Panolin, and others are strategically investing in R&D and expanding their product portfolios to cater to this rising demand, fueling market competition and innovation.
Green Hydraulic Fluids Market Size (In Billion)
The market's growth trajectory is expected to be influenced by factors such as technological advancements leading to improved performance characteristics of green hydraulic fluids, government incentives promoting the use of sustainable technologies, and fluctuating raw material prices. However, challenges remain, including higher initial costs compared to conventional hydraulic fluids, and potential performance limitations in specific applications. Overcoming these challenges requires collaborative efforts across the value chain, including research institutions, manufacturers, and end-users, to ensure the widespread adoption of green hydraulic fluids. The market is witnessing a shift towards bio-based and synthetic options, reflecting a broader trend of sustainability and circular economy principles within the industrial landscape. Regional variations in adoption rates will likely depend on regulatory environments, economic factors, and industry-specific demands.
Green Hydraulic Fluids Company Market Share
Green Hydraulic Fluids Market Report: 2019-2033
This comprehensive report provides an in-depth analysis of the Green Hydraulic Fluids market, offering invaluable insights for industry professionals, investors, and stakeholders. The study period covers 2019-2033, with 2025 as the base and estimated year. The forecast period spans 2025-2033, and the historical period encompasses 2019-2024. The report examines market dynamics, growth trends, regional dominance, product landscape, key players (including Mobil, Shell Panolin, Suncor, Chevron Texaco, Eni, Fuchs SE, Neste, TotalEnergies, Motorex, BioBlend, LUKOIL Marine, Renewable Lubricants, and Motul Tech), and emerging opportunities within the broader renewable energy and industrial lubricant sectors. The total market size in 2025 is estimated at $XX billion.
Green Hydraulic Fluids Market Dynamics & Structure
This section analyzes the market structure, including market concentration (estimated at xx% in 2025), technological innovation drivers (e.g., bio-based fluids, improved efficiency), regulatory frameworks (e.g., emission standards, waste disposal regulations), competitive product substitutes (e.g., traditional hydraulic fluids), end-user demographics (e.g., manufacturing, construction, agriculture), and M&A trends (xx deals in the last 5 years, valued at $xx billion).
- Market Concentration: Highly fragmented, with top 5 players holding approximately xx% market share in 2025.
- Technological Innovation: Focus on improving biodegradability, reducing carbon footprint, and enhancing performance characteristics.
- Regulatory Landscape: Stringent environmental regulations are driving adoption of green hydraulic fluids.
- Competitive Substitutes: Traditional mineral-based hydraulic fluids still dominate, posing a competitive challenge.
- End-User Demographics: Significant demand from manufacturing, construction, and agricultural sectors.
- M&A Activity: Consolidation is expected to increase as companies seek to expand their market share and product portfolios.
Green Hydraulic Fluids Growth Trends & Insights
This section provides a detailed analysis of market size evolution, adoption rates, technological disruptions, and consumer behavior shifts using proprietary data and market research. The market is projected to experience a CAGR of xx% during the forecast period (2025-2033), driven by increasing environmental concerns and government regulations. Market penetration is expected to reach xx% by 2033. Technological advancements, such as the development of high-performance bio-based fluids, are contributing to faster adoption rates. Consumer preference is shifting towards sustainable and environmentally friendly solutions.
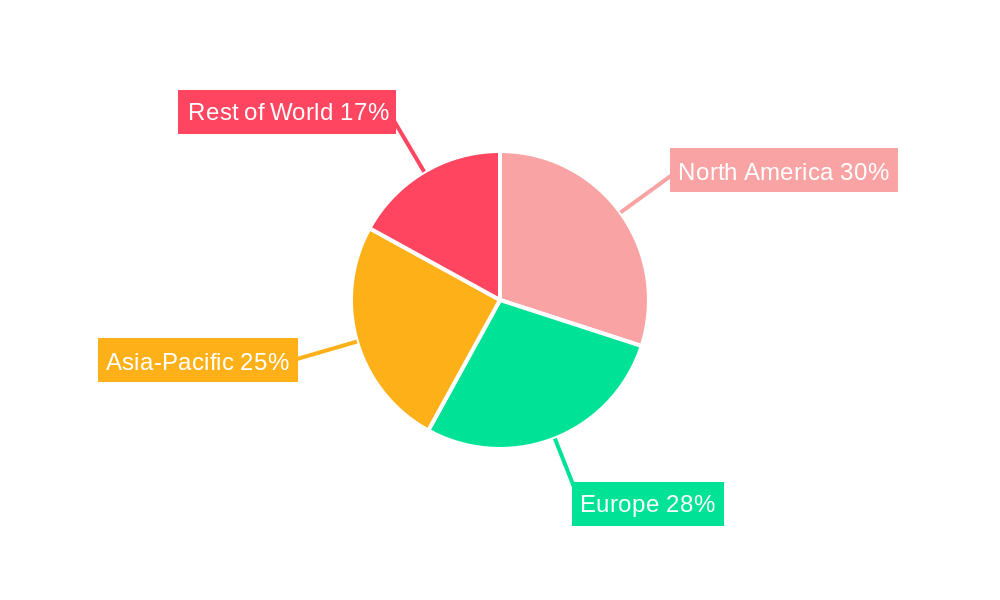
Dominant Regions, Countries, or Segments in Green Hydraulic Fluids
North America currently holds the largest market share, driven by stringent environmental regulations and a strong focus on sustainability. Europe and Asia-Pacific are also experiencing significant growth, fueled by increasing industrialization and government initiatives promoting renewable energy.
- North America: Stringent emission standards and high environmental awareness are driving market growth.
- Europe: Strong government support for renewable energy and sustainable practices is boosting adoption rates.
- Asia-Pacific: Rapid industrialization and increasing infrastructure development are creating significant demand.
Green Hydraulic Fluids Product Landscape
Green hydraulic fluids encompass a range of products, including bio-based fluids, vegetable oils, and synthetic esters. These fluids offer improved biodegradability, reduced toxicity, and enhanced performance compared to traditional mineral oils. Key innovations focus on enhancing viscosity, thermal stability, and oxidative resistance to meet diverse application requirements. Unique selling propositions include reduced environmental impact and improved operational efficiency.
Key Drivers, Barriers & Challenges in Green Hydraulic Fluids
Key Drivers:
- Increasing environmental concerns and stringent regulations.
- Growing demand for sustainable and eco-friendly products.
- Technological advancements leading to improved performance characteristics.
- Government incentives and subsidies promoting the use of renewable energy.
Key Challenges:
- Higher initial cost compared to traditional hydraulic fluids.
- Limited availability and supply chain constraints.
- Performance limitations in extreme operating conditions.
- Lack of standardization and compatibility issues.
Emerging Opportunities in Green Hydraulic Fluids
Emerging opportunities include expansion into untapped markets (e.g., developing economies), development of innovative applications (e.g., hybrid and electric vehicles), and catering to evolving consumer preferences (e.g., demand for high-performance, biodegradable fluids). The potential for growth in niche segments, such as specialized industrial applications, is also significant.
Growth Accelerators in the Green Hydraulic Fluids Industry
Technological breakthroughs, strategic partnerships, and market expansion strategies are key growth accelerators. Companies are investing heavily in R&D to develop advanced bio-based fluids with enhanced performance characteristics. Strategic partnerships are enabling access to new markets and technologies. Expansion into emerging economies is driving significant growth potential.
Key Players Shaping the Green Hydraulic Fluids Market
- Mobil
- Shell Panolin
- Suncor
- Chevron Texaco
- Eni
- Fuchs SE
- Neste
- TotalEnergies
- Motorex
- BioBlend
- LUKOIL Marine
- Renewable Lubricants
- Motul Tech
Notable Milestones in Green Hydraulic Fluids Sector
- 2020: Neste launches a new range of bio-based hydraulic fluids.
- 2021: Shell Panolin acquires a smaller green hydraulic fluid producer.
- 2022: Several key players announce new R&D initiatives focusing on next-generation bio-based fluids.
- 2023: New regulations in Europe drive increased demand for sustainable hydraulic fluids.
In-Depth Green Hydraulic Fluids Market Outlook
The future of the green hydraulic fluids market is promising, driven by continuous technological innovation, increasing environmental awareness, and supportive government policies. Strategic partnerships and market expansion into emerging economies will further fuel growth. The market is poised for significant expansion, creating lucrative opportunities for players across the value chain.
Green Hydraulic Fluids Segmentation
-
1. Application
- 1.1. Construction and Mining
- 1.2. Marine
- 1.3. Agriculture and Forestry
- 1.4. Other
-
2. Types
- 2.1. Synthetic Esters
- 2.2. Vegetable Oils
- 2.3. Others
Green Hydraulic Fluids Segmentation By Geography
-
1. North America
- 1.1. United States
- 1.2. Canada
- 1.3. Mexico
-
2. South America
- 2.1. Brazil
- 2.2. Argentina
- 2.3. Rest of South America
-
3. Europe
- 3.1. United Kingdom
- 3.2. Germany
- 3.3. France
- 3.4. Italy
- 3.5. Spain
- 3.6. Russia
- 3.7. Benelux
- 3.8. Nordics
- 3.9. Rest of Europe
-
4. Middle East & Africa
- 4.1. Turkey
- 4.2. Israel
- 4.3. GCC
- 4.4. North Africa
- 4.5. South Africa
- 4.6. Rest of Middle East & Africa
-
5. Asia Pacific
- 5.1. China
- 5.2. India
- 5.3. Japan
- 5.4. South Korea
- 5.5. ASEAN
- 5.6. Oceania
- 5.7. Rest of Asia Pacific
Green Hydraulic Fluids Regional Market Share
Geographic Coverage of Green Hydraulic Fluids
Green Hydraulic Fluids REPORT HIGHLIGHTS
| Aspects | Details |
|---|---|
| Study Period | 2020-2034 |
| Base Year | 2025 |
| Estimated Year | 2026 |
| Forecast Period | 2026-2034 |
| Historical Period | 2020-2025 |
| Growth Rate | CAGR of 6.6% from 2020-2034 |
| Segmentation |
|
Table of Contents
- 1. Introduction
- 1.1. Research Scope
- 1.2. Market Segmentation
- 1.3. Research Methodology
- 1.4. Definitions and Assumptions
- 2. Executive Summary
- 2.1. Introduction
- 3. Market Dynamics
- 3.1. Introduction
- 3.2. Market Drivers
- 3.3. Market Restrains
- 3.4. Market Trends
- 4. Market Factor Analysis
- 4.1. Porters Five Forces
- 4.2. Supply/Value Chain
- 4.3. PESTEL analysis
- 4.4. Market Entropy
- 4.5. Patent/Trademark Analysis
- 5. Global Green Hydraulic Fluids Analysis, Insights and Forecast, 2020-2032
- 5.1. Market Analysis, Insights and Forecast - by Application
- 5.1.1. Construction and Mining
- 5.1.2. Marine
- 5.1.3. Agriculture and Forestry
- 5.1.4. Other
- 5.2. Market Analysis, Insights and Forecast - by Types
- 5.2.1. Synthetic Esters
- 5.2.2. Vegetable Oils
- 5.2.3. Others
- 5.3. Market Analysis, Insights and Forecast - by Region
- 5.3.1. North America
- 5.3.2. South America
- 5.3.3. Europe
- 5.3.4. Middle East & Africa
- 5.3.5. Asia Pacific
- 5.1. Market Analysis, Insights and Forecast - by Application
- 6. North America Green Hydraulic Fluids Analysis, Insights and Forecast, 2020-2032
- 6.1. Market Analysis, Insights and Forecast - by Application
- 6.1.1. Construction and Mining
- 6.1.2. Marine
- 6.1.3. Agriculture and Forestry
- 6.1.4. Other
- 6.2. Market Analysis, Insights and Forecast - by Types
- 6.2.1. Synthetic Esters
- 6.2.2. Vegetable Oils
- 6.2.3. Others
- 6.1. Market Analysis, Insights and Forecast - by Application
- 7. South America Green Hydraulic Fluids Analysis, Insights and Forecast, 2020-2032
- 7.1. Market Analysis, Insights and Forecast - by Application
- 7.1.1. Construction and Mining
- 7.1.2. Marine
- 7.1.3. Agriculture and Forestry
- 7.1.4. Other
- 7.2. Market Analysis, Insights and Forecast - by Types
- 7.2.1. Synthetic Esters
- 7.2.2. Vegetable Oils
- 7.2.3. Others
- 7.1. Market Analysis, Insights and Forecast - by Application
- 8. Europe Green Hydraulic Fluids Analysis, Insights and Forecast, 2020-2032
- 8.1. Market Analysis, Insights and Forecast - by Application
- 8.1.1. Construction and Mining
- 8.1.2. Marine
- 8.1.3. Agriculture and Forestry
- 8.1.4. Other
- 8.2. Market Analysis, Insights and Forecast - by Types
- 8.2.1. Synthetic Esters
- 8.2.2. Vegetable Oils
- 8.2.3. Others
- 8.1. Market Analysis, Insights and Forecast - by Application
- 9. Middle East & Africa Green Hydraulic Fluids Analysis, Insights and Forecast, 2020-2032
- 9.1. Market Analysis, Insights and Forecast - by Application
- 9.1.1. Construction and Mining
- 9.1.2. Marine
- 9.1.3. Agriculture and Forestry
- 9.1.4. Other
- 9.2. Market Analysis, Insights and Forecast - by Types
- 9.2.1. Synthetic Esters
- 9.2.2. Vegetable Oils
- 9.2.3. Others
- 9.1. Market Analysis, Insights and Forecast - by Application
- 10. Asia Pacific Green Hydraulic Fluids Analysis, Insights and Forecast, 2020-2032
- 10.1. Market Analysis, Insights and Forecast - by Application
- 10.1.1. Construction and Mining
- 10.1.2. Marine
- 10.1.3. Agriculture and Forestry
- 10.1.4. Other
- 10.2. Market Analysis, Insights and Forecast - by Types
- 10.2.1. Synthetic Esters
- 10.2.2. Vegetable Oils
- 10.2.3. Others
- 10.1. Market Analysis, Insights and Forecast - by Application
- 11. Competitive Analysis
- 11.1. Global Market Share Analysis 2025
- 11.2. Company Profiles
- 11.2.1 Mobil
- 11.2.1.1. Overview
- 11.2.1.2. Products
- 11.2.1.3. SWOT Analysis
- 11.2.1.4. Recent Developments
- 11.2.1.5. Financials (Based on Availability)
- 11.2.2 Shell Panolin
- 11.2.2.1. Overview
- 11.2.2.2. Products
- 11.2.2.3. SWOT Analysis
- 11.2.2.4. Recent Developments
- 11.2.2.5. Financials (Based on Availability)
- 11.2.3 Suncor
- 11.2.3.1. Overview
- 11.2.3.2. Products
- 11.2.3.3. SWOT Analysis
- 11.2.3.4. Recent Developments
- 11.2.3.5. Financials (Based on Availability)
- 11.2.4 Chevron Texaco
- 11.2.4.1. Overview
- 11.2.4.2. Products
- 11.2.4.3. SWOT Analysis
- 11.2.4.4. Recent Developments
- 11.2.4.5. Financials (Based on Availability)
- 11.2.5 Eni
- 11.2.5.1. Overview
- 11.2.5.2. Products
- 11.2.5.3. SWOT Analysis
- 11.2.5.4. Recent Developments
- 11.2.5.5. Financials (Based on Availability)
- 11.2.6 Fuchs SE
- 11.2.6.1. Overview
- 11.2.6.2. Products
- 11.2.6.3. SWOT Analysis
- 11.2.6.4. Recent Developments
- 11.2.6.5. Financials (Based on Availability)
- 11.2.7 Neste
- 11.2.7.1. Overview
- 11.2.7.2. Products
- 11.2.7.3. SWOT Analysis
- 11.2.7.4. Recent Developments
- 11.2.7.5. Financials (Based on Availability)
- 11.2.8 TotalEnergies
- 11.2.8.1. Overview
- 11.2.8.2. Products
- 11.2.8.3. SWOT Analysis
- 11.2.8.4. Recent Developments
- 11.2.8.5. Financials (Based on Availability)
- 11.2.9 Motorex
- 11.2.9.1. Overview
- 11.2.9.2. Products
- 11.2.9.3. SWOT Analysis
- 11.2.9.4. Recent Developments
- 11.2.9.5. Financials (Based on Availability)
- 11.2.10 BioBlend
- 11.2.10.1. Overview
- 11.2.10.2. Products
- 11.2.10.3. SWOT Analysis
- 11.2.10.4. Recent Developments
- 11.2.10.5. Financials (Based on Availability)
- 11.2.11 LUKOIL Marine
- 11.2.11.1. Overview
- 11.2.11.2. Products
- 11.2.11.3. SWOT Analysis
- 11.2.11.4. Recent Developments
- 11.2.11.5. Financials (Based on Availability)
- 11.2.12 Renewable Lubricants
- 11.2.12.1. Overview
- 11.2.12.2. Products
- 11.2.12.3. SWOT Analysis
- 11.2.12.4. Recent Developments
- 11.2.12.5. Financials (Based on Availability)
- 11.2.13 Motul Tech
- 11.2.13.1. Overview
- 11.2.13.2. Products
- 11.2.13.3. SWOT Analysis
- 11.2.13.4. Recent Developments
- 11.2.13.5. Financials (Based on Availability)
- 11.2.1 Mobil
List of Figures
- Figure 1: Global Green Hydraulic Fluids Revenue Breakdown (million, %) by Region 2025 & 2033
- Figure 2: North America Green Hydraulic Fluids Revenue (million), by Application 2025 & 2033
- Figure 3: North America Green Hydraulic Fluids Revenue Share (%), by Application 2025 & 2033
- Figure 4: North America Green Hydraulic Fluids Revenue (million), by Types 2025 & 2033
- Figure 5: North America Green Hydraulic Fluids Revenue Share (%), by Types 2025 & 2033
- Figure 6: North America Green Hydraulic Fluids Revenue (million), by Country 2025 & 2033
- Figure 7: North America Green Hydraulic Fluids Revenue Share (%), by Country 2025 & 2033
- Figure 8: South America Green Hydraulic Fluids Revenue (million), by Application 2025 & 2033
- Figure 9: South America Green Hydraulic Fluids Revenue Share (%), by Application 2025 & 2033
- Figure 10: South America Green Hydraulic Fluids Revenue (million), by Types 2025 & 2033
- Figure 11: South America Green Hydraulic Fluids Revenue Share (%), by Types 2025 & 2033
- Figure 12: South America Green Hydraulic Fluids Revenue (million), by Country 2025 & 2033
- Figure 13: South America Green Hydraulic Fluids Revenue Share (%), by Country 2025 & 2033
- Figure 14: Europe Green Hydraulic Fluids Revenue (million), by Application 2025 & 2033
- Figure 15: Europe Green Hydraulic Fluids Revenue Share (%), by Application 2025 & 2033
- Figure 16: Europe Green Hydraulic Fluids Revenue (million), by Types 2025 & 2033
- Figure 17: Europe Green Hydraulic Fluids Revenue Share (%), by Types 2025 & 2033
- Figure 18: Europe Green Hydraulic Fluids Revenue (million), by Country 2025 & 2033
- Figure 19: Europe Green Hydraulic Fluids Revenue Share (%), by Country 2025 & 2033
- Figure 20: Middle East & Africa Green Hydraulic Fluids Revenue (million), by Application 2025 & 2033
- Figure 21: Middle East & Africa Green Hydraulic Fluids Revenue Share (%), by Application 2025 & 2033
- Figure 22: Middle East & Africa Green Hydraulic Fluids Revenue (million), by Types 2025 & 2033
- Figure 23: Middle East & Africa Green Hydraulic Fluids Revenue Share (%), by Types 2025 & 2033
- Figure 24: Middle East & Africa Green Hydraulic Fluids Revenue (million), by Country 2025 & 2033
- Figure 25: Middle East & Africa Green Hydraulic Fluids Revenue Share (%), by Country 2025 & 2033
- Figure 26: Asia Pacific Green Hydraulic Fluids Revenue (million), by Application 2025 & 2033
- Figure 27: Asia Pacific Green Hydraulic Fluids Revenue Share (%), by Application 2025 & 2033
- Figure 28: Asia Pacific Green Hydraulic Fluids Revenue (million), by Types 2025 & 2033
- Figure 29: Asia Pacific Green Hydraulic Fluids Revenue Share (%), by Types 2025 & 2033
- Figure 30: Asia Pacific Green Hydraulic Fluids Revenue (million), by Country 2025 & 2033
- Figure 31: Asia Pacific Green Hydraulic Fluids Revenue Share (%), by Country 2025 & 2033
List of Tables
- Table 1: Global Green Hydraulic Fluids Revenue million Forecast, by Application 2020 & 2033
- Table 2: Global Green Hydraulic Fluids Revenue million Forecast, by Types 2020 & 2033
- Table 3: Global Green Hydraulic Fluids Revenue million Forecast, by Region 2020 & 2033
- Table 4: Global Green Hydraulic Fluids Revenue million Forecast, by Application 2020 & 2033
- Table 5: Global Green Hydraulic Fluids Revenue million Forecast, by Types 2020 & 2033
- Table 6: Global Green Hydraulic Fluids Revenue million Forecast, by Country 2020 & 2033
- Table 7: United States Green Hydraulic Fluids Revenue (million) Forecast, by Application 2020 & 2033
- Table 8: Canada Green Hydraulic Fluids Revenue (million) Forecast, by Application 2020 & 2033
- Table 9: Mexico Green Hydraulic Fluids Revenue (million) Forecast, by Application 2020 & 2033
- Table 10: Global Green Hydraulic Fluids Revenue million Forecast, by Application 2020 & 2033
- Table 11: Global Green Hydraulic Fluids Revenue million Forecast, by Types 2020 & 2033
- Table 12: Global Green Hydraulic Fluids Revenue million Forecast, by Country 2020 & 2033
- Table 13: Brazil Green Hydraulic Fluids Revenue (million) Forecast, by Application 2020 & 2033
- Table 14: Argentina Green Hydraulic Fluids Revenue (million) Forecast, by Application 2020 & 2033
- Table 15: Rest of South America Green Hydraulic Fluids Revenue (million) Forecast, by Application 2020 & 2033
- Table 16: Global Green Hydraulic Fluids Revenue million Forecast, by Application 2020 & 2033
- Table 17: Global Green Hydraulic Fluids Revenue million Forecast, by Types 2020 & 2033
- Table 18: Global Green Hydraulic Fluids Revenue million Forecast, by Country 2020 & 2033
- Table 19: United Kingdom Green Hydraulic Fluids Revenue (million) Forecast, by Application 2020 & 2033
- Table 20: Germany Green Hydraulic Fluids Revenue (million) Forecast, by Application 2020 & 2033
- Table 21: France Green Hydraulic Fluids Revenue (million) Forecast, by Application 2020 & 2033
- Table 22: Italy Green Hydraulic Fluids Revenue (million) Forecast, by Application 2020 & 2033
- Table 23: Spain Green Hydraulic Fluids Revenue (million) Forecast, by Application 2020 & 2033
- Table 24: Russia Green Hydraulic Fluids Revenue (million) Forecast, by Application 2020 & 2033
- Table 25: Benelux Green Hydraulic Fluids Revenue (million) Forecast, by Application 2020 & 2033
- Table 26: Nordics Green Hydraulic Fluids Revenue (million) Forecast, by Application 2020 & 2033
- Table 27: Rest of Europe Green Hydraulic Fluids Revenue (million) Forecast, by Application 2020 & 2033
- Table 28: Global Green Hydraulic Fluids Revenue million Forecast, by Application 2020 & 2033
- Table 29: Global Green Hydraulic Fluids Revenue million Forecast, by Types 2020 & 2033
- Table 30: Global Green Hydraulic Fluids Revenue million Forecast, by Country 2020 & 2033
- Table 31: Turkey Green Hydraulic Fluids Revenue (million) Forecast, by Application 2020 & 2033
- Table 32: Israel Green Hydraulic Fluids Revenue (million) Forecast, by Application 2020 & 2033
- Table 33: GCC Green Hydraulic Fluids Revenue (million) Forecast, by Application 2020 & 2033
- Table 34: North Africa Green Hydraulic Fluids Revenue (million) Forecast, by Application 2020 & 2033
- Table 35: South Africa Green Hydraulic Fluids Revenue (million) Forecast, by Application 2020 & 2033
- Table 36: Rest of Middle East & Africa Green Hydraulic Fluids Revenue (million) Forecast, by Application 2020 & 2033
- Table 37: Global Green Hydraulic Fluids Revenue million Forecast, by Application 2020 & 2033
- Table 38: Global Green Hydraulic Fluids Revenue million Forecast, by Types 2020 & 2033
- Table 39: Global Green Hydraulic Fluids Revenue million Forecast, by Country 2020 & 2033
- Table 40: China Green Hydraulic Fluids Revenue (million) Forecast, by Application 2020 & 2033
- Table 41: India Green Hydraulic Fluids Revenue (million) Forecast, by Application 2020 & 2033
- Table 42: Japan Green Hydraulic Fluids Revenue (million) Forecast, by Application 2020 & 2033
- Table 43: South Korea Green Hydraulic Fluids Revenue (million) Forecast, by Application 2020 & 2033
- Table 44: ASEAN Green Hydraulic Fluids Revenue (million) Forecast, by Application 2020 & 2033
- Table 45: Oceania Green Hydraulic Fluids Revenue (million) Forecast, by Application 2020 & 2033
- Table 46: Rest of Asia Pacific Green Hydraulic Fluids Revenue (million) Forecast, by Application 2020 & 2033
Frequently Asked Questions
1. What is the projected Compound Annual Growth Rate (CAGR) of the Green Hydraulic Fluids?
The projected CAGR is approximately 6.6%.
2. Which companies are prominent players in the Green Hydraulic Fluids?
Key companies in the market include Mobil, Shell Panolin, Suncor, Chevron Texaco, Eni, Fuchs SE, Neste, TotalEnergies, Motorex, BioBlend, LUKOIL Marine, Renewable Lubricants, Motul Tech.
3. What are the main segments of the Green Hydraulic Fluids?
The market segments include Application, Types.
4. Can you provide details about the market size?
The market size is estimated to be USD 3055 million as of 2022.
5. What are some drivers contributing to market growth?
N/A
6. What are the notable trends driving market growth?
N/A
7. Are there any restraints impacting market growth?
N/A
8. Can you provide examples of recent developments in the market?
N/A
9. What pricing options are available for accessing the report?
Pricing options include single-user, multi-user, and enterprise licenses priced at USD 2900.00, USD 4350.00, and USD 5800.00 respectively.
10. Is the market size provided in terms of value or volume?
The market size is provided in terms of value, measured in million.
11. Are there any specific market keywords associated with the report?
Yes, the market keyword associated with the report is "Green Hydraulic Fluids," which aids in identifying and referencing the specific market segment covered.
12. How do I determine which pricing option suits my needs best?
The pricing options vary based on user requirements and access needs. Individual users may opt for single-user licenses, while businesses requiring broader access may choose multi-user or enterprise licenses for cost-effective access to the report.
13. Are there any additional resources or data provided in the Green Hydraulic Fluids report?
While the report offers comprehensive insights, it's advisable to review the specific contents or supplementary materials provided to ascertain if additional resources or data are available.
14. How can I stay updated on further developments or reports in the Green Hydraulic Fluids?
To stay informed about further developments, trends, and reports in the Green Hydraulic Fluids, consider subscribing to industry newsletters, following relevant companies and organizations, or regularly checking reputable industry news sources and publications.
Methodology
Step 1 - Identification of Relevant Samples Size from Population Database


Step 2 - Approaches for Defining Global Market Size (Value, Volume* & Price*)

Note*: In applicable scenarios
Step 3 - Data Sources
Primary Research
- Web Analytics
- Survey Reports
- Research Institute
- Latest Research Reports
- Opinion Leaders
Secondary Research
- Annual Reports
- White Paper
- Latest Press Release
- Industry Association
- Paid Database
- Investor Presentations

Step 4 - Data Triangulation
Involves using different sources of information in order to increase the validity of a study
These sources are likely to be stakeholders in a program - participants, other researchers, program staff, other community members, and so on.
Then we put all data in single framework & apply various statistical tools to find out the dynamic on the market.
During the analysis stage, feedback from the stakeholder groups would be compared to determine areas of agreement as well as areas of divergence