

Key Insights
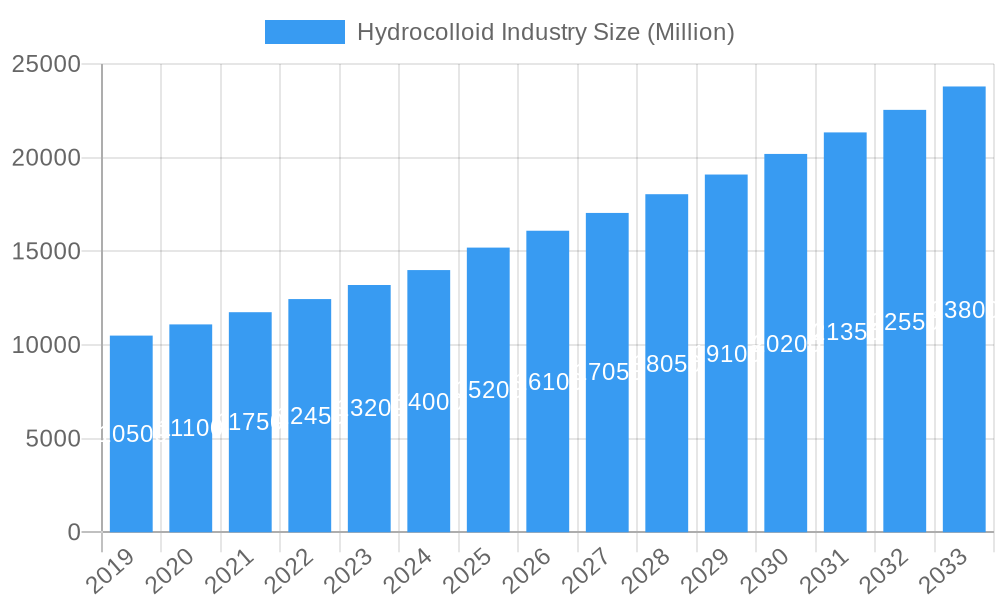
The global Hydrocolloid Industry is poised for robust expansion, projected to reach an estimated market size of $15,200 million by 2025, with a Compound Annual Growth Rate (CAGR) exceeding 6.00% through 2033. This sustained growth is primarily fueled by the escalating demand for processed foods and beverages, where hydrocolloids play a critical role as essential functional ingredients. Key drivers include the growing consumer preference for clean-label products, pushing manufacturers towards natural hydrocolloids derived from sources like plants and seaweed, which are perceived as healthier and more sustainable alternatives to synthetic options. The versatility of hydrocolloids, encompassing their use as thickeners, stabilizers, gelling agents, and fat replacers, further cements their indispensable position across a wide array of applications, including bakery and confectionery, dairy products, meat and poultry, sauces, dressings, and beverages. Leading companies such as ADM, Cargill Incorporated, DuPont, and Ingredion Incorporated are actively investing in research and development to innovate novel hydrocolloid solutions and expand their product portfolios to cater to evolving market needs and stringent regulatory landscapes.
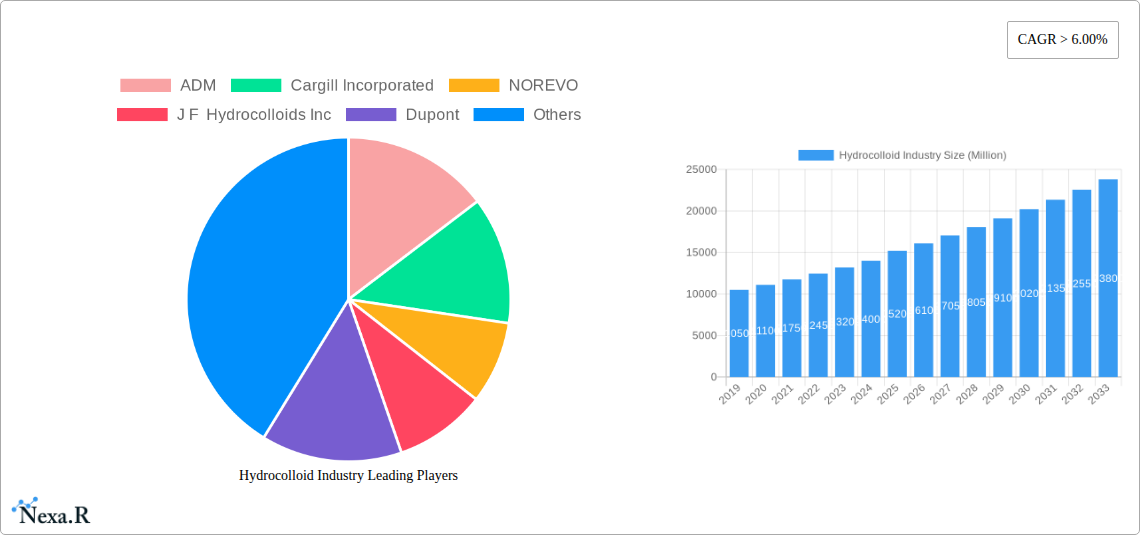
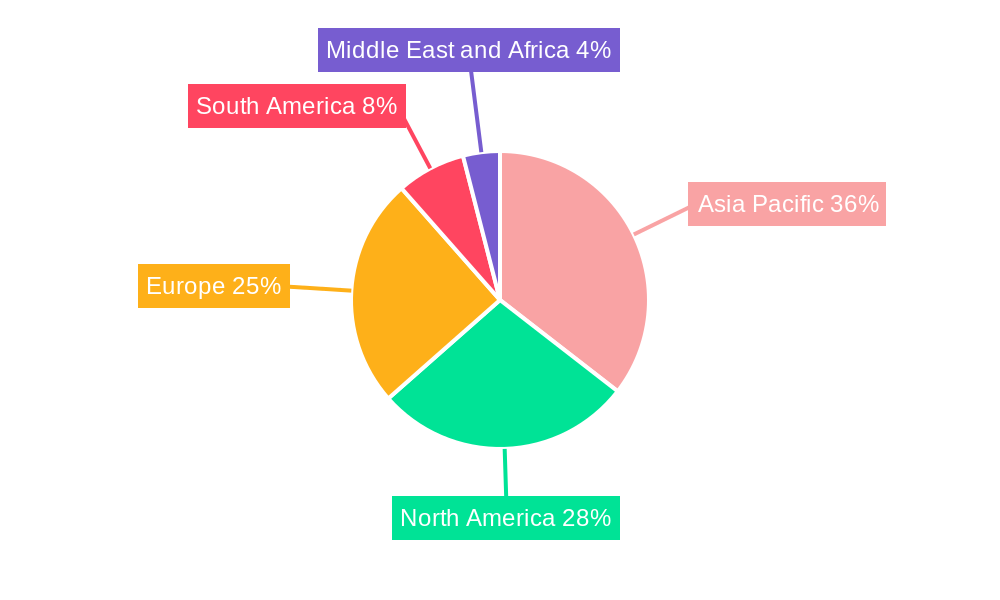
Hydrocolloid Industry Market Size (In Billion)
The market's trajectory is further shaped by significant trends like the increasing focus on texture modification and mouthfeel enhancement in food products, directly addressing consumer expectations for premium sensory experiences. Furthermore, the burgeoning plant-based food sector is a substantial growth catalyst, as hydrocolloids are vital for achieving desirable textures and stability in meat and dairy alternatives. While the market enjoys strong growth, certain restraints, such as fluctuating raw material prices and the complex regulatory approval processes for new hydrocolloid applications, may present challenges. Nevertheless, the continuous innovation in product development, coupled with strategic collaborations and acquisitions by key players, is expected to mitigate these obstacles. Geographically, the Asia Pacific region, particularly China and India, is anticipated to exhibit the highest growth rate due to rapid industrialization, a burgeoning middle class with increased disposable income, and a growing food processing industry. North America and Europe remain significant markets, driven by advanced food technology and established consumer demand for convenience and quality.
Hydrocolloid Industry Company Market Share
Comprehensive Hydrocolloid Industry Market Report: Trends, Opportunities, and Key Players (2019-2033)
This in-depth report provides a strategic analysis of the global Hydrocolloid Market, offering unparalleled insights into its dynamics, growth trajectories, and future potential. Covering the period from 2019 to 2033, with a base and estimated year of 2025, this report delves into market segmentation by source, type, function, and application, while also examining the pivotal roles of leading companies and recent industry developments. Gain a competitive edge with data-driven forecasts, detailed market share analyses, and an understanding of the forces shaping the future of hydrocolloids across diverse sectors, including food and beverage, pharmaceuticals, and personal care.
Hydrocolloid Industry Market Dynamics & Structure
The global Hydrocolloid Market exhibits a moderately concentrated structure, with a significant presence of major international players alongside a growing number of regional specialists. Technological innovation is a primary driver, fueled by ongoing research into novel hydrocolloid sources, enhanced functional properties, and sustainable production methods. Regulatory frameworks, particularly concerning food safety and labeling, play a crucial role in market entry and product development. Competitive product substitutes, including modified starches and synthetic thickeners, necessitate continuous innovation and differentiation by hydrocolloid manufacturers. End-user demographics are shifting towards a demand for clean-label ingredients, natural sourcing, and enhanced nutritional profiles, influencing product development strategies. Mergers and acquisitions (M&A) trends are active, aimed at expanding product portfolios, geographical reach, and market share. For instance, the acquisition of Cargill's stake in Philippine Bio-Industries Inc. by W Hydrocolloids Inc. in September 2020 highlights consolidation within the carrageenan segment. Key innovation barriers include the high cost of research and development, stringent regulatory approvals for novel ingredients, and the need for extensive clinical trials for pharmaceutical applications.
- Market Concentration: Moderately concentrated with key global players and regional specialists.
- Technological Innovation Drivers: Novel sourcing, improved functionalities, sustainable production.
- Regulatory Frameworks: Food safety, labeling standards, and approval processes are critical.
- Competitive Substitutes: Modified starches, synthetic polymers, and other gelling agents.
- End-User Demographics: Growing demand for clean-label, natural, and functional ingredients.
- M&A Trends: Active consolidation for portfolio expansion and market reach.
- Innovation Barriers: R&D costs, regulatory hurdles, and validation requirements.
Hydrocolloid Industry Growth Trends & Insights
The global Hydrocolloid Market is poised for substantial growth, projected to witness a Compound Annual Growth Rate (CAGR) of approximately 6.5% between 2025 and 2033. This expansion is underpinned by a confluence of factors including increasing consumer awareness regarding the functional benefits of hydrocolloids in food and beverage applications, their crucial role in pharmaceutical formulations, and burgeoning demand in the personal care sector. The market size is anticipated to reach $15,800 Million by 2033, a significant increase from an estimated $9,300 Million in 2025. Adoption rates are particularly high in emerging economies, driven by expanding processed food industries and a rising middle class with increased purchasing power. Technological disruptions, such as advancements in extraction and modification techniques, are leading to the development of hydrocolloids with superior texture, stability, and encapsulation properties. Consumer behavior shifts are a major catalyst, with a pronounced preference for natural and plant-based ingredients, favoring gums like guar gum and xanthan gum, alongside pectin derived from fruits. The growing emphasis on healthy eating, demand for convenience foods, and the need for improved shelf-life in packaged goods further fuel market penetration. The expanding application in meat and poultry products as fat replacers and texture enhancers, alongside their established roles in bakery, confectionery, and dairy products, are contributing significantly to market evolution. The beverage industry's adoption for viscosity modification and stabilization in juices, dairy drinks, and functional beverages is another key growth avenue. The forecast period is expected to witness sustained market penetration, with hydrocolloids becoming indispensable ingredients across a wide spectrum of industries.
Dominant Regions, Countries, or Segments in Hydrocolloid Industry
North America and Europe currently dominate the global Hydrocolloid Market, driven by well-established food processing industries, high consumer spending on processed foods, and stringent quality standards that necessitate the use of functional ingredients. The Bakery and Confectionary segment, followed closely by Dairy Products and Sauces and Dressings, stands out as a primary driver of market growth across these regions, accounting for a significant portion of the global hydrocolloid consumption. In North America, the United States spearheads this dominance, benefiting from a sophisticated food manufacturing infrastructure and a strong demand for specialty food ingredients. The adoption of hydrocolloids as Thickeners and Stabilizers in a vast array of food products is a critical factor.
Asia Pacific, however, is emerging as the fastest-growing region, fueled by rapid industrialization, a burgeoning middle class, and increasing urbanization. Countries like China and India are witnessing substantial growth in their food and beverage sectors, leading to a surge in demand for hydrocolloids. The Natural source segment, encompassing gums like Guar Gum and Xanthan Gum, is experiencing robust growth globally, aligning with consumer preferences for clean-label products. Guar Gum, primarily sourced from India, sees significant demand in the food industry for its excellent thickening and stabilizing properties. Xanthan Gum, produced via fermentation, is widely used across various applications due to its versatility. Within the Type segmentation, Guar Gum and Xanthan Gum are projected to exhibit the highest growth rates during the forecast period, driven by their widespread use in gluten-free baking, sauces, dressings, and beverages. The Meat and Poultry Products segment, particularly as a fat replacer and texturizer, is also a significant contributor to growth. Economic policies supporting food processing, coupled with investments in agricultural supply chains for raw materials, are critical in shaping regional dominance. The growing health consciousness among consumers, leading to demand for low-fat and high-fiber products, further bolsters the consumption of hydrocolloids.
- Dominant Regions: North America, Europe, and rapidly growing Asia Pacific.
- Leading Countries: United States, China, India.
- Dominant Application Segments: Bakery and Confectionary, Dairy Products, Sauces and Dressings.
- Dominant Source Segment: Natural.
- Fastest-Growing Type Segments: Guar Gum, Xanthan Gum.
- Key Growth Drivers in Asia Pacific: Industrialization, rising middle class, urbanization.
- Consumer Trends: Clean-label, natural ingredients, low-fat, high-fiber products.
Hydrocolloid Industry Product Landscape
The hydrocolloid product landscape is characterized by continuous innovation in functionality, sourcing, and application. Manufacturers are actively developing hydrocolloids with enhanced emulsifying, gelling, and film-forming properties to meet specific industry demands. Innovations include the development of novel blends to achieve synergistic effects, such as improved texture and stability in dairy alternatives. Furthermore, there is a significant push towards sustainable sourcing and production methods, with a focus on biodegradable and environmentally friendly hydrocolloids. Performance metrics such as viscosity, gelling strength, and thermal stability are continuously being optimized. Unique selling propositions often revolve around allergen-free formulations, non-GMO certifications, and improved water-holding capacities. Technological advancements are enabling more precise control over hydrocolloid structures, leading to tailor-made ingredients for niche applications in pharmaceuticals and advanced food formulations.
Key Drivers, Barriers & Challenges in Hydrocolloid Industry
Key Drivers:
- Growing demand for processed and convenience foods: Hydrocolloids are essential for texture, stability, and shelf-life.
- Rising health consciousness and demand for clean-label ingredients: Natural hydrocolloids are favored.
- Expansion of the pharmaceutical and nutraceutical industries: Hydrocolloids are used as excipients and for drug delivery.
- Technological advancements in hydrocolloid production and modification: Leading to enhanced functionalities.
- Increasing use in plant-based food alternatives: Providing texture and mouthfeel.
Barriers & Challenges:
- Price volatility of raw materials: Especially for natural hydrocolloids like guar gum.
- Stringent regulatory requirements and approval processes: For new applications and novel ingredients.
- Competition from synthetic alternatives and other functional ingredients: Requiring constant innovation and cost-effectiveness.
- Supply chain disruptions and geopolitical factors: Affecting availability and cost of raw materials.
- Consumer perception and potential for allergen concerns: Especially with specific hydrocolloid types.
Emerging Opportunities in Hydrocolloid Industry
Emerging opportunities in the hydrocolloid industry lie in the burgeoning demand for plant-based and alternative protein products, where hydrocolloids play a crucial role in replicating the texture and mouthfeel of traditional animal-based foods. The expanding market for functional foods and beverages, fortified with added health benefits, presents avenues for hydrocolloids in encapsulation and controlled release of active ingredients. Furthermore, the increasing application of hydrocolloids in sustainable packaging solutions, such as edible coatings and biodegradable films, offers a significant growth frontier. Untapped markets in developing economies, coupled with the exploration of novel, sustainable sources of hydrocolloids, are also key areas for future expansion.
Growth Accelerators in the Hydrocolloid Industry Industry
Long-term growth in the hydrocolloid industry is significantly driven by continuous technological breakthroughs in areas like genetic modification of source organisms for higher yields and specific functionalities, and advanced enzymatic or chemical modification techniques. Strategic partnerships and collaborations between ingredient manufacturers, food technologists, and research institutions are accelerating the development and adoption of new hydrocolloid applications. Market expansion strategies, including penetration into emerging economies and diversification into higher-value applications within the pharmaceutical and cosmetic sectors, are crucial growth accelerators. The increasing focus on sustainability and the circular economy is also fostering innovation in biodegradable and bio-based hydrocolloids, opening new market segments.
Key Players Shaping the Hydrocolloid Industry Market
ADM Cargill Incorporated NOREVO J F Hydrocolloids Inc Dupont Ashland DSM AGARMEX SA DE CV Ingredion Incorporated B Braun Melsungen AG Tate & Lyle CP Kelco U S Inc
Notable Milestones in Hydrocolloid Industry Sector
- September 2021: Ingredion signed a new strategic distribution agreement with Batory Foods, consolidating Ingredion's reach in the west and central midwest in the United States.
- February 2021: IFF completed the merger with DuPont's Nutrition & Biosciences ('N&B') business, with the joint venture company operating under the name IFF.
- September 2020: W Hydrocolloids Inc. ('WHI'), a pioneer in the Philippine seaweed industry and a major carrageenan supplier from the Philippines, acquired Cargill's stake of the joint venture in Philippine Bio-Industries Inc. ('PBI').
In-Depth Hydrocolloid Industry Market Outlook
The future outlook for the Hydrocolloid Industry is exceptionally promising, driven by sustained global demand across food, pharmaceutical, and personal care sectors. Key growth accelerators include the ongoing innovation in plant-based alternatives, requiring hydrocolloids for texture and stability, and the expanding use in functional foods for nutrient delivery and improved bioavailability. Strategic opportunities lie in leveraging the growing consumer preference for natural and clean-label ingredients, pushing demand for gums like guar and xanthan, alongside pectin and carrageenan from sustainable sources. Furthermore, the untapped potential in emerging markets, coupled with advancements in biotechnological production of novel hydrocolloids, presents significant avenues for market expansion and value creation. The industry's ability to adapt to evolving regulatory landscapes and consumer trends will be paramount in realizing its full growth potential in the coming years.
Hydrocolloid Industry Segmentation
-
1. Source
- 1.1. Natural
- 1.2. Synthetic
-
2. Type
- 2.1. Gelatin
- 2.2. Carrageenan
- 2.3. Pectin
- 2.4. Xanthum Gum
- 2.5. Guar Gum
- 2.6. Other Types
-
3. Function
- 3.1. Thickener
- 3.2. Stablizer
- 3.3. Coating Agent
- 3.4. Fat Replacer
- 3.5. Gelling Agent
-
4. Application
- 4.1. Bakery and Confectionary
- 4.2. Meat and Poultry Products
- 4.3. Beverages
- 4.4. Sauces and Dressings
- 4.5. Dairy Products
- 4.6. Other Applications
Hydrocolloid Industry Segmentation By Geography
-
1. Asia Pacific
- 1.1. China
- 1.2. India
- 1.3. Japan
- 1.4. South Korea
- 1.5. Rest of Asia Pacific
-
2. North America
- 2.1. United States
- 2.2. Canada
- 2.3. Mexico
-
3. Europe
- 3.1. Germany
- 3.2. United Kingdom
- 3.3. Italy
- 3.4. France
- 3.5. Rest of Europe
-
4. South America
- 4.1. Brazil
- 4.2. Argentina
- 4.3. Rest of South America
-
5. Middle East and Africa
- 5.1. Saudi Arabia
- 5.2. South Africa
- 5.3. Rest of Middle East and Africa
Hydrocolloid Industry Regional Market Share
Geographic Coverage of Hydrocolloid Industry
Hydrocolloid Industry REPORT HIGHLIGHTS
| Aspects | Details |
|---|---|
| Study Period | 2020-2034 |
| Base Year | 2025 |
| Estimated Year | 2026 |
| Forecast Period | 2026-2034 |
| Historical Period | 2020-2025 |
| Growth Rate | CAGR of 5% from 2020-2034 |
| Segmentation |
|
Table of Contents
- 1. Introduction
- 1.1. Research Scope
- 1.2. Market Segmentation
- 1.3. Research Objective
- 1.4. Definitions and Assumptions
- 2. Executive Summary
- 2.1. Market Snapshot
- 3. Market Dynamics
- 3.1. Market Drivers
- 3.2. Market Restrains
- 3.3. Market Trends
- 3.4. Market Opportunities
- 4. Market Factor Analysis
- 4.1. Porters Five Forces
- 4.1.1. Bargaining Power of Suppliers
- 4.1.2. Bargaining Power of Buyers
- 4.1.3. Threat of New Entrants
- 4.1.4. Threat of Substitutes
- 4.1.5. Competitive Rivalry
- 4.2. PESTEL analysis
- 4.3. BCG Analysis
- 4.3.1. Stars (High Growth, High Market Share)
- 4.3.2. Cash Cows (Low Growth, High Market Share)
- 4.3.3. Question Mark (High Growth, Low Market Share)
- 4.3.4. Dogs (Low Growth, Low Market Share)
- 4.4. Ansoff Matrix Analysis
- 4.5. Supply Chain Analysis
- 4.6. Regulatory Landscape
- 4.7. Current Market Potential and Opportunity Assessment (TAM–SAM–SOM Framework)
- 4.8. NRP Analyst Note
- 4.1. Porters Five Forces
- 5. Market Analysis, Insights and Forecast 2021-2033
- 5.1. Market Analysis, Insights and Forecast - by Source
- 5.1.1. Natural
- 5.1.2. Synthetic
- 5.2. Market Analysis, Insights and Forecast - by Type
- 5.2.1. Gelatin
- 5.2.2. Carrageenan
- 5.2.3. Pectin
- 5.2.4. Xanthum Gum
- 5.2.5. Guar Gum
- 5.2.6. Other Types
- 5.3. Market Analysis, Insights and Forecast - by Function
- 5.3.1. Thickener
- 5.3.2. Stablizer
- 5.3.3. Coating Agent
- 5.3.4. Fat Replacer
- 5.3.5. Gelling Agent
- 5.4. Market Analysis, Insights and Forecast - by Application
- 5.4.1. Bakery and Confectionary
- 5.4.2. Meat and Poultry Products
- 5.4.3. Beverages
- 5.4.4. Sauces and Dressings
- 5.4.5. Dairy Products
- 5.4.6. Other Applications
- 5.5. Market Analysis, Insights and Forecast - by Region
- 5.5.1. Asia Pacific
- 5.5.2. North America
- 5.5.3. Europe
- 5.5.4. South America
- 5.5.5. Middle East and Africa
- 5.1. Market Analysis, Insights and Forecast - by Source
- 6. Global Hydrocolloid Industry Analysis, Insights and Forecast, 2021-2033
- 6.1. Market Analysis, Insights and Forecast - by Source
- 6.1.1. Natural
- 6.1.2. Synthetic
- 6.2. Market Analysis, Insights and Forecast - by Type
- 6.2.1. Gelatin
- 6.2.2. Carrageenan
- 6.2.3. Pectin
- 6.2.4. Xanthum Gum
- 6.2.5. Guar Gum
- 6.2.6. Other Types
- 6.3. Market Analysis, Insights and Forecast - by Function
- 6.3.1. Thickener
- 6.3.2. Stablizer
- 6.3.3. Coating Agent
- 6.3.4. Fat Replacer
- 6.3.5. Gelling Agent
- 6.4. Market Analysis, Insights and Forecast - by Application
- 6.4.1. Bakery and Confectionary
- 6.4.2. Meat and Poultry Products
- 6.4.3. Beverages
- 6.4.4. Sauces and Dressings
- 6.4.5. Dairy Products
- 6.4.6. Other Applications
- 6.1. Market Analysis, Insights and Forecast - by Source
- 7. Asia Pacific Hydrocolloid Industry Analysis, Insights and Forecast, 2020-2032
- 7.1. Market Analysis, Insights and Forecast - by Source
- 7.1.1. Natural
- 7.1.2. Synthetic
- 7.2. Market Analysis, Insights and Forecast - by Type
- 7.2.1. Gelatin
- 7.2.2. Carrageenan
- 7.2.3. Pectin
- 7.2.4. Xanthum Gum
- 7.2.5. Guar Gum
- 7.2.6. Other Types
- 7.3. Market Analysis, Insights and Forecast - by Function
- 7.3.1. Thickener
- 7.3.2. Stablizer
- 7.3.3. Coating Agent
- 7.3.4. Fat Replacer
- 7.3.5. Gelling Agent
- 7.4. Market Analysis, Insights and Forecast - by Application
- 7.4.1. Bakery and Confectionary
- 7.4.2. Meat and Poultry Products
- 7.4.3. Beverages
- 7.4.4. Sauces and Dressings
- 7.4.5. Dairy Products
- 7.4.6. Other Applications
- 7.1. Market Analysis, Insights and Forecast - by Source
- 8. North America Hydrocolloid Industry Analysis, Insights and Forecast, 2020-2032
- 8.1. Market Analysis, Insights and Forecast - by Source
- 8.1.1. Natural
- 8.1.2. Synthetic
- 8.2. Market Analysis, Insights and Forecast - by Type
- 8.2.1. Gelatin
- 8.2.2. Carrageenan
- 8.2.3. Pectin
- 8.2.4. Xanthum Gum
- 8.2.5. Guar Gum
- 8.2.6. Other Types
- 8.3. Market Analysis, Insights and Forecast - by Function
- 8.3.1. Thickener
- 8.3.2. Stablizer
- 8.3.3. Coating Agent
- 8.3.4. Fat Replacer
- 8.3.5. Gelling Agent
- 8.4. Market Analysis, Insights and Forecast - by Application
- 8.4.1. Bakery and Confectionary
- 8.4.2. Meat and Poultry Products
- 8.4.3. Beverages
- 8.4.4. Sauces and Dressings
- 8.4.5. Dairy Products
- 8.4.6. Other Applications
- 8.1. Market Analysis, Insights and Forecast - by Source
- 9. Europe Hydrocolloid Industry Analysis, Insights and Forecast, 2020-2032
- 9.1. Market Analysis, Insights and Forecast - by Source
- 9.1.1. Natural
- 9.1.2. Synthetic
- 9.2. Market Analysis, Insights and Forecast - by Type
- 9.2.1. Gelatin
- 9.2.2. Carrageenan
- 9.2.3. Pectin
- 9.2.4. Xanthum Gum
- 9.2.5. Guar Gum
- 9.2.6. Other Types
- 9.3. Market Analysis, Insights and Forecast - by Function
- 9.3.1. Thickener
- 9.3.2. Stablizer
- 9.3.3. Coating Agent
- 9.3.4. Fat Replacer
- 9.3.5. Gelling Agent
- 9.4. Market Analysis, Insights and Forecast - by Application
- 9.4.1. Bakery and Confectionary
- 9.4.2. Meat and Poultry Products
- 9.4.3. Beverages
- 9.4.4. Sauces and Dressings
- 9.4.5. Dairy Products
- 9.4.6. Other Applications
- 9.1. Market Analysis, Insights and Forecast - by Source
- 10. South America Hydrocolloid Industry Analysis, Insights and Forecast, 2020-2032
- 10.1. Market Analysis, Insights and Forecast - by Source
- 10.1.1. Natural
- 10.1.2. Synthetic
- 10.2. Market Analysis, Insights and Forecast - by Type
- 10.2.1. Gelatin
- 10.2.2. Carrageenan
- 10.2.3. Pectin
- 10.2.4. Xanthum Gum
- 10.2.5. Guar Gum
- 10.2.6. Other Types
- 10.3. Market Analysis, Insights and Forecast - by Function
- 10.3.1. Thickener
- 10.3.2. Stablizer
- 10.3.3. Coating Agent
- 10.3.4. Fat Replacer
- 10.3.5. Gelling Agent
- 10.4. Market Analysis, Insights and Forecast - by Application
- 10.4.1. Bakery and Confectionary
- 10.4.2. Meat and Poultry Products
- 10.4.3. Beverages
- 10.4.4. Sauces and Dressings
- 10.4.5. Dairy Products
- 10.4.6. Other Applications
- 10.1. Market Analysis, Insights and Forecast - by Source
- 11. Middle East and Africa Hydrocolloid Industry Analysis, Insights and Forecast, 2020-2032
- 11.1. Market Analysis, Insights and Forecast - by Source
- 11.1.1. Natural
- 11.1.2. Synthetic
- 11.2. Market Analysis, Insights and Forecast - by Type
- 11.2.1. Gelatin
- 11.2.2. Carrageenan
- 11.2.3. Pectin
- 11.2.4. Xanthum Gum
- 11.2.5. Guar Gum
- 11.2.6. Other Types
- 11.3. Market Analysis, Insights and Forecast - by Function
- 11.3.1. Thickener
- 11.3.2. Stablizer
- 11.3.3. Coating Agent
- 11.3.4. Fat Replacer
- 11.3.5. Gelling Agent
- 11.4. Market Analysis, Insights and Forecast - by Application
- 11.4.1. Bakery and Confectionary
- 11.4.2. Meat and Poultry Products
- 11.4.3. Beverages
- 11.4.4. Sauces and Dressings
- 11.4.5. Dairy Products
- 11.4.6. Other Applications
- 11.1. Market Analysis, Insights and Forecast - by Source
- 12. Competitive Analysis
- 12.1. Company Profiles
- 12.1.1 ADM
- 12.1.1.1. Company Overview
- 12.1.1.2. Products
- 12.1.1.3. Company Financials
- 12.1.1.4. SWOT Analysis
- 12.1.2 Cargill Incorporated
- 12.1.2.1. Company Overview
- 12.1.2.2. Products
- 12.1.2.3. Company Financials
- 12.1.2.4. SWOT Analysis
- 12.1.3 NOREVO
- 12.1.3.1. Company Overview
- 12.1.3.2. Products
- 12.1.3.3. Company Financials
- 12.1.3.4. SWOT Analysis
- 12.1.4 J F Hydrocolloids Inc
- 12.1.4.1. Company Overview
- 12.1.4.2. Products
- 12.1.4.3. Company Financials
- 12.1.4.4. SWOT Analysis
- 12.1.5 Dupont
- 12.1.5.1. Company Overview
- 12.1.5.2. Products
- 12.1.5.3. Company Financials
- 12.1.5.4. SWOT Analysis
- 12.1.6 Ashland
- 12.1.6.1. Company Overview
- 12.1.6.2. Products
- 12.1.6.3. Company Financials
- 12.1.6.4. SWOT Analysis
- 12.1.7 DSM
- 12.1.7.1. Company Overview
- 12.1.7.2. Products
- 12.1.7.3. Company Financials
- 12.1.7.4. SWOT Analysis
- 12.1.8 AGARMEX SA DE CV
- 12.1.8.1. Company Overview
- 12.1.8.2. Products
- 12.1.8.3. Company Financials
- 12.1.8.4. SWOT Analysis
- 12.1.9 Ingredion Incorporated
- 12.1.9.1. Company Overview
- 12.1.9.2. Products
- 12.1.9.3. Company Financials
- 12.1.9.4. SWOT Analysis
- 12.1.10 B Braun Melsungen AG
- 12.1.10.1. Company Overview
- 12.1.10.2. Products
- 12.1.10.3. Company Financials
- 12.1.10.4. SWOT Analysis
- 12.1.11 Tate & Lyle*List Not Exhaustive
- 12.1.11.1. Company Overview
- 12.1.11.2. Products
- 12.1.11.3. Company Financials
- 12.1.11.4. SWOT Analysis
- 12.1.12 CP Kelco U S Inc
- 12.1.12.1. Company Overview
- 12.1.12.2. Products
- 12.1.12.3. Company Financials
- 12.1.12.4. SWOT Analysis
- 12.1.1 ADM
- 12.2. Market Entropy
- 12.2.1 Company's Key Areas Served
- 12.2.2 Recent Developments
- 12.3. Company Market Share Analysis 2025
- 12.3.1 Top 5 Companies Market Share Analysis
- 12.3.2 Top 3 Companies Market Share Analysis
- 12.4. List of Potential Customers
- 13. Research Methodology
List of Figures
- Figure 1: Global Hydrocolloid Industry Revenue Breakdown (million, %) by Region 2025 & 2033
- Figure 2: Asia Pacific Hydrocolloid Industry Revenue (million), by Source 2025 & 2033
- Figure 3: Asia Pacific Hydrocolloid Industry Revenue Share (%), by Source 2025 & 2033
- Figure 4: Asia Pacific Hydrocolloid Industry Revenue (million), by Type 2025 & 2033
- Figure 5: Asia Pacific Hydrocolloid Industry Revenue Share (%), by Type 2025 & 2033
- Figure 6: Asia Pacific Hydrocolloid Industry Revenue (million), by Function 2025 & 2033
- Figure 7: Asia Pacific Hydrocolloid Industry Revenue Share (%), by Function 2025 & 2033
- Figure 8: Asia Pacific Hydrocolloid Industry Revenue (million), by Application 2025 & 2033
- Figure 9: Asia Pacific Hydrocolloid Industry Revenue Share (%), by Application 2025 & 2033
- Figure 10: Asia Pacific Hydrocolloid Industry Revenue (million), by Country 2025 & 2033
- Figure 11: Asia Pacific Hydrocolloid Industry Revenue Share (%), by Country 2025 & 2033
- Figure 12: North America Hydrocolloid Industry Revenue (million), by Source 2025 & 2033
- Figure 13: North America Hydrocolloid Industry Revenue Share (%), by Source 2025 & 2033
- Figure 14: North America Hydrocolloid Industry Revenue (million), by Type 2025 & 2033
- Figure 15: North America Hydrocolloid Industry Revenue Share (%), by Type 2025 & 2033
- Figure 16: North America Hydrocolloid Industry Revenue (million), by Function 2025 & 2033
- Figure 17: North America Hydrocolloid Industry Revenue Share (%), by Function 2025 & 2033
- Figure 18: North America Hydrocolloid Industry Revenue (million), by Application 2025 & 2033
- Figure 19: North America Hydrocolloid Industry Revenue Share (%), by Application 2025 & 2033
- Figure 20: North America Hydrocolloid Industry Revenue (million), by Country 2025 & 2033
- Figure 21: North America Hydrocolloid Industry Revenue Share (%), by Country 2025 & 2033
- Figure 22: Europe Hydrocolloid Industry Revenue (million), by Source 2025 & 2033
- Figure 23: Europe Hydrocolloid Industry Revenue Share (%), by Source 2025 & 2033
- Figure 24: Europe Hydrocolloid Industry Revenue (million), by Type 2025 & 2033
- Figure 25: Europe Hydrocolloid Industry Revenue Share (%), by Type 2025 & 2033
- Figure 26: Europe Hydrocolloid Industry Revenue (million), by Function 2025 & 2033
- Figure 27: Europe Hydrocolloid Industry Revenue Share (%), by Function 2025 & 2033
- Figure 28: Europe Hydrocolloid Industry Revenue (million), by Application 2025 & 2033
- Figure 29: Europe Hydrocolloid Industry Revenue Share (%), by Application 2025 & 2033
- Figure 30: Europe Hydrocolloid Industry Revenue (million), by Country 2025 & 2033
- Figure 31: Europe Hydrocolloid Industry Revenue Share (%), by Country 2025 & 2033
- Figure 32: South America Hydrocolloid Industry Revenue (million), by Source 2025 & 2033
- Figure 33: South America Hydrocolloid Industry Revenue Share (%), by Source 2025 & 2033
- Figure 34: South America Hydrocolloid Industry Revenue (million), by Type 2025 & 2033
- Figure 35: South America Hydrocolloid Industry Revenue Share (%), by Type 2025 & 2033
- Figure 36: South America Hydrocolloid Industry Revenue (million), by Function 2025 & 2033
- Figure 37: South America Hydrocolloid Industry Revenue Share (%), by Function 2025 & 2033
- Figure 38: South America Hydrocolloid Industry Revenue (million), by Application 2025 & 2033
- Figure 39: South America Hydrocolloid Industry Revenue Share (%), by Application 2025 & 2033
- Figure 40: South America Hydrocolloid Industry Revenue (million), by Country 2025 & 2033
- Figure 41: South America Hydrocolloid Industry Revenue Share (%), by Country 2025 & 2033
- Figure 42: Middle East and Africa Hydrocolloid Industry Revenue (million), by Source 2025 & 2033
- Figure 43: Middle East and Africa Hydrocolloid Industry Revenue Share (%), by Source 2025 & 2033
- Figure 44: Middle East and Africa Hydrocolloid Industry Revenue (million), by Type 2025 & 2033
- Figure 45: Middle East and Africa Hydrocolloid Industry Revenue Share (%), by Type 2025 & 2033
- Figure 46: Middle East and Africa Hydrocolloid Industry Revenue (million), by Function 2025 & 2033
- Figure 47: Middle East and Africa Hydrocolloid Industry Revenue Share (%), by Function 2025 & 2033
- Figure 48: Middle East and Africa Hydrocolloid Industry Revenue (million), by Application 2025 & 2033
- Figure 49: Middle East and Africa Hydrocolloid Industry Revenue Share (%), by Application 2025 & 2033
- Figure 50: Middle East and Africa Hydrocolloid Industry Revenue (million), by Country 2025 & 2033
- Figure 51: Middle East and Africa Hydrocolloid Industry Revenue Share (%), by Country 2025 & 2033
List of Tables
- Table 1: Global Hydrocolloid Industry Revenue million Forecast, by Source 2020 & 2033
- Table 2: Global Hydrocolloid Industry Revenue million Forecast, by Type 2020 & 2033
- Table 3: Global Hydrocolloid Industry Revenue million Forecast, by Function 2020 & 2033
- Table 4: Global Hydrocolloid Industry Revenue million Forecast, by Application 2020 & 2033
- Table 5: Global Hydrocolloid Industry Revenue million Forecast, by Region 2020 & 2033
- Table 6: Global Hydrocolloid Industry Revenue million Forecast, by Source 2020 & 2033
- Table 7: Global Hydrocolloid Industry Revenue million Forecast, by Type 2020 & 2033
- Table 8: Global Hydrocolloid Industry Revenue million Forecast, by Function 2020 & 2033
- Table 9: Global Hydrocolloid Industry Revenue million Forecast, by Application 2020 & 2033
- Table 10: Global Hydrocolloid Industry Revenue million Forecast, by Country 2020 & 2033
- Table 11: China Hydrocolloid Industry Revenue (million) Forecast, by Application 2020 & 2033
- Table 12: India Hydrocolloid Industry Revenue (million) Forecast, by Application 2020 & 2033
- Table 13: Japan Hydrocolloid Industry Revenue (million) Forecast, by Application 2020 & 2033
- Table 14: South Korea Hydrocolloid Industry Revenue (million) Forecast, by Application 2020 & 2033
- Table 15: Rest of Asia Pacific Hydrocolloid Industry Revenue (million) Forecast, by Application 2020 & 2033
- Table 16: Global Hydrocolloid Industry Revenue million Forecast, by Source 2020 & 2033
- Table 17: Global Hydrocolloid Industry Revenue million Forecast, by Type 2020 & 2033
- Table 18: Global Hydrocolloid Industry Revenue million Forecast, by Function 2020 & 2033
- Table 19: Global Hydrocolloid Industry Revenue million Forecast, by Application 2020 & 2033
- Table 20: Global Hydrocolloid Industry Revenue million Forecast, by Country 2020 & 2033
- Table 21: United States Hydrocolloid Industry Revenue (million) Forecast, by Application 2020 & 2033
- Table 22: Canada Hydrocolloid Industry Revenue (million) Forecast, by Application 2020 & 2033
- Table 23: Mexico Hydrocolloid Industry Revenue (million) Forecast, by Application 2020 & 2033
- Table 24: Global Hydrocolloid Industry Revenue million Forecast, by Source 2020 & 2033
- Table 25: Global Hydrocolloid Industry Revenue million Forecast, by Type 2020 & 2033
- Table 26: Global Hydrocolloid Industry Revenue million Forecast, by Function 2020 & 2033
- Table 27: Global Hydrocolloid Industry Revenue million Forecast, by Application 2020 & 2033
- Table 28: Global Hydrocolloid Industry Revenue million Forecast, by Country 2020 & 2033
- Table 29: Germany Hydrocolloid Industry Revenue (million) Forecast, by Application 2020 & 2033
- Table 30: United Kingdom Hydrocolloid Industry Revenue (million) Forecast, by Application 2020 & 2033
- Table 31: Italy Hydrocolloid Industry Revenue (million) Forecast, by Application 2020 & 2033
- Table 32: France Hydrocolloid Industry Revenue (million) Forecast, by Application 2020 & 2033
- Table 33: Rest of Europe Hydrocolloid Industry Revenue (million) Forecast, by Application 2020 & 2033
- Table 34: Global Hydrocolloid Industry Revenue million Forecast, by Source 2020 & 2033
- Table 35: Global Hydrocolloid Industry Revenue million Forecast, by Type 2020 & 2033
- Table 36: Global Hydrocolloid Industry Revenue million Forecast, by Function 2020 & 2033
- Table 37: Global Hydrocolloid Industry Revenue million Forecast, by Application 2020 & 2033
- Table 38: Global Hydrocolloid Industry Revenue million Forecast, by Country 2020 & 2033
- Table 39: Brazil Hydrocolloid Industry Revenue (million) Forecast, by Application 2020 & 2033
- Table 40: Argentina Hydrocolloid Industry Revenue (million) Forecast, by Application 2020 & 2033
- Table 41: Rest of South America Hydrocolloid Industry Revenue (million) Forecast, by Application 2020 & 2033
- Table 42: Global Hydrocolloid Industry Revenue million Forecast, by Source 2020 & 2033
- Table 43: Global Hydrocolloid Industry Revenue million Forecast, by Type 2020 & 2033
- Table 44: Global Hydrocolloid Industry Revenue million Forecast, by Function 2020 & 2033
- Table 45: Global Hydrocolloid Industry Revenue million Forecast, by Application 2020 & 2033
- Table 46: Global Hydrocolloid Industry Revenue million Forecast, by Country 2020 & 2033
- Table 47: Saudi Arabia Hydrocolloid Industry Revenue (million) Forecast, by Application 2020 & 2033
- Table 48: South Africa Hydrocolloid Industry Revenue (million) Forecast, by Application 2020 & 2033
- Table 49: Rest of Middle East and Africa Hydrocolloid Industry Revenue (million) Forecast, by Application 2020 & 2033
Frequently Asked Questions
1. What is the projected Compound Annual Growth Rate (CAGR) of the Hydrocolloid Industry?
The projected CAGR is approximately 5%.
2. Which companies are prominent players in the Hydrocolloid Industry?
Key companies in the market include ADM, Cargill Incorporated, NOREVO, J F Hydrocolloids Inc, Dupont, Ashland, DSM, AGARMEX SA DE CV, Ingredion Incorporated, B Braun Melsungen AG, Tate & Lyle*List Not Exhaustive, CP Kelco U S Inc.
3. What are the main segments of the Hydrocolloid Industry?
The market segments include Source, Type, Function, Application.
4. Can you provide details about the market size?
The market size is estimated to be USD 13614.8 million as of 2022.
5. What are some drivers contributing to market growth?
Growing Demand in the Food and Beverage Industry; Increased R&D and Innovations in Hydrocolloids.
6. What are the notable trends driving market growth?
Increasing Demand from the Gelatin Segment.
7. Are there any restraints impacting market growth?
Adherence to International Quality Standards and Regulations; Unfavorable Conditions Arising Due to the COVID-19 Outbreak.
8. Can you provide examples of recent developments in the market?
In September 2021, Ingredion signed a new strategic distribution agreement with Batory Foods that consolidates Ingredion's reach in the west and central midwest in the United States.
9. What pricing options are available for accessing the report?
Pricing options include single-user, multi-user, and enterprise licenses priced at USD 4750, USD 5250, and USD 8750 respectively.
10. Is the market size provided in terms of value or volume?
The market size is provided in terms of value, measured in million.
11. Are there any specific market keywords associated with the report?
Yes, the market keyword associated with the report is "Hydrocolloid Industry," which aids in identifying and referencing the specific market segment covered.
12. How do I determine which pricing option suits my needs best?
The pricing options vary based on user requirements and access needs. Individual users may opt for single-user licenses, while businesses requiring broader access may choose multi-user or enterprise licenses for cost-effective access to the report.
13. Are there any additional resources or data provided in the Hydrocolloid Industry report?
While the report offers comprehensive insights, it's advisable to review the specific contents or supplementary materials provided to ascertain if additional resources or data are available.
14. How can I stay updated on further developments or reports in the Hydrocolloid Industry?
To stay informed about further developments, trends, and reports in the Hydrocolloid Industry, consider subscribing to industry newsletters, following relevant companies and organizations, or regularly checking reputable industry news sources and publications.
Methodology
Step 1 - Identification of Relevant Samples Size from Population Database


Step 2 - Approaches for Defining Global Market Size (Value, Volume* & Price*)

Note*: In applicable scenarios
Step 3 - Data Sources
Primary Research
- Web Analytics
- Survey Reports
- Research Institute
- Latest Research Reports
- Opinion Leaders
Secondary Research
- Annual Reports
- White Paper
- Latest Press Release
- Industry Association
- Paid Database
- Investor Presentations

Step 4 - Data Triangulation
Involves using different sources of information in order to increase the validity of a study
These sources are likely to be stakeholders in a program - participants, other researchers, program staff, other community members, and so on.
Then we put all data in single framework & apply various statistical tools to find out the dynamic on the market.
During the analysis stage, feedback from the stakeholder groups would be compared to determine areas of agreement as well as areas of divergence