

Key Insights
The global hydrogen gas market is poised for significant expansion, projected to grow at a Compound Annual Growth Rate (CAGR) of 8.6%. This robust growth, with a market size of 204.86 billion in the base year 2025, is propelled by several key factors. The accelerating adoption of fuel cell vehicles (FCVs) is a primary driver, positioning hydrogen as a clean and efficient alternative fuel. The expanding ammonia and methanol production sectors also represent substantial demand, as does the burgeoning renewable energy sector, with green hydrogen production gaining prominence for energy storage and industrial applications. Further demand stems from the refining and Direct Reduced Iron (DRI) industries. While pipeline distribution remains prevalent, the utilization of high-pressure tube trailers and cylinders is increasing to serve diverse applications and regions. Challenges, however, include the high cost of production and infrastructure development, particularly for green hydrogen, alongside inherent limitations in hydrogen storage and transportation. Nevertheless, favorable government incentives, technological advancements, and increasing environmental awareness underpin a positive long-term market outlook.
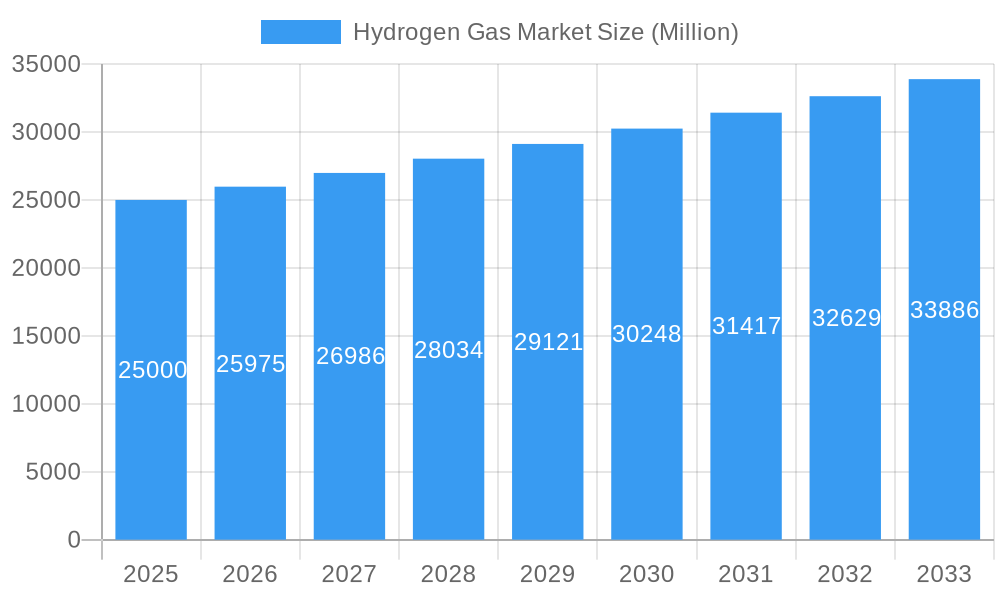
Hydrogen Gas Market Market Size (In Billion)
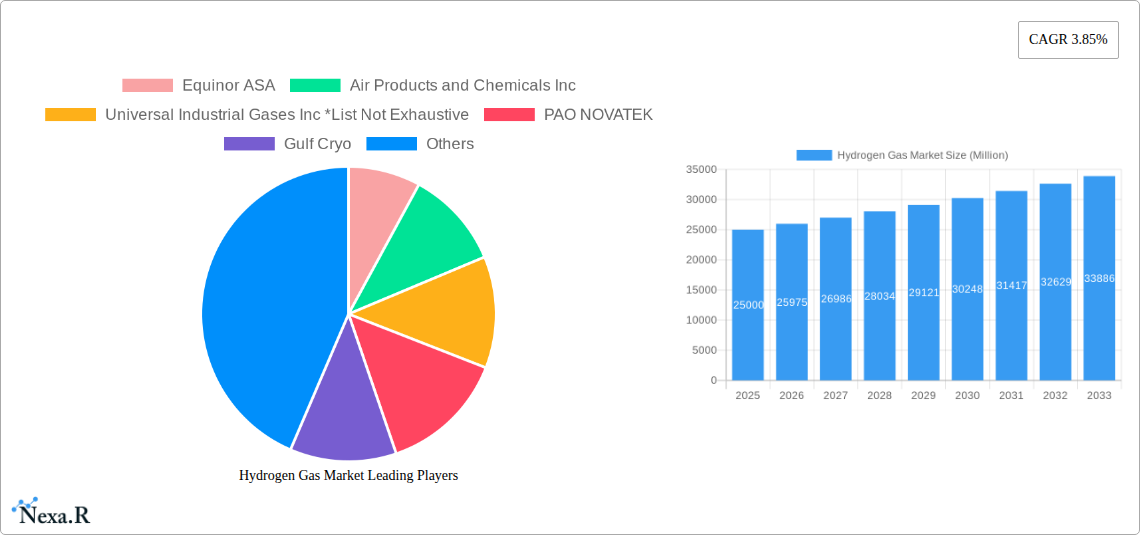
Geographically, the market exhibits significant shares in Asia Pacific (led by China and India), North America, and Europe. Industrial hubs and supportive government initiatives are influencing regional growth patterns. Key market participants include Equinor ASA, Air Products and Chemicals Inc., Universal Industrial Gases Inc., and PAO NOVATEK, among others. These entities are actively engaged in R&D, capacity expansion, and strategic collaborations to enhance their market standing. The competitive environment is dynamic, characterized by the presence of both established leaders and emerging players, alongside strategic alliances between energy and technology firms aimed at accelerating hydrogen adoption. Future market evolution is expected to involve further consolidation and innovation, driven by ongoing technological progress and supportive policy frameworks.
Hydrogen Gas Market Company Market Share
Hydrogen Gas Market: A Comprehensive Market Report (2019-2033)
This comprehensive report provides an in-depth analysis of the Hydrogen Gas Market, encompassing market dynamics, growth trends, regional dominance, product landscape, and key players. With a study period spanning 2019-2033, a base year of 2025, and a forecast period of 2025-2033, this report offers invaluable insights for industry professionals, investors, and strategic decision-makers. The report covers both parent and child markets, including detailed breakdowns by distribution methods (Pipelines, High-Pressure Tube Trailers, Cylinders) and applications (Ammonia, Methanol, Refining, Direct Reduced Iron (DRI), Fuel Cell Vehicles (FCV), Other Applications). The market size is projected in Million units.
Hydrogen Gas Market Dynamics & Structure
The hydrogen gas market is characterized by a moderately concentrated landscape, with key players such as Air Products and Chemicals Inc, Linde plc, and Air Liquide holding significant market share. However, the market is also witnessing increased participation from smaller players and startups, particularly in niche segments like green hydrogen production. Technological innovation is a major driver, with advancements in electrolysis, purification, and storage technologies continuously expanding the market's potential. Regulatory frameworks, particularly government incentives and policies promoting clean energy transition, are significantly influencing market growth. While natural gas remains a major competitor, the growing environmental concerns are shifting the balance towards hydrogen as a cleaner alternative fuel. The market is experiencing significant M&A activity, with xx major deals recorded in the past five years, averaging a value of xx million units per deal. This consolidation reflects the industry's maturation and the pursuit of economies of scale.
- Market Concentration: Moderately concentrated, with top players holding xx% market share.
- Technological Innovation: Rapid advancements in electrolysis, storage, and transportation are key drivers.
- Regulatory Landscape: Government incentives and carbon reduction policies are strongly supportive.
- Competitive Substitutes: Natural gas is the primary competitor, but the environmental push favors hydrogen.
- M&A Activity: xx major deals in the last five years, indicating consolidation and growth.
- Innovation Barriers: High initial capital investment, technological complexities, and lack of standardized infrastructure.
Hydrogen Gas Market Growth Trends & Insights
The hydrogen gas market has witnessed robust growth in recent years, with a CAGR of xx% between 2019 and 2024. This growth is primarily driven by the increasing demand for clean energy solutions and the rising adoption of hydrogen in various industries. The market size is estimated to be xx million units in 2025, and is projected to reach xx million units by 2033. The adoption rate is accelerating, especially in sectors like transportation and industrial applications. Technological disruptions, such as the development of cost-effective green hydrogen production methods, are significantly impacting market dynamics. Consumer behavior is also shifting towards sustainable energy choices, further fueling the demand for hydrogen. The market is expected to experience a significant shift towards green hydrogen as renewable energy sources become more prevalent and cost-effective. This will drive further growth and reshape the competitive landscape.
Dominant Regions, Countries, or Segments in Hydrogen Gas Market
The European Union currently leads the hydrogen gas market, driven by strong government support for clean energy initiatives and a robust industrial base. Asia-Pacific is also expected to witness significant growth, fueled by expanding industrial applications and increasing investments in hydrogen infrastructure. The refining and ammonia production segments represent the largest market share in terms of application, accounting for approximately xx% and xx% respectively. In terms of distribution, pipelines dominate the market currently, holding xx% share, while high-pressure tube trailers and cylinders are gaining traction for specialized applications and localized distribution.
- Key Regional Drivers: EU (strong government policies), Asia-Pacific (industrial growth, investments).
- Leading Segments: Refining (xx% market share), Ammonia (xx% market share), Pipelines (xx% distribution share).
- Growth Potential: Asia-Pacific (high growth potential), Fuel Cell Vehicles (FCV) segment.
- Dominance Factors: Favorable government policies, established infrastructure, and industrial demand.
Hydrogen Gas Market Product Landscape
Hydrogen gas products are primarily differentiated by their production methods (grey, blue, green) and purity levels. Technological advancements focus on improving production efficiency, reducing costs, and enhancing storage and transportation capabilities. Key advancements include the development of more efficient electrolyzers, improved purification technologies, and innovative storage solutions like liquid hydrogen tanks and solid-state storage materials. The unique selling propositions often focus on purity, cost-effectiveness, and sustainability.
Key Drivers, Barriers & Challenges in Hydrogen Gas Market
Key Drivers:
- Increasing demand for clean energy and decarbonization initiatives.
- Government incentives and supportive policies promoting hydrogen adoption.
- Technological advancements in production, storage, and transportation.
- Growing demand for hydrogen in various industries (refining, ammonia production, etc.).
Key Challenges & Restraints:
- High initial investment costs for production and infrastructure development.
- Lack of standardized infrastructure and widespread distribution networks.
- Safety concerns associated with hydrogen storage and transportation.
- Competition from other alternative fuels and energy sources.
- Intermittency of renewable energy sources for green hydrogen production.
Emerging Opportunities in Hydrogen Gas Market
- Growing demand for hydrogen in the transportation sector (fuel cell vehicles).
- Expansion of hydrogen energy storage solutions for grid stabilization.
- Development of hydrogen-based industrial processes in chemical and steel industries.
- Opportunities in developing countries with emerging clean energy initiatives.
- Technological innovations in cost-effective hydrogen production and storage.
Growth Accelerators in the Hydrogen Gas Market Industry
Long-term growth will be propelled by continued technological breakthroughs in green hydrogen production, decreasing production costs, and the expansion of supportive government policies and regulations. Strategic partnerships between energy companies, technology providers, and end-users are also accelerating market development. The increasing focus on hydrogen as a critical component of a diversified energy mix and efforts to establish robust hydrogen infrastructure will contribute substantially to future market expansion.
Key Players Shaping the Hydrogen Gas Market Market
- Equinor ASA
- Air Products and Chemicals Inc
- Universal Industrial Gases Inc
- PAO NOVATEK
- Gulf Cryo
- Lords Chloro Alkali Limited
- Gujarat Alkalies and Chemicals Limited
- Matheson Tri-Gas Inc
- BASF SE
- Aditya Birla Chemicals
- Linde plc
- TAIYO NIPPON SANSO CORPORATION
- Air Liquide
- Messer SE & Co KGaA
Notable Milestones in Hydrogen Gas Market Sector
- June 2022: BASF and Shell collaborated to advance green hydrogen production technologies.
- June 2022: Equinor and SSE Thermal acquired Triton Power, aiming for hydrogen-based power generation.
- July 2022: Air Products and VPI partnered to develop the Humber Hydrogen Hub (800 MW facility).
In-Depth Hydrogen Gas Market Market Outlook
The future of the hydrogen gas market looks bright, with strong growth potential driven by increasing environmental concerns and supportive government policies. The focus on green hydrogen and the development of efficient and cost-effective production technologies will be key factors driving future market expansion. Strategic partnerships and investments in infrastructure development will play a crucial role in unlocking the full potential of this market, paving the way for significant growth and widespread adoption across various sectors.
Hydrogen Gas Market Segmentation
-
1. Distribution
- 1.1. Pipelines
- 1.2. High-pressure Tube Trailers
- 1.3. Cylinders
-
2. Application
- 2.1. Ammonia
- 2.2. Methanol
- 2.3. Refining
- 2.4. Direct Reduced Iron (DRI)
- 2.5. Fuel Cell Vehicles (FCV)
- 2.6. Other Ap
Hydrogen Gas Market Segmentation By Geography
-
1. Asia Pacific
- 1.1. China
- 1.2. India
- 1.3. Japan
- 1.4. South Korea
- 1.5. Malaysia
- 1.6. Thailand
- 1.7. Indonesia
- 1.8. Vietnam
- 1.9. Rest of Asia Pacific
-
2. North America
- 2.1. United States
- 2.2. Canada
- 2.3. Mexico
-
3. Europe
- 3.1. Germany
- 3.2. United Kingdom
- 3.3. Italy
- 3.4. France
- 3.5. Spain
- 3.6. NORDIC
- 3.7. Turkey
- 3.8. Russia
- 3.9. Rest of Europe
-
4. South America
- 4.1. Brazil
- 4.2. Argentina
- 4.3. Colombia
- 4.4. Rest of South America
-
5. Middle East and Africa
- 5.1. Saudi Arabia
- 5.2. South Africa
- 5.3. Nigeria
- 5.4. Qatar
- 5.5. Egypt
- 5.6. United Arab Emirates
- 5.7. Rest of Middle East and Africa
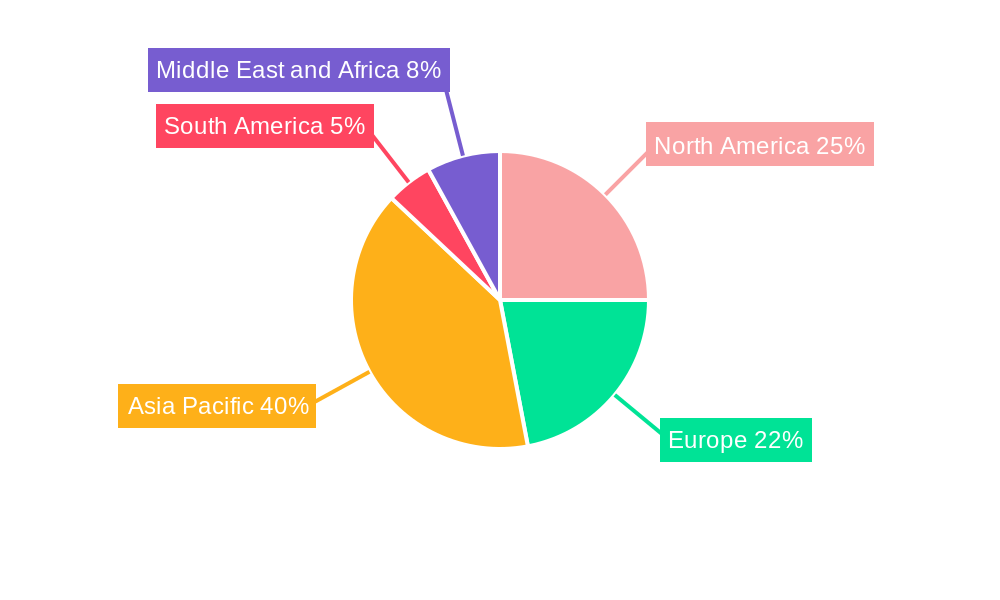
Hydrogen Gas Market Regional Market Share
Geographic Coverage of Hydrogen Gas Market
Hydrogen Gas Market REPORT HIGHLIGHTS
| Aspects | Details |
|---|---|
| Study Period | 2020-2034 |
| Base Year | 2025 |
| Estimated Year | 2026 |
| Forecast Period | 2026-2034 |
| Historical Period | 2020-2025 |
| Growth Rate | CAGR of 8.6% from 2020-2034 |
| Segmentation |
|
Table of Contents
- 1. Introduction
- 1.1. Research Scope
- 1.2. Market Segmentation
- 1.3. Research Objective
- 1.4. Definitions and Assumptions
- 2. Executive Summary
- 2.1. Market Snapshot
- 3. Market Dynamics
- 3.1. Market Drivers
- 3.2. Market Restrains
- 3.3. Market Trends
- 3.4. Market Opportunities
- 4. Market Factor Analysis
- 4.1. Porters Five Forces
- 4.1.1. Bargaining Power of Suppliers
- 4.1.2. Bargaining Power of Buyers
- 4.1.3. Threat of New Entrants
- 4.1.4. Threat of Substitutes
- 4.1.5. Competitive Rivalry
- 4.2. PESTEL analysis
- 4.3. BCG Analysis
- 4.3.1. Stars (High Growth, High Market Share)
- 4.3.2. Cash Cows (Low Growth, High Market Share)
- 4.3.3. Question Mark (High Growth, Low Market Share)
- 4.3.4. Dogs (Low Growth, Low Market Share)
- 4.4. Ansoff Matrix Analysis
- 4.5. Supply Chain Analysis
- 4.6. Regulatory Landscape
- 4.7. Current Market Potential and Opportunity Assessment (TAM–SAM–SOM Framework)
- 4.8. NRP Analyst Note
- 4.1. Porters Five Forces
- 5. Market Analysis, Insights and Forecast 2021-2033
- 5.1. Market Analysis, Insights and Forecast - by Distribution
- 5.1.1. Pipelines
- 5.1.2. High-pressure Tube Trailers
- 5.1.3. Cylinders
- 5.2. Market Analysis, Insights and Forecast - by Application
- 5.2.1. Ammonia
- 5.2.2. Methanol
- 5.2.3. Refining
- 5.2.4. Direct Reduced Iron (DRI)
- 5.2.5. Fuel Cell Vehicles (FCV)
- 5.2.6. Other Ap
- 5.3. Market Analysis, Insights and Forecast - by Region
- 5.3.1. Asia Pacific
- 5.3.2. North America
- 5.3.3. Europe
- 5.3.4. South America
- 5.3.5. Middle East and Africa
- 5.1. Market Analysis, Insights and Forecast - by Distribution
- 6. Global Hydrogen Gas Market Analysis, Insights and Forecast, 2021-2033
- 6.1. Market Analysis, Insights and Forecast - by Distribution
- 6.1.1. Pipelines
- 6.1.2. High-pressure Tube Trailers
- 6.1.3. Cylinders
- 6.2. Market Analysis, Insights and Forecast - by Application
- 6.2.1. Ammonia
- 6.2.2. Methanol
- 6.2.3. Refining
- 6.2.4. Direct Reduced Iron (DRI)
- 6.2.5. Fuel Cell Vehicles (FCV)
- 6.2.6. Other Ap
- 6.1. Market Analysis, Insights and Forecast - by Distribution
- 7. Asia Pacific Hydrogen Gas Market Analysis, Insights and Forecast, 2020-2032
- 7.1. Market Analysis, Insights and Forecast - by Distribution
- 7.1.1. Pipelines
- 7.1.2. High-pressure Tube Trailers
- 7.1.3. Cylinders
- 7.2. Market Analysis, Insights and Forecast - by Application
- 7.2.1. Ammonia
- 7.2.2. Methanol
- 7.2.3. Refining
- 7.2.4. Direct Reduced Iron (DRI)
- 7.2.5. Fuel Cell Vehicles (FCV)
- 7.2.6. Other Ap
- 7.1. Market Analysis, Insights and Forecast - by Distribution
- 8. North America Hydrogen Gas Market Analysis, Insights and Forecast, 2020-2032
- 8.1. Market Analysis, Insights and Forecast - by Distribution
- 8.1.1. Pipelines
- 8.1.2. High-pressure Tube Trailers
- 8.1.3. Cylinders
- 8.2. Market Analysis, Insights and Forecast - by Application
- 8.2.1. Ammonia
- 8.2.2. Methanol
- 8.2.3. Refining
- 8.2.4. Direct Reduced Iron (DRI)
- 8.2.5. Fuel Cell Vehicles (FCV)
- 8.2.6. Other Ap
- 8.1. Market Analysis, Insights and Forecast - by Distribution
- 9. Europe Hydrogen Gas Market Analysis, Insights and Forecast, 2020-2032
- 9.1. Market Analysis, Insights and Forecast - by Distribution
- 9.1.1. Pipelines
- 9.1.2. High-pressure Tube Trailers
- 9.1.3. Cylinders
- 9.2. Market Analysis, Insights and Forecast - by Application
- 9.2.1. Ammonia
- 9.2.2. Methanol
- 9.2.3. Refining
- 9.2.4. Direct Reduced Iron (DRI)
- 9.2.5. Fuel Cell Vehicles (FCV)
- 9.2.6. Other Ap
- 9.1. Market Analysis, Insights and Forecast - by Distribution
- 10. South America Hydrogen Gas Market Analysis, Insights and Forecast, 2020-2032
- 10.1. Market Analysis, Insights and Forecast - by Distribution
- 10.1.1. Pipelines
- 10.1.2. High-pressure Tube Trailers
- 10.1.3. Cylinders
- 10.2. Market Analysis, Insights and Forecast - by Application
- 10.2.1. Ammonia
- 10.2.2. Methanol
- 10.2.3. Refining
- 10.2.4. Direct Reduced Iron (DRI)
- 10.2.5. Fuel Cell Vehicles (FCV)
- 10.2.6. Other Ap
- 10.1. Market Analysis, Insights and Forecast - by Distribution
- 11. Middle East and Africa Hydrogen Gas Market Analysis, Insights and Forecast, 2020-2032
- 11.1. Market Analysis, Insights and Forecast - by Distribution
- 11.1.1. Pipelines
- 11.1.2. High-pressure Tube Trailers
- 11.1.3. Cylinders
- 11.2. Market Analysis, Insights and Forecast - by Application
- 11.2.1. Ammonia
- 11.2.2. Methanol
- 11.2.3. Refining
- 11.2.4. Direct Reduced Iron (DRI)
- 11.2.5. Fuel Cell Vehicles (FCV)
- 11.2.6. Other Ap
- 11.1. Market Analysis, Insights and Forecast - by Distribution
- 12. Competitive Analysis
- 12.1. Company Profiles
- 12.1.1 Equinor ASA
- 12.1.1.1. Company Overview
- 12.1.1.2. Products
- 12.1.1.3. Company Financials
- 12.1.1.4. SWOT Analysis
- 12.1.2 Air Products and Chemicals Inc
- 12.1.2.1. Company Overview
- 12.1.2.2. Products
- 12.1.2.3. Company Financials
- 12.1.2.4. SWOT Analysis
- 12.1.3 Universal Industrial Gases Inc *List Not Exhaustive
- 12.1.3.1. Company Overview
- 12.1.3.2. Products
- 12.1.3.3. Company Financials
- 12.1.3.4. SWOT Analysis
- 12.1.4 PAO NOVATEK
- 12.1.4.1. Company Overview
- 12.1.4.2. Products
- 12.1.4.3. Company Financials
- 12.1.4.4. SWOT Analysis
- 12.1.5 Gulf Cryo
- 12.1.5.1. Company Overview
- 12.1.5.2. Products
- 12.1.5.3. Company Financials
- 12.1.5.4. SWOT Analysis
- 12.1.6 Lords Chloro Alkali Limited
- 12.1.6.1. Company Overview
- 12.1.6.2. Products
- 12.1.6.3. Company Financials
- 12.1.6.4. SWOT Analysis
- 12.1.7 Gujarat Alkalies and Chemicals Limited
- 12.1.7.1. Company Overview
- 12.1.7.2. Products
- 12.1.7.3. Company Financials
- 12.1.7.4. SWOT Analysis
- 12.1.8 Matheson Tri-Gas Inc
- 12.1.8.1. Company Overview
- 12.1.8.2. Products
- 12.1.8.3. Company Financials
- 12.1.8.4. SWOT Analysis
- 12.1.9 BASF SE
- 12.1.9.1. Company Overview
- 12.1.9.2. Products
- 12.1.9.3. Company Financials
- 12.1.9.4. SWOT Analysis
- 12.1.10 Aditya Birla Chemicals
- 12.1.10.1. Company Overview
- 12.1.10.2. Products
- 12.1.10.3. Company Financials
- 12.1.10.4. SWOT Analysis
- 12.1.11 Linde plc
- 12.1.11.1. Company Overview
- 12.1.11.2. Products
- 12.1.11.3. Company Financials
- 12.1.11.4. SWOT Analysis
- 12.1.12 TAIYO NIPPON SANSO CORPORATION
- 12.1.12.1. Company Overview
- 12.1.12.2. Products
- 12.1.12.3. Company Financials
- 12.1.12.4. SWOT Analysis
- 12.1.13 Air Liquide
- 12.1.13.1. Company Overview
- 12.1.13.2. Products
- 12.1.13.3. Company Financials
- 12.1.13.4. SWOT Analysis
- 12.1.14 Messer SE & Co KGaA
- 12.1.14.1. Company Overview
- 12.1.14.2. Products
- 12.1.14.3. Company Financials
- 12.1.14.4. SWOT Analysis
- 12.1.1 Equinor ASA
- 12.2. Market Entropy
- 12.2.1 Company's Key Areas Served
- 12.2.2 Recent Developments
- 12.3. Company Market Share Analysis 2025
- 12.3.1 Top 5 Companies Market Share Analysis
- 12.3.2 Top 3 Companies Market Share Analysis
- 12.4. List of Potential Customers
- 13. Research Methodology
List of Figures
- Figure 1: Global Hydrogen Gas Market Revenue Breakdown (billion, %) by Region 2025 & 2033
- Figure 2: Global Hydrogen Gas Market Volume Breakdown (Million, %) by Region 2025 & 2033
- Figure 3: Asia Pacific Hydrogen Gas Market Revenue (billion), by Distribution 2025 & 2033
- Figure 4: Asia Pacific Hydrogen Gas Market Volume (Million), by Distribution 2025 & 2033
- Figure 5: Asia Pacific Hydrogen Gas Market Revenue Share (%), by Distribution 2025 & 2033
- Figure 6: Asia Pacific Hydrogen Gas Market Volume Share (%), by Distribution 2025 & 2033
- Figure 7: Asia Pacific Hydrogen Gas Market Revenue (billion), by Application 2025 & 2033
- Figure 8: Asia Pacific Hydrogen Gas Market Volume (Million), by Application 2025 & 2033
- Figure 9: Asia Pacific Hydrogen Gas Market Revenue Share (%), by Application 2025 & 2033
- Figure 10: Asia Pacific Hydrogen Gas Market Volume Share (%), by Application 2025 & 2033
- Figure 11: Asia Pacific Hydrogen Gas Market Revenue (billion), by Country 2025 & 2033
- Figure 12: Asia Pacific Hydrogen Gas Market Volume (Million), by Country 2025 & 2033
- Figure 13: Asia Pacific Hydrogen Gas Market Revenue Share (%), by Country 2025 & 2033
- Figure 14: Asia Pacific Hydrogen Gas Market Volume Share (%), by Country 2025 & 2033
- Figure 15: North America Hydrogen Gas Market Revenue (billion), by Distribution 2025 & 2033
- Figure 16: North America Hydrogen Gas Market Volume (Million), by Distribution 2025 & 2033
- Figure 17: North America Hydrogen Gas Market Revenue Share (%), by Distribution 2025 & 2033
- Figure 18: North America Hydrogen Gas Market Volume Share (%), by Distribution 2025 & 2033
- Figure 19: North America Hydrogen Gas Market Revenue (billion), by Application 2025 & 2033
- Figure 20: North America Hydrogen Gas Market Volume (Million), by Application 2025 & 2033
- Figure 21: North America Hydrogen Gas Market Revenue Share (%), by Application 2025 & 2033
- Figure 22: North America Hydrogen Gas Market Volume Share (%), by Application 2025 & 2033
- Figure 23: North America Hydrogen Gas Market Revenue (billion), by Country 2025 & 2033
- Figure 24: North America Hydrogen Gas Market Volume (Million), by Country 2025 & 2033
- Figure 25: North America Hydrogen Gas Market Revenue Share (%), by Country 2025 & 2033
- Figure 26: North America Hydrogen Gas Market Volume Share (%), by Country 2025 & 2033
- Figure 27: Europe Hydrogen Gas Market Revenue (billion), by Distribution 2025 & 2033
- Figure 28: Europe Hydrogen Gas Market Volume (Million), by Distribution 2025 & 2033
- Figure 29: Europe Hydrogen Gas Market Revenue Share (%), by Distribution 2025 & 2033
- Figure 30: Europe Hydrogen Gas Market Volume Share (%), by Distribution 2025 & 2033
- Figure 31: Europe Hydrogen Gas Market Revenue (billion), by Application 2025 & 2033
- Figure 32: Europe Hydrogen Gas Market Volume (Million), by Application 2025 & 2033
- Figure 33: Europe Hydrogen Gas Market Revenue Share (%), by Application 2025 & 2033
- Figure 34: Europe Hydrogen Gas Market Volume Share (%), by Application 2025 & 2033
- Figure 35: Europe Hydrogen Gas Market Revenue (billion), by Country 2025 & 2033
- Figure 36: Europe Hydrogen Gas Market Volume (Million), by Country 2025 & 2033
- Figure 37: Europe Hydrogen Gas Market Revenue Share (%), by Country 2025 & 2033
- Figure 38: Europe Hydrogen Gas Market Volume Share (%), by Country 2025 & 2033
- Figure 39: South America Hydrogen Gas Market Revenue (billion), by Distribution 2025 & 2033
- Figure 40: South America Hydrogen Gas Market Volume (Million), by Distribution 2025 & 2033
- Figure 41: South America Hydrogen Gas Market Revenue Share (%), by Distribution 2025 & 2033
- Figure 42: South America Hydrogen Gas Market Volume Share (%), by Distribution 2025 & 2033
- Figure 43: South America Hydrogen Gas Market Revenue (billion), by Application 2025 & 2033
- Figure 44: South America Hydrogen Gas Market Volume (Million), by Application 2025 & 2033
- Figure 45: South America Hydrogen Gas Market Revenue Share (%), by Application 2025 & 2033
- Figure 46: South America Hydrogen Gas Market Volume Share (%), by Application 2025 & 2033
- Figure 47: South America Hydrogen Gas Market Revenue (billion), by Country 2025 & 2033
- Figure 48: South America Hydrogen Gas Market Volume (Million), by Country 2025 & 2033
- Figure 49: South America Hydrogen Gas Market Revenue Share (%), by Country 2025 & 2033
- Figure 50: South America Hydrogen Gas Market Volume Share (%), by Country 2025 & 2033
- Figure 51: Middle East and Africa Hydrogen Gas Market Revenue (billion), by Distribution 2025 & 2033
- Figure 52: Middle East and Africa Hydrogen Gas Market Volume (Million), by Distribution 2025 & 2033
- Figure 53: Middle East and Africa Hydrogen Gas Market Revenue Share (%), by Distribution 2025 & 2033
- Figure 54: Middle East and Africa Hydrogen Gas Market Volume Share (%), by Distribution 2025 & 2033
- Figure 55: Middle East and Africa Hydrogen Gas Market Revenue (billion), by Application 2025 & 2033
- Figure 56: Middle East and Africa Hydrogen Gas Market Volume (Million), by Application 2025 & 2033
- Figure 57: Middle East and Africa Hydrogen Gas Market Revenue Share (%), by Application 2025 & 2033
- Figure 58: Middle East and Africa Hydrogen Gas Market Volume Share (%), by Application 2025 & 2033
- Figure 59: Middle East and Africa Hydrogen Gas Market Revenue (billion), by Country 2025 & 2033
- Figure 60: Middle East and Africa Hydrogen Gas Market Volume (Million), by Country 2025 & 2033
- Figure 61: Middle East and Africa Hydrogen Gas Market Revenue Share (%), by Country 2025 & 2033
- Figure 62: Middle East and Africa Hydrogen Gas Market Volume Share (%), by Country 2025 & 2033
List of Tables
- Table 1: Global Hydrogen Gas Market Revenue billion Forecast, by Distribution 2020 & 2033
- Table 2: Global Hydrogen Gas Market Volume Million Forecast, by Distribution 2020 & 2033
- Table 3: Global Hydrogen Gas Market Revenue billion Forecast, by Application 2020 & 2033
- Table 4: Global Hydrogen Gas Market Volume Million Forecast, by Application 2020 & 2033
- Table 5: Global Hydrogen Gas Market Revenue billion Forecast, by Region 2020 & 2033
- Table 6: Global Hydrogen Gas Market Volume Million Forecast, by Region 2020 & 2033
- Table 7: Global Hydrogen Gas Market Revenue billion Forecast, by Distribution 2020 & 2033
- Table 8: Global Hydrogen Gas Market Volume Million Forecast, by Distribution 2020 & 2033
- Table 9: Global Hydrogen Gas Market Revenue billion Forecast, by Application 2020 & 2033
- Table 10: Global Hydrogen Gas Market Volume Million Forecast, by Application 2020 & 2033
- Table 11: Global Hydrogen Gas Market Revenue billion Forecast, by Country 2020 & 2033
- Table 12: Global Hydrogen Gas Market Volume Million Forecast, by Country 2020 & 2033
- Table 13: China Hydrogen Gas Market Revenue (billion) Forecast, by Application 2020 & 2033
- Table 14: China Hydrogen Gas Market Volume (Million) Forecast, by Application 2020 & 2033
- Table 15: India Hydrogen Gas Market Revenue (billion) Forecast, by Application 2020 & 2033
- Table 16: India Hydrogen Gas Market Volume (Million) Forecast, by Application 2020 & 2033
- Table 17: Japan Hydrogen Gas Market Revenue (billion) Forecast, by Application 2020 & 2033
- Table 18: Japan Hydrogen Gas Market Volume (Million) Forecast, by Application 2020 & 2033
- Table 19: South Korea Hydrogen Gas Market Revenue (billion) Forecast, by Application 2020 & 2033
- Table 20: South Korea Hydrogen Gas Market Volume (Million) Forecast, by Application 2020 & 2033
- Table 21: Malaysia Hydrogen Gas Market Revenue (billion) Forecast, by Application 2020 & 2033
- Table 22: Malaysia Hydrogen Gas Market Volume (Million) Forecast, by Application 2020 & 2033
- Table 23: Thailand Hydrogen Gas Market Revenue (billion) Forecast, by Application 2020 & 2033
- Table 24: Thailand Hydrogen Gas Market Volume (Million) Forecast, by Application 2020 & 2033
- Table 25: Indonesia Hydrogen Gas Market Revenue (billion) Forecast, by Application 2020 & 2033
- Table 26: Indonesia Hydrogen Gas Market Volume (Million) Forecast, by Application 2020 & 2033
- Table 27: Vietnam Hydrogen Gas Market Revenue (billion) Forecast, by Application 2020 & 2033
- Table 28: Vietnam Hydrogen Gas Market Volume (Million) Forecast, by Application 2020 & 2033
- Table 29: Rest of Asia Pacific Hydrogen Gas Market Revenue (billion) Forecast, by Application 2020 & 2033
- Table 30: Rest of Asia Pacific Hydrogen Gas Market Volume (Million) Forecast, by Application 2020 & 2033
- Table 31: Global Hydrogen Gas Market Revenue billion Forecast, by Distribution 2020 & 2033
- Table 32: Global Hydrogen Gas Market Volume Million Forecast, by Distribution 2020 & 2033
- Table 33: Global Hydrogen Gas Market Revenue billion Forecast, by Application 2020 & 2033
- Table 34: Global Hydrogen Gas Market Volume Million Forecast, by Application 2020 & 2033
- Table 35: Global Hydrogen Gas Market Revenue billion Forecast, by Country 2020 & 2033
- Table 36: Global Hydrogen Gas Market Volume Million Forecast, by Country 2020 & 2033
- Table 37: United States Hydrogen Gas Market Revenue (billion) Forecast, by Application 2020 & 2033
- Table 38: United States Hydrogen Gas Market Volume (Million) Forecast, by Application 2020 & 2033
- Table 39: Canada Hydrogen Gas Market Revenue (billion) Forecast, by Application 2020 & 2033
- Table 40: Canada Hydrogen Gas Market Volume (Million) Forecast, by Application 2020 & 2033
- Table 41: Mexico Hydrogen Gas Market Revenue (billion) Forecast, by Application 2020 & 2033
- Table 42: Mexico Hydrogen Gas Market Volume (Million) Forecast, by Application 2020 & 2033
- Table 43: Global Hydrogen Gas Market Revenue billion Forecast, by Distribution 2020 & 2033
- Table 44: Global Hydrogen Gas Market Volume Million Forecast, by Distribution 2020 & 2033
- Table 45: Global Hydrogen Gas Market Revenue billion Forecast, by Application 2020 & 2033
- Table 46: Global Hydrogen Gas Market Volume Million Forecast, by Application 2020 & 2033
- Table 47: Global Hydrogen Gas Market Revenue billion Forecast, by Country 2020 & 2033
- Table 48: Global Hydrogen Gas Market Volume Million Forecast, by Country 2020 & 2033
- Table 49: Germany Hydrogen Gas Market Revenue (billion) Forecast, by Application 2020 & 2033
- Table 50: Germany Hydrogen Gas Market Volume (Million) Forecast, by Application 2020 & 2033
- Table 51: United Kingdom Hydrogen Gas Market Revenue (billion) Forecast, by Application 2020 & 2033
- Table 52: United Kingdom Hydrogen Gas Market Volume (Million) Forecast, by Application 2020 & 2033
- Table 53: Italy Hydrogen Gas Market Revenue (billion) Forecast, by Application 2020 & 2033
- Table 54: Italy Hydrogen Gas Market Volume (Million) Forecast, by Application 2020 & 2033
- Table 55: France Hydrogen Gas Market Revenue (billion) Forecast, by Application 2020 & 2033
- Table 56: France Hydrogen Gas Market Volume (Million) Forecast, by Application 2020 & 2033
- Table 57: Spain Hydrogen Gas Market Revenue (billion) Forecast, by Application 2020 & 2033
- Table 58: Spain Hydrogen Gas Market Volume (Million) Forecast, by Application 2020 & 2033
- Table 59: NORDIC Hydrogen Gas Market Revenue (billion) Forecast, by Application 2020 & 2033
- Table 60: NORDIC Hydrogen Gas Market Volume (Million) Forecast, by Application 2020 & 2033
- Table 61: Turkey Hydrogen Gas Market Revenue (billion) Forecast, by Application 2020 & 2033
- Table 62: Turkey Hydrogen Gas Market Volume (Million) Forecast, by Application 2020 & 2033
- Table 63: Russia Hydrogen Gas Market Revenue (billion) Forecast, by Application 2020 & 2033
- Table 64: Russia Hydrogen Gas Market Volume (Million) Forecast, by Application 2020 & 2033
- Table 65: Rest of Europe Hydrogen Gas Market Revenue (billion) Forecast, by Application 2020 & 2033
- Table 66: Rest of Europe Hydrogen Gas Market Volume (Million) Forecast, by Application 2020 & 2033
- Table 67: Global Hydrogen Gas Market Revenue billion Forecast, by Distribution 2020 & 2033
- Table 68: Global Hydrogen Gas Market Volume Million Forecast, by Distribution 2020 & 2033
- Table 69: Global Hydrogen Gas Market Revenue billion Forecast, by Application 2020 & 2033
- Table 70: Global Hydrogen Gas Market Volume Million Forecast, by Application 2020 & 2033
- Table 71: Global Hydrogen Gas Market Revenue billion Forecast, by Country 2020 & 2033
- Table 72: Global Hydrogen Gas Market Volume Million Forecast, by Country 2020 & 2033
- Table 73: Brazil Hydrogen Gas Market Revenue (billion) Forecast, by Application 2020 & 2033
- Table 74: Brazil Hydrogen Gas Market Volume (Million) Forecast, by Application 2020 & 2033
- Table 75: Argentina Hydrogen Gas Market Revenue (billion) Forecast, by Application 2020 & 2033
- Table 76: Argentina Hydrogen Gas Market Volume (Million) Forecast, by Application 2020 & 2033
- Table 77: Colombia Hydrogen Gas Market Revenue (billion) Forecast, by Application 2020 & 2033
- Table 78: Colombia Hydrogen Gas Market Volume (Million) Forecast, by Application 2020 & 2033
- Table 79: Rest of South America Hydrogen Gas Market Revenue (billion) Forecast, by Application 2020 & 2033
- Table 80: Rest of South America Hydrogen Gas Market Volume (Million) Forecast, by Application 2020 & 2033
- Table 81: Global Hydrogen Gas Market Revenue billion Forecast, by Distribution 2020 & 2033
- Table 82: Global Hydrogen Gas Market Volume Million Forecast, by Distribution 2020 & 2033
- Table 83: Global Hydrogen Gas Market Revenue billion Forecast, by Application 2020 & 2033
- Table 84: Global Hydrogen Gas Market Volume Million Forecast, by Application 2020 & 2033
- Table 85: Global Hydrogen Gas Market Revenue billion Forecast, by Country 2020 & 2033
- Table 86: Global Hydrogen Gas Market Volume Million Forecast, by Country 2020 & 2033
- Table 87: Saudi Arabia Hydrogen Gas Market Revenue (billion) Forecast, by Application 2020 & 2033
- Table 88: Saudi Arabia Hydrogen Gas Market Volume (Million) Forecast, by Application 2020 & 2033
- Table 89: South Africa Hydrogen Gas Market Revenue (billion) Forecast, by Application 2020 & 2033
- Table 90: South Africa Hydrogen Gas Market Volume (Million) Forecast, by Application 2020 & 2033
- Table 91: Nigeria Hydrogen Gas Market Revenue (billion) Forecast, by Application 2020 & 2033
- Table 92: Nigeria Hydrogen Gas Market Volume (Million) Forecast, by Application 2020 & 2033
- Table 93: Qatar Hydrogen Gas Market Revenue (billion) Forecast, by Application 2020 & 2033
- Table 94: Qatar Hydrogen Gas Market Volume (Million) Forecast, by Application 2020 & 2033
- Table 95: Egypt Hydrogen Gas Market Revenue (billion) Forecast, by Application 2020 & 2033
- Table 96: Egypt Hydrogen Gas Market Volume (Million) Forecast, by Application 2020 & 2033
- Table 97: United Arab Emirates Hydrogen Gas Market Revenue (billion) Forecast, by Application 2020 & 2033
- Table 98: United Arab Emirates Hydrogen Gas Market Volume (Million) Forecast, by Application 2020 & 2033
- Table 99: Rest of Middle East and Africa Hydrogen Gas Market Revenue (billion) Forecast, by Application 2020 & 2033
- Table 100: Rest of Middle East and Africa Hydrogen Gas Market Volume (Million) Forecast, by Application 2020 & 2033
Frequently Asked Questions
1. What is the projected Compound Annual Growth Rate (CAGR) of the Hydrogen Gas Market?
The projected CAGR is approximately 8.6%.
2. Which companies are prominent players in the Hydrogen Gas Market?
Key companies in the market include Equinor ASA, Air Products and Chemicals Inc, Universal Industrial Gases Inc *List Not Exhaustive, PAO NOVATEK, Gulf Cryo, Lords Chloro Alkali Limited, Gujarat Alkalies and Chemicals Limited, Matheson Tri-Gas Inc, BASF SE, Aditya Birla Chemicals, Linde plc, TAIYO NIPPON SANSO CORPORATION, Air Liquide, Messer SE & Co KGaA.
3. What are the main segments of the Hydrogen Gas Market?
The market segments include Distribution, Application.
4. Can you provide details about the market size?
The market size is estimated to be USD 204.86 billion as of 2022.
5. What are some drivers contributing to market growth?
Increasing Demand From Chemical Industry; Expanding Usage Of Hydrogen In Refinery.
6. What are the notable trends driving market growth?
Ammonia Production to Dominate the Market Demand.
7. Are there any restraints impacting market growth?
High Production Cost Of Blue And Green Hydrogen; High Transportation And Storage Cost.
8. Can you provide examples of recent developments in the market?
July 2022: Air Products and VPI (a power generator company) signed a joint development agreement for driving the 'Humber Hydrogen Hub' or 'H3', which seeks to develop an 800 MW low-carbon hydrogen production facility in Immingham, United Kingdom.
9. What pricing options are available for accessing the report?
Pricing options include single-user, multi-user, and enterprise licenses priced at USD 4750, USD 5250, and USD 8750 respectively.
10. Is the market size provided in terms of value or volume?
The market size is provided in terms of value, measured in billion and volume, measured in Million.
11. Are there any specific market keywords associated with the report?
Yes, the market keyword associated with the report is "Hydrogen Gas Market," which aids in identifying and referencing the specific market segment covered.
12. How do I determine which pricing option suits my needs best?
The pricing options vary based on user requirements and access needs. Individual users may opt for single-user licenses, while businesses requiring broader access may choose multi-user or enterprise licenses for cost-effective access to the report.
13. Are there any additional resources or data provided in the Hydrogen Gas Market report?
While the report offers comprehensive insights, it's advisable to review the specific contents or supplementary materials provided to ascertain if additional resources or data are available.
14. How can I stay updated on further developments or reports in the Hydrogen Gas Market?
To stay informed about further developments, trends, and reports in the Hydrogen Gas Market, consider subscribing to industry newsletters, following relevant companies and organizations, or regularly checking reputable industry news sources and publications.
Methodology
Step 1 - Identification of Relevant Samples Size from Population Database


Step 2 - Approaches for Defining Global Market Size (Value, Volume* & Price*)

Note*: In applicable scenarios
Step 3 - Data Sources
Primary Research
- Web Analytics
- Survey Reports
- Research Institute
- Latest Research Reports
- Opinion Leaders
Secondary Research
- Annual Reports
- White Paper
- Latest Press Release
- Industry Association
- Paid Database
- Investor Presentations

Step 4 - Data Triangulation
Involves using different sources of information in order to increase the validity of a study
These sources are likely to be stakeholders in a program - participants, other researchers, program staff, other community members, and so on.
Then we put all data in single framework & apply various statistical tools to find out the dynamic on the market.
During the analysis stage, feedback from the stakeholder groups would be compared to determine areas of agreement as well as areas of divergence