

Key Insights
The global industrial coatings market is projected to reach $96.72 billion by 2025, expanding at a compound annual growth rate (CAGR) of 4.1%. Growth is propelled by burgeoning construction and manufacturing in emerging economies, alongside increasing adoption of sustainable, water-borne coatings driven by environmental regulations. The automotive sector's shift to electric and lightweight vehicles further fuels demand for specialized, durable coatings. Infrastructure development in North America and Europe also presents significant opportunities.
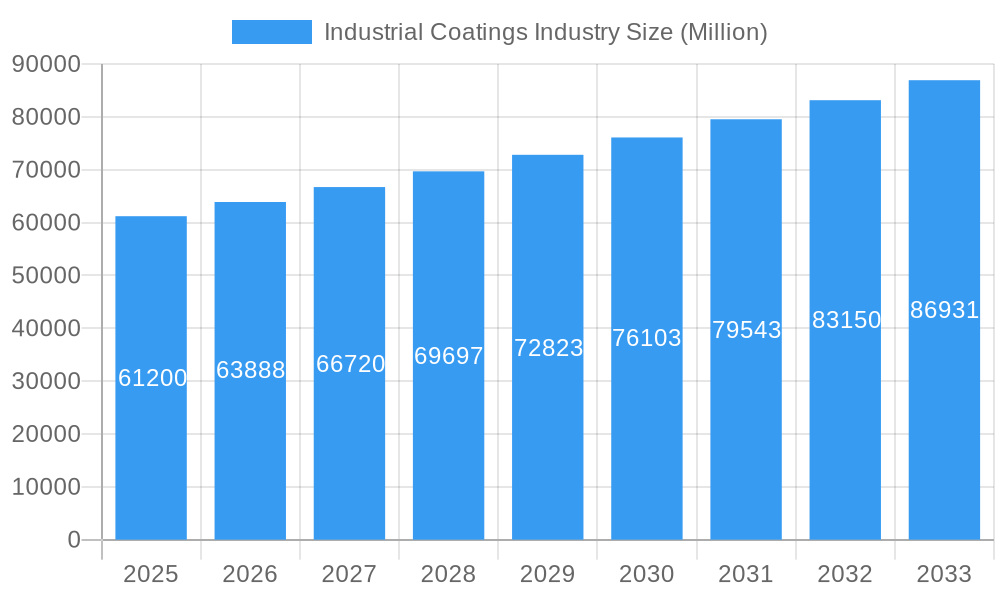
Industrial Coatings Industry Market Size (In Billion)
Key challenges include volatile raw material prices, stringent environmental regulations, and intense competition from major players. Navigating these requires a focus on innovation, sustainable high-performance coatings, and expansion into emerging markets. Market segmentation highlights epoxy and polyurethane as leading resin types, while water-borne coatings dominate the technology segment. General industrial and protective coatings represent significant end-use categories.
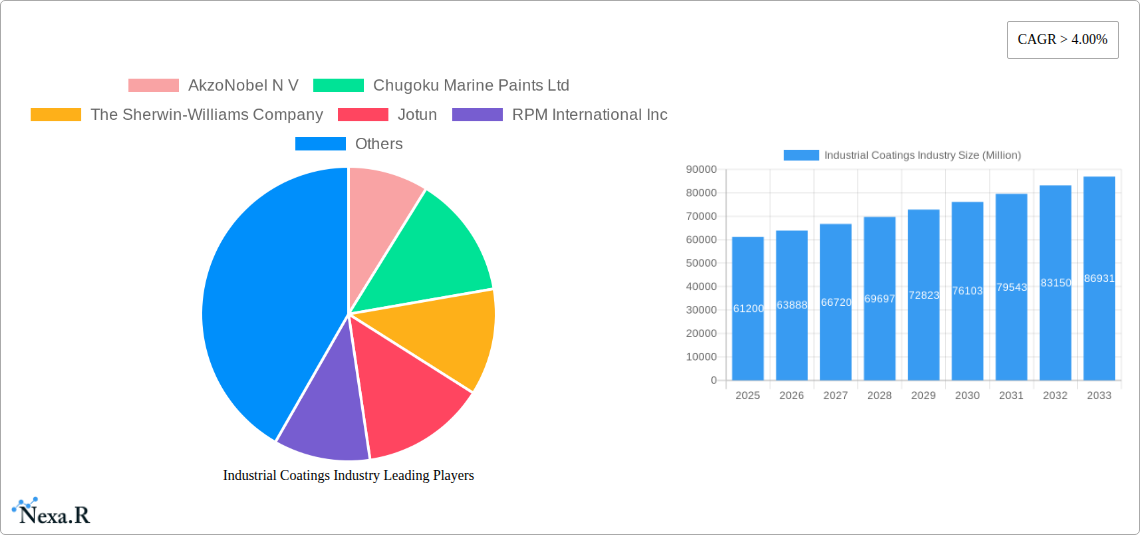
Industrial Coatings Industry Company Market Share
Industrial Coatings Industry Market Report: 2019-2033
This comprehensive report provides a detailed analysis of the global industrial coatings market, encompassing market dynamics, growth trends, regional dominance, product landscape, key players, and future outlook. The study period spans from 2019 to 2033, with 2025 serving as the base and estimated year. The report utilizes a combination of quantitative and qualitative data to offer actionable insights for industry professionals, investors, and stakeholders. Market values are presented in million units.
Industrial Coatings Industry Market Dynamics & Structure
The industrial coatings market is characterized by a moderately concentrated structure, with several multinational corporations holding significant market share. However, regional players and specialized niche businesses also contribute significantly. Technological innovation is a primary driver, with ongoing advancements in water-borne coatings, high-performance formulations, and sustainable solutions. Stringent environmental regulations and evolving safety standards influence product development and market competition. The presence of substitute materials, such as powder coatings and advanced surface treatments, adds further complexity to the competitive landscape. Mergers and acquisitions (M&A) activity is prevalent, reflecting consolidation trends and strategic expansion efforts.
- Market Concentration: The top 10 players account for approximately xx% of the global market (2024).
- Technological Innovation: Significant R&D investments are focused on improving durability, corrosion resistance, and sustainability.
- Regulatory Landscape: Compliance with VOC (Volatile Organic Compounds) limits and other environmental regulations is a key factor.
- Competitive Substitutes: Powder coatings and other surface treatment technologies present a competitive challenge.
- M&A Activity: Recent years have witnessed a significant number of acquisitions and mergers, exceeding xx deals in the past 5 years (2019-2024). This reflects industry consolidation and expansion into new markets.
- End-User Demographics: Growth is driven by increasing demand from construction, automotive, and infrastructure sectors.
Industrial Coatings Industry Growth Trends & Insights
The global industrial coatings market exhibited steady growth during the historical period (2019-2024), experiencing a Compound Annual Growth Rate (CAGR) of xx%. This growth is anticipated to continue during the forecast period (2025-2033), with a projected CAGR of xx%, driven by increasing infrastructure development globally, a rising demand for protective coatings in various industries, and the growing adoption of sustainable coating technologies. The shift towards water-borne coatings is a prominent trend, driven by environmental concerns and regulatory pressures. Market penetration of water-borne coatings is projected to reach xx% by 2033. Consumer behavior is increasingly influenced by sustainability considerations, leading to greater demand for eco-friendly coatings.
Dominant Regions, Countries, or Segments in Industrial Coatings Industry
North America and Europe currently hold significant market share in the industrial coatings industry. However, Asia-Pacific is projected to witness the highest growth rate during the forecast period, driven by rapid industrialization and infrastructure development.
Resin Segments:
- Epoxy: Holds a significant market share, driven by its excellent chemical resistance and mechanical strength.
- Polyurethane: Growing demand due to its versatility and superior performance characteristics.
- Acrylic: High demand due to its ease of application and cost-effectiveness in certain applications.
- Polyester: Steady market share driven by its use in various industrial applications.
- Other Resins: This segment demonstrates consistent growth, driven by the development of specialized coatings.
Technology Segments:
- Water-borne Coatings: Dominates market growth due to environmental benefits and regulatory pressures.
- Solvent-borne Coatings: While declining in market share, this segment remains significant due to its superior performance in certain applications.
- Other Technologies: Powder coatings are a rapidly growing sub-segment.
End-user Industries:
- General Industrial: This segment represents a significant market share.
- Protective Coatings: This sector is a key growth driver, with demand fueled by infrastructure development and corrosion prevention needs.
Industrial Coatings Industry Product Landscape
The industrial coatings market features a diverse product portfolio, encompassing a wide range of formulations tailored to specific end-use applications. Key innovations include high-performance coatings with enhanced durability, corrosion resistance, and UV protection. Advanced technologies, such as nano-coatings and self-healing coatings, are gaining traction. Unique selling propositions are centered on superior performance characteristics, ease of application, reduced environmental impact, and cost-effectiveness.
Key Drivers, Barriers & Challenges in Industrial Coatings Industry
Key Drivers:
- Increasing infrastructure spending globally
- Rising demand for corrosion protection
- Stringent environmental regulations promoting sustainable coating solutions
- Technological advancements in coating formulations.
Challenges and Restraints:
- Fluctuations in raw material prices
- Supply chain disruptions impacting production and delivery
- Stringent environmental regulations increasing production costs
- Intense competition from existing and emerging players.
Emerging Opportunities in Industrial Coatings Industry
- Growing demand for sustainable and eco-friendly coatings
- Increasing adoption of advanced coating technologies (e.g., nanotechnology)
- Expansion into new and untapped markets (e.g., renewable energy, aerospace)
- Development of specialized coatings for niche applications.
Growth Accelerators in the Industrial Coatings Industry Industry
Technological advancements in formulation chemistry, the development of high-performance coatings, and strategic partnerships across the value chain are key drivers for long-term growth. Expansion into emerging markets and diversification into new applications will further accelerate market expansion.
Key Players Shaping the Industrial Coatings Industry Market
- AkzoNobel N V
- Chugoku Marine Paints Ltd
- The Sherwin-Williams Company
- Jotun
- RPM International Inc
- Beckers Group
- BASF SE
- Axalta Coating Systems
- Hempel A/S
- Sika AG
- PPG Industries
- Kansai Paint Co Ltd
- Wacker Chemie AG
- Nippon Paint (NIPSEA GROUP)
Notable Milestones in Industrial Coatings Industry Sector
- August 2022: PPG announced a USD 11 million investment to double powder coating production capacity at its San Juan del Rio, Mexico plant by mid-2023.
- June 2022: Sherwin-Williams completed the acquisition of Sika AG's European industrial coatings business.
- April 2022: PPG completed the acquisition of Arsonsisi, an Italian industrial coatings company, including its powder coatings business.
In-Depth Industrial Coatings Industry Market Outlook
The industrial coatings market is poised for continued growth, driven by strong demand from key end-user sectors and ongoing technological advancements. Strategic investments in R&D, expansion into emerging markets, and strategic partnerships will be crucial for companies seeking to capitalize on future growth opportunities. The focus on sustainable and high-performance coatings will shape the future of the market.
Industrial Coatings Industry Segmentation
-
1. Resin
- 1.1. Epoxy
- 1.2. Polyurethane
- 1.3. Acrylic
- 1.4. Polyester
- 1.5. Other Resins
-
2. Technology
- 2.1. Water-borne Coatings
- 2.2. Solvent-borne Coatings
- 2.3. Other Technologies
-
3. End-user Industry
- 3.1. General Industrial
-
3.2. Protective Coatings
- 3.2.1. Oil and Gas
- 3.2.2. Mining
- 3.2.3. Power
- 3.2.4. Infrastructure
- 3.2.5. Other Protective Coatings
Industrial Coatings Industry Segmentation By Geography
-
1. Asia Pacific
- 1.1. China
- 1.2. India
- 1.3. Japan
- 1.4. South Korea
- 1.5. Rest of Asia Pacific
-
2. North America
- 2.1. United States
- 2.2. Canada
- 2.3. Mexico
-
3. Europe
- 3.1. Germany
- 3.2. United Kingdom
- 3.3. Italy
- 3.4. France
- 3.5. Russia
- 3.6. Rest of Europe
-
4. South America
- 4.1. Brazil
- 4.2. Argentina
- 4.3. Rest of South America
- 5. Middle East
-
6. Saudi Arabia
- 6.1. South Africa
- 6.2. Rest of Middle East
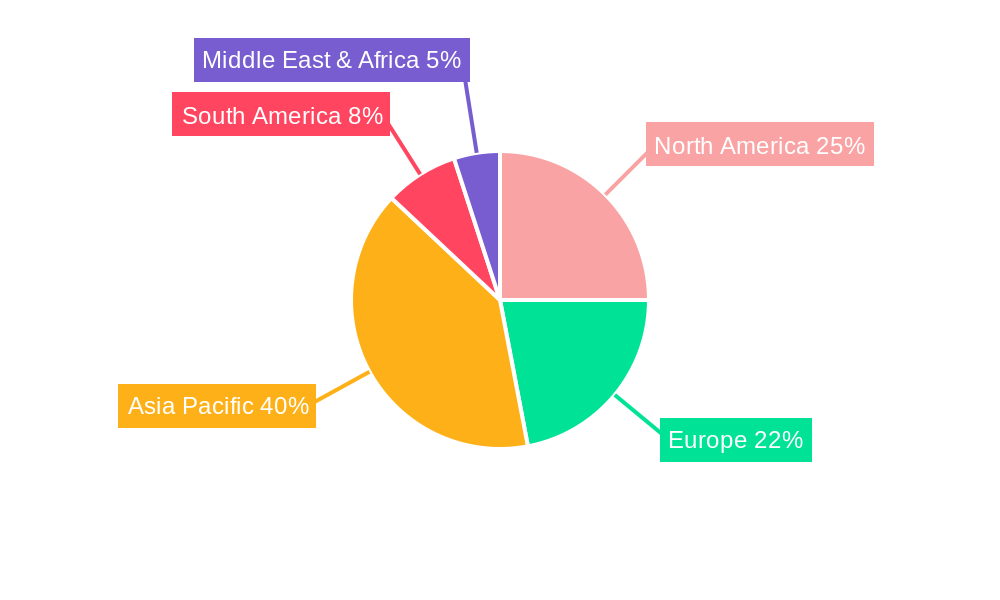
Industrial Coatings Industry Regional Market Share
Geographic Coverage of Industrial Coatings Industry
Industrial Coatings Industry REPORT HIGHLIGHTS
| Aspects | Details |
|---|---|
| Study Period | 2020-2034 |
| Base Year | 2025 |
| Estimated Year | 2026 |
| Forecast Period | 2026-2034 |
| Historical Period | 2020-2025 |
| Growth Rate | CAGR of 4.1% from 2020-2034 |
| Segmentation |
|
Table of Contents
- 1. Introduction
- 1.1. Research Scope
- 1.2. Market Segmentation
- 1.3. Research Objective
- 1.4. Definitions and Assumptions
- 2. Executive Summary
- 2.1. Market Snapshot
- 3. Market Dynamics
- 3.1. Market Drivers
- 3.2. Market Restrains
- 3.3. Market Trends
- 3.4. Market Opportunities
- 4. Market Factor Analysis
- 4.1. Porters Five Forces
- 4.1.1. Bargaining Power of Suppliers
- 4.1.2. Bargaining Power of Buyers
- 4.1.3. Threat of New Entrants
- 4.1.4. Threat of Substitutes
- 4.1.5. Competitive Rivalry
- 4.2. PESTEL analysis
- 4.3. BCG Analysis
- 4.3.1. Stars (High Growth, High Market Share)
- 4.3.2. Cash Cows (Low Growth, High Market Share)
- 4.3.3. Question Mark (High Growth, Low Market Share)
- 4.3.4. Dogs (Low Growth, Low Market Share)
- 4.4. Ansoff Matrix Analysis
- 4.5. Supply Chain Analysis
- 4.6. Regulatory Landscape
- 4.7. Current Market Potential and Opportunity Assessment (TAM–SAM–SOM Framework)
- 4.8. NRP Analyst Note
- 4.1. Porters Five Forces
- 5. Market Analysis, Insights and Forecast 2021-2033
- 5.1. Market Analysis, Insights and Forecast - by Resin
- 5.1.1. Epoxy
- 5.1.2. Polyurethane
- 5.1.3. Acrylic
- 5.1.4. Polyester
- 5.1.5. Other Resins
- 5.2. Market Analysis, Insights and Forecast - by Technology
- 5.2.1. Water-borne Coatings
- 5.2.2. Solvent-borne Coatings
- 5.2.3. Other Technologies
- 5.3. Market Analysis, Insights and Forecast - by End-user Industry
- 5.3.1. General Industrial
- 5.3.2. Protective Coatings
- 5.3.2.1. Oil and Gas
- 5.3.2.2. Mining
- 5.3.2.3. Power
- 5.3.2.4. Infrastructure
- 5.3.2.5. Other Protective Coatings
- 5.4. Market Analysis, Insights and Forecast - by Region
- 5.4.1. Asia Pacific
- 5.4.2. North America
- 5.4.3. Europe
- 5.4.4. South America
- 5.4.5. Middle East
- 5.4.6. Saudi Arabia
- 5.1. Market Analysis, Insights and Forecast - by Resin
- 6. Global Industrial Coatings Industry Analysis, Insights and Forecast, 2021-2033
- 6.1. Market Analysis, Insights and Forecast - by Resin
- 6.1.1. Epoxy
- 6.1.2. Polyurethane
- 6.1.3. Acrylic
- 6.1.4. Polyester
- 6.1.5. Other Resins
- 6.2. Market Analysis, Insights and Forecast - by Technology
- 6.2.1. Water-borne Coatings
- 6.2.2. Solvent-borne Coatings
- 6.2.3. Other Technologies
- 6.3. Market Analysis, Insights and Forecast - by End-user Industry
- 6.3.1. General Industrial
- 6.3.2. Protective Coatings
- 6.3.2.1. Oil and Gas
- 6.3.2.2. Mining
- 6.3.2.3. Power
- 6.3.2.4. Infrastructure
- 6.3.2.5. Other Protective Coatings
- 6.1. Market Analysis, Insights and Forecast - by Resin
- 7. Asia Pacific Industrial Coatings Industry Analysis, Insights and Forecast, 2020-2032
- 7.1. Market Analysis, Insights and Forecast - by Resin
- 7.1.1. Epoxy
- 7.1.2. Polyurethane
- 7.1.3. Acrylic
- 7.1.4. Polyester
- 7.1.5. Other Resins
- 7.2. Market Analysis, Insights and Forecast - by Technology
- 7.2.1. Water-borne Coatings
- 7.2.2. Solvent-borne Coatings
- 7.2.3. Other Technologies
- 7.3. Market Analysis, Insights and Forecast - by End-user Industry
- 7.3.1. General Industrial
- 7.3.2. Protective Coatings
- 7.3.2.1. Oil and Gas
- 7.3.2.2. Mining
- 7.3.2.3. Power
- 7.3.2.4. Infrastructure
- 7.3.2.5. Other Protective Coatings
- 7.1. Market Analysis, Insights and Forecast - by Resin
- 8. North America Industrial Coatings Industry Analysis, Insights and Forecast, 2020-2032
- 8.1. Market Analysis, Insights and Forecast - by Resin
- 8.1.1. Epoxy
- 8.1.2. Polyurethane
- 8.1.3. Acrylic
- 8.1.4. Polyester
- 8.1.5. Other Resins
- 8.2. Market Analysis, Insights and Forecast - by Technology
- 8.2.1. Water-borne Coatings
- 8.2.2. Solvent-borne Coatings
- 8.2.3. Other Technologies
- 8.3. Market Analysis, Insights and Forecast - by End-user Industry
- 8.3.1. General Industrial
- 8.3.2. Protective Coatings
- 8.3.2.1. Oil and Gas
- 8.3.2.2. Mining
- 8.3.2.3. Power
- 8.3.2.4. Infrastructure
- 8.3.2.5. Other Protective Coatings
- 8.1. Market Analysis, Insights and Forecast - by Resin
- 9. Europe Industrial Coatings Industry Analysis, Insights and Forecast, 2020-2032
- 9.1. Market Analysis, Insights and Forecast - by Resin
- 9.1.1. Epoxy
- 9.1.2. Polyurethane
- 9.1.3. Acrylic
- 9.1.4. Polyester
- 9.1.5. Other Resins
- 9.2. Market Analysis, Insights and Forecast - by Technology
- 9.2.1. Water-borne Coatings
- 9.2.2. Solvent-borne Coatings
- 9.2.3. Other Technologies
- 9.3. Market Analysis, Insights and Forecast - by End-user Industry
- 9.3.1. General Industrial
- 9.3.2. Protective Coatings
- 9.3.2.1. Oil and Gas
- 9.3.2.2. Mining
- 9.3.2.3. Power
- 9.3.2.4. Infrastructure
- 9.3.2.5. Other Protective Coatings
- 9.1. Market Analysis, Insights and Forecast - by Resin
- 10. South America Industrial Coatings Industry Analysis, Insights and Forecast, 2020-2032
- 10.1. Market Analysis, Insights and Forecast - by Resin
- 10.1.1. Epoxy
- 10.1.2. Polyurethane
- 10.1.3. Acrylic
- 10.1.4. Polyester
- 10.1.5. Other Resins
- 10.2. Market Analysis, Insights and Forecast - by Technology
- 10.2.1. Water-borne Coatings
- 10.2.2. Solvent-borne Coatings
- 10.2.3. Other Technologies
- 10.3. Market Analysis, Insights and Forecast - by End-user Industry
- 10.3.1. General Industrial
- 10.3.2. Protective Coatings
- 10.3.2.1. Oil and Gas
- 10.3.2.2. Mining
- 10.3.2.3. Power
- 10.3.2.4. Infrastructure
- 10.3.2.5. Other Protective Coatings
- 10.1. Market Analysis, Insights and Forecast - by Resin
- 11. Middle East Industrial Coatings Industry Analysis, Insights and Forecast, 2020-2032
- 11.1. Market Analysis, Insights and Forecast - by Resin
- 11.1.1. Epoxy
- 11.1.2. Polyurethane
- 11.1.3. Acrylic
- 11.1.4. Polyester
- 11.1.5. Other Resins
- 11.2. Market Analysis, Insights and Forecast - by Technology
- 11.2.1. Water-borne Coatings
- 11.2.2. Solvent-borne Coatings
- 11.2.3. Other Technologies
- 11.3. Market Analysis, Insights and Forecast - by End-user Industry
- 11.3.1. General Industrial
- 11.3.2. Protective Coatings
- 11.3.2.1. Oil and Gas
- 11.3.2.2. Mining
- 11.3.2.3. Power
- 11.3.2.4. Infrastructure
- 11.3.2.5. Other Protective Coatings
- 11.1. Market Analysis, Insights and Forecast - by Resin
- 12. Saudi Arabia Industrial Coatings Industry Analysis, Insights and Forecast, 2020-2032
- 12.1. Market Analysis, Insights and Forecast - by Resin
- 12.1.1. Epoxy
- 12.1.2. Polyurethane
- 12.1.3. Acrylic
- 12.1.4. Polyester
- 12.1.5. Other Resins
- 12.2. Market Analysis, Insights and Forecast - by Technology
- 12.2.1. Water-borne Coatings
- 12.2.2. Solvent-borne Coatings
- 12.2.3. Other Technologies
- 12.3. Market Analysis, Insights and Forecast - by End-user Industry
- 12.3.1. General Industrial
- 12.3.2. Protective Coatings
- 12.3.2.1. Oil and Gas
- 12.3.2.2. Mining
- 12.3.2.3. Power
- 12.3.2.4. Infrastructure
- 12.3.2.5. Other Protective Coatings
- 12.1. Market Analysis, Insights and Forecast - by Resin
- 13. Competitive Analysis
- 13.1. Company Profiles
- 13.1.1 AkzoNobel N V
- 13.1.1.1. Company Overview
- 13.1.1.2. Products
- 13.1.1.3. Company Financials
- 13.1.1.4. SWOT Analysis
- 13.1.2 Chugoku Marine Paints Ltd
- 13.1.2.1. Company Overview
- 13.1.2.2. Products
- 13.1.2.3. Company Financials
- 13.1.2.4. SWOT Analysis
- 13.1.3 The Sherwin-Williams Company
- 13.1.3.1. Company Overview
- 13.1.3.2. Products
- 13.1.3.3. Company Financials
- 13.1.3.4. SWOT Analysis
- 13.1.4 Jotun
- 13.1.4.1. Company Overview
- 13.1.4.2. Products
- 13.1.4.3. Company Financials
- 13.1.4.4. SWOT Analysis
- 13.1.5 RPM International Inc
- 13.1.5.1. Company Overview
- 13.1.5.2. Products
- 13.1.5.3. Company Financials
- 13.1.5.4. SWOT Analysis
- 13.1.6 Beckers Group
- 13.1.6.1. Company Overview
- 13.1.6.2. Products
- 13.1.6.3. Company Financials
- 13.1.6.4. SWOT Analysis
- 13.1.7 BASF SE
- 13.1.7.1. Company Overview
- 13.1.7.2. Products
- 13.1.7.3. Company Financials
- 13.1.7.4. SWOT Analysis
- 13.1.8 Axalta Coating Systems
- 13.1.8.1. Company Overview
- 13.1.8.2. Products
- 13.1.8.3. Company Financials
- 13.1.8.4. SWOT Analysis
- 13.1.9 Hempel A/S
- 13.1.9.1. Company Overview
- 13.1.9.2. Products
- 13.1.9.3. Company Financials
- 13.1.9.4. SWOT Analysis
- 13.1.10 Sika AG
- 13.1.10.1. Company Overview
- 13.1.10.2. Products
- 13.1.10.3. Company Financials
- 13.1.10.4. SWOT Analysis
- 13.1.11 PPG Industries
- 13.1.11.1. Company Overview
- 13.1.11.2. Products
- 13.1.11.3. Company Financials
- 13.1.11.4. SWOT Analysis
- 13.1.12 Kansai Paint Co Ltd
- 13.1.12.1. Company Overview
- 13.1.12.2. Products
- 13.1.12.3. Company Financials
- 13.1.12.4. SWOT Analysis
- 13.1.13 Wacker Chemie AG*List Not Exhaustive
- 13.1.13.1. Company Overview
- 13.1.13.2. Products
- 13.1.13.3. Company Financials
- 13.1.13.4. SWOT Analysis
- 13.1.14 Nippon Paint ( NIPSEA GROUP)
- 13.1.14.1. Company Overview
- 13.1.14.2. Products
- 13.1.14.3. Company Financials
- 13.1.14.4. SWOT Analysis
- 13.1.1 AkzoNobel N V
- 13.2. Market Entropy
- 13.2.1 Company's Key Areas Served
- 13.2.2 Recent Developments
- 13.3. Company Market Share Analysis 2025
- 13.3.1 Top 5 Companies Market Share Analysis
- 13.3.2 Top 3 Companies Market Share Analysis
- 13.4. List of Potential Customers
- 14. Research Methodology
List of Figures
- Figure 1: Global Industrial Coatings Industry Revenue Breakdown (billion, %) by Region 2025 & 2033
- Figure 2: Global Industrial Coatings Industry Volume Breakdown (liter , %) by Region 2025 & 2033
- Figure 3: Asia Pacific Industrial Coatings Industry Revenue (billion), by Resin 2025 & 2033
- Figure 4: Asia Pacific Industrial Coatings Industry Volume (liter ), by Resin 2025 & 2033
- Figure 5: Asia Pacific Industrial Coatings Industry Revenue Share (%), by Resin 2025 & 2033
- Figure 6: Asia Pacific Industrial Coatings Industry Volume Share (%), by Resin 2025 & 2033
- Figure 7: Asia Pacific Industrial Coatings Industry Revenue (billion), by Technology 2025 & 2033
- Figure 8: Asia Pacific Industrial Coatings Industry Volume (liter ), by Technology 2025 & 2033
- Figure 9: Asia Pacific Industrial Coatings Industry Revenue Share (%), by Technology 2025 & 2033
- Figure 10: Asia Pacific Industrial Coatings Industry Volume Share (%), by Technology 2025 & 2033
- Figure 11: Asia Pacific Industrial Coatings Industry Revenue (billion), by End-user Industry 2025 & 2033
- Figure 12: Asia Pacific Industrial Coatings Industry Volume (liter ), by End-user Industry 2025 & 2033
- Figure 13: Asia Pacific Industrial Coatings Industry Revenue Share (%), by End-user Industry 2025 & 2033
- Figure 14: Asia Pacific Industrial Coatings Industry Volume Share (%), by End-user Industry 2025 & 2033
- Figure 15: Asia Pacific Industrial Coatings Industry Revenue (billion), by Country 2025 & 2033
- Figure 16: Asia Pacific Industrial Coatings Industry Volume (liter ), by Country 2025 & 2033
- Figure 17: Asia Pacific Industrial Coatings Industry Revenue Share (%), by Country 2025 & 2033
- Figure 18: Asia Pacific Industrial Coatings Industry Volume Share (%), by Country 2025 & 2033
- Figure 19: North America Industrial Coatings Industry Revenue (billion), by Resin 2025 & 2033
- Figure 20: North America Industrial Coatings Industry Volume (liter ), by Resin 2025 & 2033
- Figure 21: North America Industrial Coatings Industry Revenue Share (%), by Resin 2025 & 2033
- Figure 22: North America Industrial Coatings Industry Volume Share (%), by Resin 2025 & 2033
- Figure 23: North America Industrial Coatings Industry Revenue (billion), by Technology 2025 & 2033
- Figure 24: North America Industrial Coatings Industry Volume (liter ), by Technology 2025 & 2033
- Figure 25: North America Industrial Coatings Industry Revenue Share (%), by Technology 2025 & 2033
- Figure 26: North America Industrial Coatings Industry Volume Share (%), by Technology 2025 & 2033
- Figure 27: North America Industrial Coatings Industry Revenue (billion), by End-user Industry 2025 & 2033
- Figure 28: North America Industrial Coatings Industry Volume (liter ), by End-user Industry 2025 & 2033
- Figure 29: North America Industrial Coatings Industry Revenue Share (%), by End-user Industry 2025 & 2033
- Figure 30: North America Industrial Coatings Industry Volume Share (%), by End-user Industry 2025 & 2033
- Figure 31: North America Industrial Coatings Industry Revenue (billion), by Country 2025 & 2033
- Figure 32: North America Industrial Coatings Industry Volume (liter ), by Country 2025 & 2033
- Figure 33: North America Industrial Coatings Industry Revenue Share (%), by Country 2025 & 2033
- Figure 34: North America Industrial Coatings Industry Volume Share (%), by Country 2025 & 2033
- Figure 35: Europe Industrial Coatings Industry Revenue (billion), by Resin 2025 & 2033
- Figure 36: Europe Industrial Coatings Industry Volume (liter ), by Resin 2025 & 2033
- Figure 37: Europe Industrial Coatings Industry Revenue Share (%), by Resin 2025 & 2033
- Figure 38: Europe Industrial Coatings Industry Volume Share (%), by Resin 2025 & 2033
- Figure 39: Europe Industrial Coatings Industry Revenue (billion), by Technology 2025 & 2033
- Figure 40: Europe Industrial Coatings Industry Volume (liter ), by Technology 2025 & 2033
- Figure 41: Europe Industrial Coatings Industry Revenue Share (%), by Technology 2025 & 2033
- Figure 42: Europe Industrial Coatings Industry Volume Share (%), by Technology 2025 & 2033
- Figure 43: Europe Industrial Coatings Industry Revenue (billion), by End-user Industry 2025 & 2033
- Figure 44: Europe Industrial Coatings Industry Volume (liter ), by End-user Industry 2025 & 2033
- Figure 45: Europe Industrial Coatings Industry Revenue Share (%), by End-user Industry 2025 & 2033
- Figure 46: Europe Industrial Coatings Industry Volume Share (%), by End-user Industry 2025 & 2033
- Figure 47: Europe Industrial Coatings Industry Revenue (billion), by Country 2025 & 2033
- Figure 48: Europe Industrial Coatings Industry Volume (liter ), by Country 2025 & 2033
- Figure 49: Europe Industrial Coatings Industry Revenue Share (%), by Country 2025 & 2033
- Figure 50: Europe Industrial Coatings Industry Volume Share (%), by Country 2025 & 2033
- Figure 51: South America Industrial Coatings Industry Revenue (billion), by Resin 2025 & 2033
- Figure 52: South America Industrial Coatings Industry Volume (liter ), by Resin 2025 & 2033
- Figure 53: South America Industrial Coatings Industry Revenue Share (%), by Resin 2025 & 2033
- Figure 54: South America Industrial Coatings Industry Volume Share (%), by Resin 2025 & 2033
- Figure 55: South America Industrial Coatings Industry Revenue (billion), by Technology 2025 & 2033
- Figure 56: South America Industrial Coatings Industry Volume (liter ), by Technology 2025 & 2033
- Figure 57: South America Industrial Coatings Industry Revenue Share (%), by Technology 2025 & 2033
- Figure 58: South America Industrial Coatings Industry Volume Share (%), by Technology 2025 & 2033
- Figure 59: South America Industrial Coatings Industry Revenue (billion), by End-user Industry 2025 & 2033
- Figure 60: South America Industrial Coatings Industry Volume (liter ), by End-user Industry 2025 & 2033
- Figure 61: South America Industrial Coatings Industry Revenue Share (%), by End-user Industry 2025 & 2033
- Figure 62: South America Industrial Coatings Industry Volume Share (%), by End-user Industry 2025 & 2033
- Figure 63: South America Industrial Coatings Industry Revenue (billion), by Country 2025 & 2033
- Figure 64: South America Industrial Coatings Industry Volume (liter ), by Country 2025 & 2033
- Figure 65: South America Industrial Coatings Industry Revenue Share (%), by Country 2025 & 2033
- Figure 66: South America Industrial Coatings Industry Volume Share (%), by Country 2025 & 2033
- Figure 67: Middle East Industrial Coatings Industry Revenue (billion), by Resin 2025 & 2033
- Figure 68: Middle East Industrial Coatings Industry Volume (liter ), by Resin 2025 & 2033
- Figure 69: Middle East Industrial Coatings Industry Revenue Share (%), by Resin 2025 & 2033
- Figure 70: Middle East Industrial Coatings Industry Volume Share (%), by Resin 2025 & 2033
- Figure 71: Middle East Industrial Coatings Industry Revenue (billion), by Technology 2025 & 2033
- Figure 72: Middle East Industrial Coatings Industry Volume (liter ), by Technology 2025 & 2033
- Figure 73: Middle East Industrial Coatings Industry Revenue Share (%), by Technology 2025 & 2033
- Figure 74: Middle East Industrial Coatings Industry Volume Share (%), by Technology 2025 & 2033
- Figure 75: Middle East Industrial Coatings Industry Revenue (billion), by End-user Industry 2025 & 2033
- Figure 76: Middle East Industrial Coatings Industry Volume (liter ), by End-user Industry 2025 & 2033
- Figure 77: Middle East Industrial Coatings Industry Revenue Share (%), by End-user Industry 2025 & 2033
- Figure 78: Middle East Industrial Coatings Industry Volume Share (%), by End-user Industry 2025 & 2033
- Figure 79: Middle East Industrial Coatings Industry Revenue (billion), by Country 2025 & 2033
- Figure 80: Middle East Industrial Coatings Industry Volume (liter ), by Country 2025 & 2033
- Figure 81: Middle East Industrial Coatings Industry Revenue Share (%), by Country 2025 & 2033
- Figure 82: Middle East Industrial Coatings Industry Volume Share (%), by Country 2025 & 2033
- Figure 83: Saudi Arabia Industrial Coatings Industry Revenue (billion), by Resin 2025 & 2033
- Figure 84: Saudi Arabia Industrial Coatings Industry Volume (liter ), by Resin 2025 & 2033
- Figure 85: Saudi Arabia Industrial Coatings Industry Revenue Share (%), by Resin 2025 & 2033
- Figure 86: Saudi Arabia Industrial Coatings Industry Volume Share (%), by Resin 2025 & 2033
- Figure 87: Saudi Arabia Industrial Coatings Industry Revenue (billion), by Technology 2025 & 2033
- Figure 88: Saudi Arabia Industrial Coatings Industry Volume (liter ), by Technology 2025 & 2033
- Figure 89: Saudi Arabia Industrial Coatings Industry Revenue Share (%), by Technology 2025 & 2033
- Figure 90: Saudi Arabia Industrial Coatings Industry Volume Share (%), by Technology 2025 & 2033
- Figure 91: Saudi Arabia Industrial Coatings Industry Revenue (billion), by End-user Industry 2025 & 2033
- Figure 92: Saudi Arabia Industrial Coatings Industry Volume (liter ), by End-user Industry 2025 & 2033
- Figure 93: Saudi Arabia Industrial Coatings Industry Revenue Share (%), by End-user Industry 2025 & 2033
- Figure 94: Saudi Arabia Industrial Coatings Industry Volume Share (%), by End-user Industry 2025 & 2033
- Figure 95: Saudi Arabia Industrial Coatings Industry Revenue (billion), by Country 2025 & 2033
- Figure 96: Saudi Arabia Industrial Coatings Industry Volume (liter ), by Country 2025 & 2033
- Figure 97: Saudi Arabia Industrial Coatings Industry Revenue Share (%), by Country 2025 & 2033
- Figure 98: Saudi Arabia Industrial Coatings Industry Volume Share (%), by Country 2025 & 2033
List of Tables
- Table 1: Global Industrial Coatings Industry Revenue billion Forecast, by Resin 2020 & 2033
- Table 2: Global Industrial Coatings Industry Volume liter Forecast, by Resin 2020 & 2033
- Table 3: Global Industrial Coatings Industry Revenue billion Forecast, by Technology 2020 & 2033
- Table 4: Global Industrial Coatings Industry Volume liter Forecast, by Technology 2020 & 2033
- Table 5: Global Industrial Coatings Industry Revenue billion Forecast, by End-user Industry 2020 & 2033
- Table 6: Global Industrial Coatings Industry Volume liter Forecast, by End-user Industry 2020 & 2033
- Table 7: Global Industrial Coatings Industry Revenue billion Forecast, by Region 2020 & 2033
- Table 8: Global Industrial Coatings Industry Volume liter Forecast, by Region 2020 & 2033
- Table 9: Global Industrial Coatings Industry Revenue billion Forecast, by Resin 2020 & 2033
- Table 10: Global Industrial Coatings Industry Volume liter Forecast, by Resin 2020 & 2033
- Table 11: Global Industrial Coatings Industry Revenue billion Forecast, by Technology 2020 & 2033
- Table 12: Global Industrial Coatings Industry Volume liter Forecast, by Technology 2020 & 2033
- Table 13: Global Industrial Coatings Industry Revenue billion Forecast, by End-user Industry 2020 & 2033
- Table 14: Global Industrial Coatings Industry Volume liter Forecast, by End-user Industry 2020 & 2033
- Table 15: Global Industrial Coatings Industry Revenue billion Forecast, by Country 2020 & 2033
- Table 16: Global Industrial Coatings Industry Volume liter Forecast, by Country 2020 & 2033
- Table 17: China Industrial Coatings Industry Revenue (billion) Forecast, by Application 2020 & 2033
- Table 18: China Industrial Coatings Industry Volume (liter ) Forecast, by Application 2020 & 2033
- Table 19: India Industrial Coatings Industry Revenue (billion) Forecast, by Application 2020 & 2033
- Table 20: India Industrial Coatings Industry Volume (liter ) Forecast, by Application 2020 & 2033
- Table 21: Japan Industrial Coatings Industry Revenue (billion) Forecast, by Application 2020 & 2033
- Table 22: Japan Industrial Coatings Industry Volume (liter ) Forecast, by Application 2020 & 2033
- Table 23: South Korea Industrial Coatings Industry Revenue (billion) Forecast, by Application 2020 & 2033
- Table 24: South Korea Industrial Coatings Industry Volume (liter ) Forecast, by Application 2020 & 2033
- Table 25: Rest of Asia Pacific Industrial Coatings Industry Revenue (billion) Forecast, by Application 2020 & 2033
- Table 26: Rest of Asia Pacific Industrial Coatings Industry Volume (liter ) Forecast, by Application 2020 & 2033
- Table 27: Global Industrial Coatings Industry Revenue billion Forecast, by Resin 2020 & 2033
- Table 28: Global Industrial Coatings Industry Volume liter Forecast, by Resin 2020 & 2033
- Table 29: Global Industrial Coatings Industry Revenue billion Forecast, by Technology 2020 & 2033
- Table 30: Global Industrial Coatings Industry Volume liter Forecast, by Technology 2020 & 2033
- Table 31: Global Industrial Coatings Industry Revenue billion Forecast, by End-user Industry 2020 & 2033
- Table 32: Global Industrial Coatings Industry Volume liter Forecast, by End-user Industry 2020 & 2033
- Table 33: Global Industrial Coatings Industry Revenue billion Forecast, by Country 2020 & 2033
- Table 34: Global Industrial Coatings Industry Volume liter Forecast, by Country 2020 & 2033
- Table 35: United States Industrial Coatings Industry Revenue (billion) Forecast, by Application 2020 & 2033
- Table 36: United States Industrial Coatings Industry Volume (liter ) Forecast, by Application 2020 & 2033
- Table 37: Canada Industrial Coatings Industry Revenue (billion) Forecast, by Application 2020 & 2033
- Table 38: Canada Industrial Coatings Industry Volume (liter ) Forecast, by Application 2020 & 2033
- Table 39: Mexico Industrial Coatings Industry Revenue (billion) Forecast, by Application 2020 & 2033
- Table 40: Mexico Industrial Coatings Industry Volume (liter ) Forecast, by Application 2020 & 2033
- Table 41: Global Industrial Coatings Industry Revenue billion Forecast, by Resin 2020 & 2033
- Table 42: Global Industrial Coatings Industry Volume liter Forecast, by Resin 2020 & 2033
- Table 43: Global Industrial Coatings Industry Revenue billion Forecast, by Technology 2020 & 2033
- Table 44: Global Industrial Coatings Industry Volume liter Forecast, by Technology 2020 & 2033
- Table 45: Global Industrial Coatings Industry Revenue billion Forecast, by End-user Industry 2020 & 2033
- Table 46: Global Industrial Coatings Industry Volume liter Forecast, by End-user Industry 2020 & 2033
- Table 47: Global Industrial Coatings Industry Revenue billion Forecast, by Country 2020 & 2033
- Table 48: Global Industrial Coatings Industry Volume liter Forecast, by Country 2020 & 2033
- Table 49: Germany Industrial Coatings Industry Revenue (billion) Forecast, by Application 2020 & 2033
- Table 50: Germany Industrial Coatings Industry Volume (liter ) Forecast, by Application 2020 & 2033
- Table 51: United Kingdom Industrial Coatings Industry Revenue (billion) Forecast, by Application 2020 & 2033
- Table 52: United Kingdom Industrial Coatings Industry Volume (liter ) Forecast, by Application 2020 & 2033
- Table 53: Italy Industrial Coatings Industry Revenue (billion) Forecast, by Application 2020 & 2033
- Table 54: Italy Industrial Coatings Industry Volume (liter ) Forecast, by Application 2020 & 2033
- Table 55: France Industrial Coatings Industry Revenue (billion) Forecast, by Application 2020 & 2033
- Table 56: France Industrial Coatings Industry Volume (liter ) Forecast, by Application 2020 & 2033
- Table 57: Russia Industrial Coatings Industry Revenue (billion) Forecast, by Application 2020 & 2033
- Table 58: Russia Industrial Coatings Industry Volume (liter ) Forecast, by Application 2020 & 2033
- Table 59: Rest of Europe Industrial Coatings Industry Revenue (billion) Forecast, by Application 2020 & 2033
- Table 60: Rest of Europe Industrial Coatings Industry Volume (liter ) Forecast, by Application 2020 & 2033
- Table 61: Global Industrial Coatings Industry Revenue billion Forecast, by Resin 2020 & 2033
- Table 62: Global Industrial Coatings Industry Volume liter Forecast, by Resin 2020 & 2033
- Table 63: Global Industrial Coatings Industry Revenue billion Forecast, by Technology 2020 & 2033
- Table 64: Global Industrial Coatings Industry Volume liter Forecast, by Technology 2020 & 2033
- Table 65: Global Industrial Coatings Industry Revenue billion Forecast, by End-user Industry 2020 & 2033
- Table 66: Global Industrial Coatings Industry Volume liter Forecast, by End-user Industry 2020 & 2033
- Table 67: Global Industrial Coatings Industry Revenue billion Forecast, by Country 2020 & 2033
- Table 68: Global Industrial Coatings Industry Volume liter Forecast, by Country 2020 & 2033
- Table 69: Brazil Industrial Coatings Industry Revenue (billion) Forecast, by Application 2020 & 2033
- Table 70: Brazil Industrial Coatings Industry Volume (liter ) Forecast, by Application 2020 & 2033
- Table 71: Argentina Industrial Coatings Industry Revenue (billion) Forecast, by Application 2020 & 2033
- Table 72: Argentina Industrial Coatings Industry Volume (liter ) Forecast, by Application 2020 & 2033
- Table 73: Rest of South America Industrial Coatings Industry Revenue (billion) Forecast, by Application 2020 & 2033
- Table 74: Rest of South America Industrial Coatings Industry Volume (liter ) Forecast, by Application 2020 & 2033
- Table 75: Global Industrial Coatings Industry Revenue billion Forecast, by Resin 2020 & 2033
- Table 76: Global Industrial Coatings Industry Volume liter Forecast, by Resin 2020 & 2033
- Table 77: Global Industrial Coatings Industry Revenue billion Forecast, by Technology 2020 & 2033
- Table 78: Global Industrial Coatings Industry Volume liter Forecast, by Technology 2020 & 2033
- Table 79: Global Industrial Coatings Industry Revenue billion Forecast, by End-user Industry 2020 & 2033
- Table 80: Global Industrial Coatings Industry Volume liter Forecast, by End-user Industry 2020 & 2033
- Table 81: Global Industrial Coatings Industry Revenue billion Forecast, by Country 2020 & 2033
- Table 82: Global Industrial Coatings Industry Volume liter Forecast, by Country 2020 & 2033
- Table 83: Global Industrial Coatings Industry Revenue billion Forecast, by Resin 2020 & 2033
- Table 84: Global Industrial Coatings Industry Volume liter Forecast, by Resin 2020 & 2033
- Table 85: Global Industrial Coatings Industry Revenue billion Forecast, by Technology 2020 & 2033
- Table 86: Global Industrial Coatings Industry Volume liter Forecast, by Technology 2020 & 2033
- Table 87: Global Industrial Coatings Industry Revenue billion Forecast, by End-user Industry 2020 & 2033
- Table 88: Global Industrial Coatings Industry Volume liter Forecast, by End-user Industry 2020 & 2033
- Table 89: Global Industrial Coatings Industry Revenue billion Forecast, by Country 2020 & 2033
- Table 90: Global Industrial Coatings Industry Volume liter Forecast, by Country 2020 & 2033
- Table 91: South Africa Industrial Coatings Industry Revenue (billion) Forecast, by Application 2020 & 2033
- Table 92: South Africa Industrial Coatings Industry Volume (liter ) Forecast, by Application 2020 & 2033
- Table 93: Rest of Middle East Industrial Coatings Industry Revenue (billion) Forecast, by Application 2020 & 2033
- Table 94: Rest of Middle East Industrial Coatings Industry Volume (liter ) Forecast, by Application 2020 & 2033
Frequently Asked Questions
1. What is the projected Compound Annual Growth Rate (CAGR) of the Industrial Coatings Industry?
The projected CAGR is approximately 4.1%.
2. Which companies are prominent players in the Industrial Coatings Industry?
Key companies in the market include AkzoNobel N V, Chugoku Marine Paints Ltd, The Sherwin-Williams Company, Jotun, RPM International Inc, Beckers Group, BASF SE, Axalta Coating Systems, Hempel A/S, Sika AG, PPG Industries, Kansai Paint Co Ltd, Wacker Chemie AG*List Not Exhaustive, Nippon Paint ( NIPSEA GROUP).
3. What are the main segments of the Industrial Coatings Industry?
The market segments include Resin, Technology, End-user Industry.
4. Can you provide details about the market size?
The market size is estimated to be USD 96.72 billion as of 2022.
5. What are some drivers contributing to market growth?
Rising Demand for Protective Coatings; Increasing Applications in Oil and Gas Industry.
6. What are the notable trends driving market growth?
Increasing Applications in Oil and Gas Industry.
7. Are there any restraints impacting market growth?
Harmful Environmental Impact Of Solvent-borne Coatings; Impact of COVID-19 Outbreak.
8. Can you provide examples of recent developments in the market?
August 2022: PPG said it would spend USD 11 million to double the amount of powder coatings it can make at its plant in San Juan del Rio, Mexico.The project to expand should be done by the middle of 2023. This will allow the plant to meet the expected demand for powder coatings in Mexico in the future.
9. What pricing options are available for accessing the report?
Pricing options include single-user, multi-user, and enterprise licenses priced at USD 4750, USD 5250, and USD 8750 respectively.
10. Is the market size provided in terms of value or volume?
The market size is provided in terms of value, measured in billion and volume, measured in liter .
11. Are there any specific market keywords associated with the report?
Yes, the market keyword associated with the report is "Industrial Coatings Industry," which aids in identifying and referencing the specific market segment covered.
12. How do I determine which pricing option suits my needs best?
The pricing options vary based on user requirements and access needs. Individual users may opt for single-user licenses, while businesses requiring broader access may choose multi-user or enterprise licenses for cost-effective access to the report.
13. Are there any additional resources or data provided in the Industrial Coatings Industry report?
While the report offers comprehensive insights, it's advisable to review the specific contents or supplementary materials provided to ascertain if additional resources or data are available.
14. How can I stay updated on further developments or reports in the Industrial Coatings Industry?
To stay informed about further developments, trends, and reports in the Industrial Coatings Industry, consider subscribing to industry newsletters, following relevant companies and organizations, or regularly checking reputable industry news sources and publications.
Methodology
Step 1 - Identification of Relevant Samples Size from Population Database


Step 2 - Approaches for Defining Global Market Size (Value, Volume* & Price*)

Note*: In applicable scenarios
Step 3 - Data Sources
Primary Research
- Web Analytics
- Survey Reports
- Research Institute
- Latest Research Reports
- Opinion Leaders
Secondary Research
- Annual Reports
- White Paper
- Latest Press Release
- Industry Association
- Paid Database
- Investor Presentations

Step 4 - Data Triangulation
Involves using different sources of information in order to increase the validity of a study
These sources are likely to be stakeholders in a program - participants, other researchers, program staff, other community members, and so on.
Then we put all data in single framework & apply various statistical tools to find out the dynamic on the market.
During the analysis stage, feedback from the stakeholder groups would be compared to determine areas of agreement as well as areas of divergence