

Key Insights
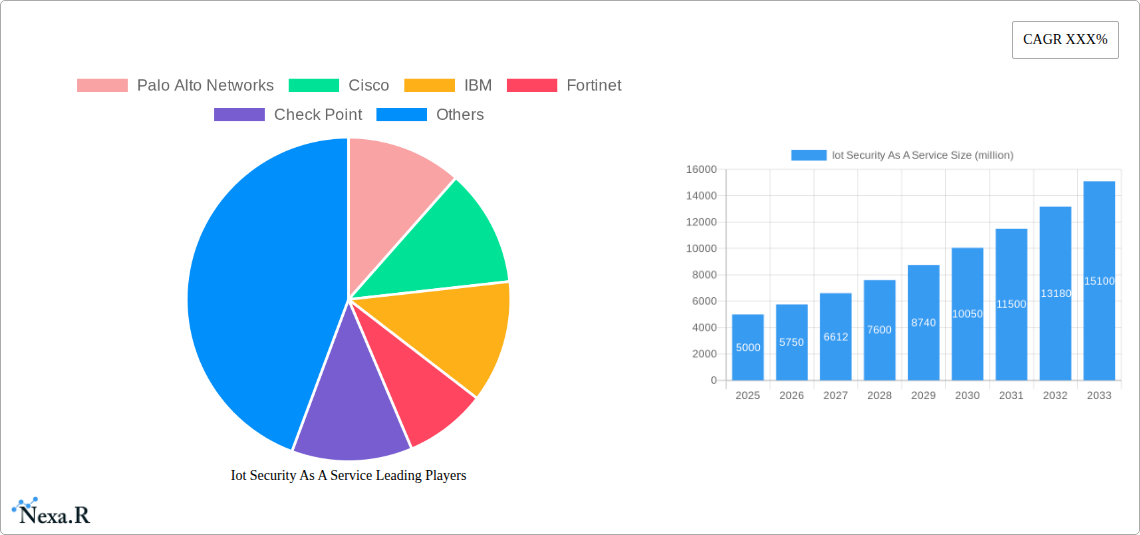
The Internet of Things (IoT) Security as a Service (SaaS) market is experiencing robust growth, driven by the escalating number of connected devices and increasing concerns about data breaches and cyberattacks targeting IoT infrastructure. The market's expansion is fueled by several key factors, including the rising adoption of cloud-based security solutions, the increasing demand for proactive threat detection and prevention, and the growing need for simplified security management in complex IoT environments. Businesses across various sectors, including healthcare, manufacturing, and transportation, are increasingly relying on IoT SaaS solutions to protect their sensitive data and ensure operational continuity. This shift towards SaaS models is primarily driven by their cost-effectiveness, scalability, and ease of implementation compared to traditional on-premise security solutions. We estimate the market size in 2025 to be approximately $5 billion, projecting a Compound Annual Growth Rate (CAGR) of 15% through 2033. This growth is expected to be fueled by the continued proliferation of IoT devices and the increasing sophistication of cyber threats.
While the market presents significant opportunities, certain challenges remain. These include the heterogeneity of IoT devices, which makes developing universal security solutions complex; the need for robust data privacy regulations and compliance frameworks; and the potential for skills shortages in managing and securing increasingly complex IoT ecosystems. However, ongoing technological advancements in areas like artificial intelligence (AI) and machine learning (ML), coupled with increased collaboration between security vendors and IoT device manufacturers, are expected to mitigate these challenges over time. Major players like Palo Alto Networks, Cisco, and Fortinet are strategically investing in R&D and acquisitions to solidify their market positions and capitalize on this growing demand. The competitive landscape is characterized by intense innovation, with smaller players focusing on niche areas and specialized security solutions for particular IoT verticals.
IoT Security as a Service (SaaS) Market Report: 2019-2033
This comprehensive report provides an in-depth analysis of the rapidly expanding IoT Security as a Service (SaaS) market, encompassing market dynamics, growth trends, regional dominance, product landscape, key challenges, emerging opportunities, and key players. The study period covers 2019-2033, with a base year of 2025 and a forecast period of 2025-2033. This report is invaluable for industry professionals, investors, and strategic decision-makers seeking a clear understanding of this crucial market segment. The parent market is Cybersecurity and the child market is IoT Security.
IoT Security as a Service Market Dynamics & Structure
The IoT Security as a Service market is characterized by increasing market concentration among major players, driven by technological innovations like AI-powered threat detection and advanced encryption techniques. Stringent regulatory frameworks, particularly around data privacy (GDPR, CCPA), are shaping the market landscape. Competitive substitutes include on-premise security solutions, but the SaaS model's scalability and cost-effectiveness are driving adoption. The end-user demographics are expanding beyond large enterprises to include SMEs and individual consumers. M&A activity is significant, with larger players acquiring smaller specialized firms to expand their offerings.
- Market Concentration: The top 5 players hold approximately xx% of the market share in 2025 (Estimated).
- Technological Innovation: AI-driven threat detection, blockchain-based security, and zero trust architectures are key innovation drivers.
- Regulatory Landscape: GDPR, CCPA, and other data privacy regulations are major influences, driving demand for compliant solutions.
- M&A Activity: An estimated xx M&A deals occurred in the IoT Security SaaS sector between 2019 and 2024. The average deal size was approximately $xx million.
- Innovation Barriers: High initial investment costs and skills shortage in specialized cybersecurity are key barriers.
IoT Security as a Service Growth Trends & Insights
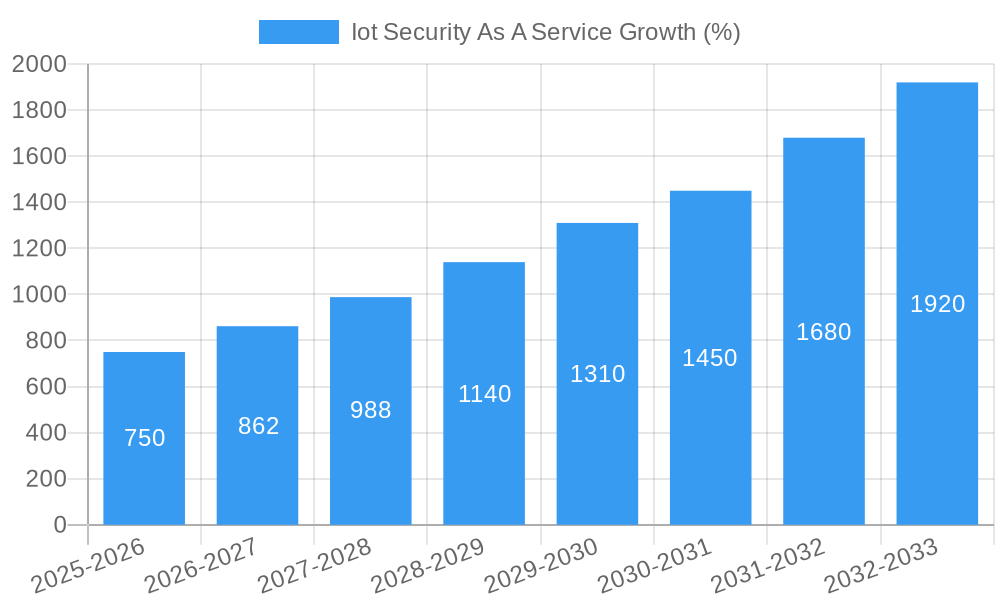
The IoT Security as a Service market witnessed significant growth during the historical period (2019-2024), expanding from $xx million in 2019 to $xx million in 2024. This robust growth is primarily attributed to the exponential rise in connected devices, increasing awareness of IoT vulnerabilities, and the advantages offered by cloud-based security solutions. The market is projected to maintain a Compound Annual Growth Rate (CAGR) of xx% during the forecast period (2025-2033), reaching $xx million by 2033. Market penetration is expected to increase from xx% in 2025 to xx% by 2033. Technological disruptions, like the evolution of 5G and the Internet of Things (IoT) edge computing, are further accelerating adoption rates. Consumer behavior shifts towards increased reliance on cloud services are also contributing factors. The rising adoption of SaaS security solutions by enterprises and the government sector is accelerating the market growth.
Dominant Regions, Countries, or Segments in IoT Security as a Service
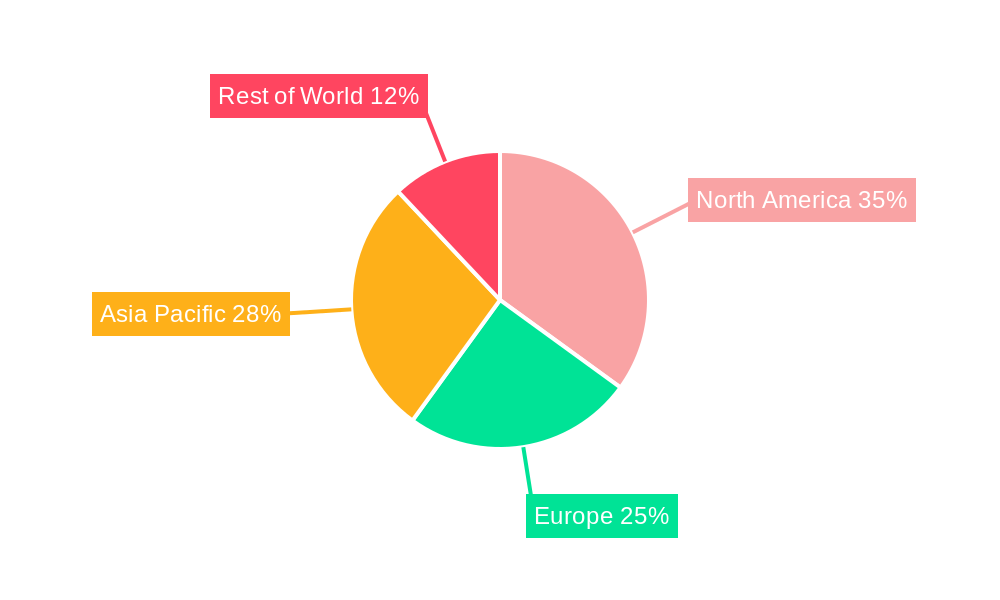
North America currently dominates the IoT Security as a Service market, holding the largest market share in 2025. This dominance is primarily driven by the early adoption of IoT technologies, robust IT infrastructure, and stringent data privacy regulations. However, the Asia-Pacific region is projected to witness the highest growth rate during the forecast period, fueled by rapid technological advancements, increasing government investments in digital infrastructure, and a growing number of connected devices.
- North America: Strong regulatory frameworks, high technological maturity, and early adoption drive market leadership.
- Europe: Growing awareness of data privacy regulations and increasing IoT adoption are fostering market growth.
- Asia-Pacific: Rapid technological advancements, increasing government investments, and expanding IoT deployments fuel high growth potential.
- Rest of the World: Emerging economies with growing IoT infrastructure are showing promising growth trajectory.
IoT Security as a Service Product Landscape
The IoT Security as a Service market offers a diverse range of products, including device security, network security, data security, and application security solutions. These solutions are increasingly incorporating AI-powered threat detection, behavioral analytics, and automated incident response capabilities. Key features include real-time threat monitoring, vulnerability management, and compliance reporting. The focus is on delivering seamless integration with existing IT infrastructure and providing scalable, cost-effective security solutions tailored to diverse IoT deployments.
Key Drivers, Barriers & Challenges in IoT Security as a Service
Key Drivers: The exponential growth of IoT devices, increasing cyber threats targeting connected devices, and rising demand for secure cloud-based security solutions are primary market drivers. Government initiatives promoting cybersecurity and data privacy further fuel market growth.
Key Challenges: Integration complexities across diverse IoT ecosystems, high implementation costs for certain advanced features, and the need for skilled cybersecurity professionals represent significant barriers. Supply chain disruptions can impact the availability of security solutions, and regulatory compliance requirements can be challenging to meet. Intense competition among vendors further increases market pressures.
Emerging Opportunities in IoT Security as a Service
Emerging opportunities include the expansion of IoT security solutions into untapped markets like industrial IoT (IIoT) and smart cities. The growing demand for edge security solutions and the development of innovative security technologies, such as blockchain and quantum-resistant cryptography, present significant growth prospects. Furthermore, customized and specialized solutions catering to specific industry verticals are gaining traction.
Growth Accelerators in the IoT Security as a Service Industry
Technological advancements in AI, machine learning, and blockchain are creating significant growth opportunities. Strategic partnerships between security providers and IoT device manufacturers are crucial for seamless integration and broader market adoption. The expansion into new geographical markets, particularly in developing economies, presents untapped growth potential.
Key Players Shaping the IoT Security as a Service Market
- Palo Alto Networks
- Cisco
- IBM
- Fortinet
- Check Point
- McAfee
- Trend Micro
- Broadcom (Symantec)
- RSA Security
- QI-ANXIN
- Venustech
- Sangfor Technologies
- CyberArk
- TOPSEC
- Rapid7
- NSFOCUS
- DAS-security
- Asiainfo Security
- Hillstone Networks
- Dptech
- Thales
- Optiv
- U-blox
Notable Milestones in IoT Security as a Service Sector
- 2020, Q4: Palo Alto Networks launches its IoT security platform with advanced threat detection capabilities.
- 2021, Q2: Cisco acquires a specialized IoT security startup, enhancing its portfolio.
- 2022, Q3: Significant increase in investment in AI-driven IoT security solutions.
- 2023, Q1: New regulatory frameworks on data privacy further accelerate the demand.
- 2024, Q4: Several strategic partnerships formed between major players to expand market reach.
In-Depth IoT Security as a Service Market Outlook
The future of the IoT Security as a Service market looks exceptionally promising. Continued growth is driven by the ever-expanding IoT ecosystem, increasing sophistication of cyber threats, and the inherent advantages of SaaS solutions. Strategic partnerships, technological innovation, and expansion into new markets will shape the industry's future. The market is poised for sustained growth, with significant opportunities for both established players and new entrants. Focus on AI-powered solutions, edge security, and compliance will be key factors for success in the coming years.
Iot Security As A Service Segmentation
-
1. Application
- 1.1. Industrial
- 1.2. Retailing
- 1.3. Medical Care
- 1.4. Automobile
- 1.5. Other
-
2. Type
- 2.1. Cloud Based
- 2.2. On Premises
Iot Security As A Service Segmentation By Geography
-
1. North America
- 1.1. United States
- 1.2. Canada
- 1.3. Mexico
-
2. South America
- 2.1. Brazil
- 2.2. Argentina
- 2.3. Rest of South America
-
3. Europe
- 3.1. United Kingdom
- 3.2. Germany
- 3.3. France
- 3.4. Italy
- 3.5. Spain
- 3.6. Russia
- 3.7. Benelux
- 3.8. Nordics
- 3.9. Rest of Europe
-
4. Middle East & Africa
- 4.1. Turkey
- 4.2. Israel
- 4.3. GCC
- 4.4. North Africa
- 4.5. South Africa
- 4.6. Rest of Middle East & Africa
-
5. Asia Pacific
- 5.1. China
- 5.2. India
- 5.3. Japan
- 5.4. South Korea
- 5.5. ASEAN
- 5.6. Oceania
- 5.7. Rest of Asia Pacific
Iot Security As A Service REPORT HIGHLIGHTS
| Aspects | Details |
|---|---|
| Study Period | 2019-2033 |
| Base Year | 2024 |
| Estimated Year | 2025 |
| Forecast Period | 2025-2033 |
| Historical Period | 2019-2024 |
| Growth Rate | CAGR of XXX% from 2019-2033 |
| Segmentation |
|
Table of Contents
- 1. Introduction
- 1.1. Research Scope
- 1.2. Market Segmentation
- 1.3. Research Methodology
- 1.4. Definitions and Assumptions
- 2. Executive Summary
- 2.1. Introduction
- 3. Market Dynamics
- 3.1. Introduction
- 3.2. Market Drivers
- 3.3. Market Restrains
- 3.4. Market Trends
- 4. Market Factor Analysis
- 4.1. Porters Five Forces
- 4.2. Supply/Value Chain
- 4.3. PESTEL analysis
- 4.4. Market Entropy
- 4.5. Patent/Trademark Analysis
- 5. Global Iot Security As A Service Analysis, Insights and Forecast, 2019-2031
- 5.1. Market Analysis, Insights and Forecast - by Application
- 5.1.1. Industrial
- 5.1.2. Retailing
- 5.1.3. Medical Care
- 5.1.4. Automobile
- 5.1.5. Other
- 5.2. Market Analysis, Insights and Forecast - by Type
- 5.2.1. Cloud Based
- 5.2.2. On Premises
- 5.3. Market Analysis, Insights and Forecast - by Region
- 5.3.1. North America
- 5.3.2. South America
- 5.3.3. Europe
- 5.3.4. Middle East & Africa
- 5.3.5. Asia Pacific
- 5.1. Market Analysis, Insights and Forecast - by Application
- 6. North America Iot Security As A Service Analysis, Insights and Forecast, 2019-2031
- 6.1. Market Analysis, Insights and Forecast - by Application
- 6.1.1. Industrial
- 6.1.2. Retailing
- 6.1.3. Medical Care
- 6.1.4. Automobile
- 6.1.5. Other
- 6.2. Market Analysis, Insights and Forecast - by Type
- 6.2.1. Cloud Based
- 6.2.2. On Premises
- 6.1. Market Analysis, Insights and Forecast - by Application
- 7. South America Iot Security As A Service Analysis, Insights and Forecast, 2019-2031
- 7.1. Market Analysis, Insights and Forecast - by Application
- 7.1.1. Industrial
- 7.1.2. Retailing
- 7.1.3. Medical Care
- 7.1.4. Automobile
- 7.1.5. Other
- 7.2. Market Analysis, Insights and Forecast - by Type
- 7.2.1. Cloud Based
- 7.2.2. On Premises
- 7.1. Market Analysis, Insights and Forecast - by Application
- 8. Europe Iot Security As A Service Analysis, Insights and Forecast, 2019-2031
- 8.1. Market Analysis, Insights and Forecast - by Application
- 8.1.1. Industrial
- 8.1.2. Retailing
- 8.1.3. Medical Care
- 8.1.4. Automobile
- 8.1.5. Other
- 8.2. Market Analysis, Insights and Forecast - by Type
- 8.2.1. Cloud Based
- 8.2.2. On Premises
- 8.1. Market Analysis, Insights and Forecast - by Application
- 9. Middle East & Africa Iot Security As A Service Analysis, Insights and Forecast, 2019-2031
- 9.1. Market Analysis, Insights and Forecast - by Application
- 9.1.1. Industrial
- 9.1.2. Retailing
- 9.1.3. Medical Care
- 9.1.4. Automobile
- 9.1.5. Other
- 9.2. Market Analysis, Insights and Forecast - by Type
- 9.2.1. Cloud Based
- 9.2.2. On Premises
- 9.1. Market Analysis, Insights and Forecast - by Application
- 10. Asia Pacific Iot Security As A Service Analysis, Insights and Forecast, 2019-2031
- 10.1. Market Analysis, Insights and Forecast - by Application
- 10.1.1. Industrial
- 10.1.2. Retailing
- 10.1.3. Medical Care
- 10.1.4. Automobile
- 10.1.5. Other
- 10.2. Market Analysis, Insights and Forecast - by Type
- 10.2.1. Cloud Based
- 10.2.2. On Premises
- 10.1. Market Analysis, Insights and Forecast - by Application
- 11. Competitive Analysis
- 11.1. Global Market Share Analysis 2024
- 11.2. Company Profiles
- 11.2.1 Palo Alto Networks
- 11.2.1.1. Overview
- 11.2.1.2. Products
- 11.2.1.3. SWOT Analysis
- 11.2.1.4. Recent Developments
- 11.2.1.5. Financials (Based on Availability)
- 11.2.2 Cisco
- 11.2.2.1. Overview
- 11.2.2.2. Products
- 11.2.2.3. SWOT Analysis
- 11.2.2.4. Recent Developments
- 11.2.2.5. Financials (Based on Availability)
- 11.2.3 IBM
- 11.2.3.1. Overview
- 11.2.3.2. Products
- 11.2.3.3. SWOT Analysis
- 11.2.3.4. Recent Developments
- 11.2.3.5. Financials (Based on Availability)
- 11.2.4 Fortinet
- 11.2.4.1. Overview
- 11.2.4.2. Products
- 11.2.4.3. SWOT Analysis
- 11.2.4.4. Recent Developments
- 11.2.4.5. Financials (Based on Availability)
- 11.2.5 Check Point
- 11.2.5.1. Overview
- 11.2.5.2. Products
- 11.2.5.3. SWOT Analysis
- 11.2.5.4. Recent Developments
- 11.2.5.5. Financials (Based on Availability)
- 11.2.6 McAfee
- 11.2.6.1. Overview
- 11.2.6.2. Products
- 11.2.6.3. SWOT Analysis
- 11.2.6.4. Recent Developments
- 11.2.6.5. Financials (Based on Availability)
- 11.2.7 Trend Micro
- 11.2.7.1. Overview
- 11.2.7.2. Products
- 11.2.7.3. SWOT Analysis
- 11.2.7.4. Recent Developments
- 11.2.7.5. Financials (Based on Availability)
- 11.2.8 Broadcom (Symantec)
- 11.2.8.1. Overview
- 11.2.8.2. Products
- 11.2.8.3. SWOT Analysis
- 11.2.8.4. Recent Developments
- 11.2.8.5. Financials (Based on Availability)
- 11.2.9 RSA Security
- 11.2.9.1. Overview
- 11.2.9.2. Products
- 11.2.9.3. SWOT Analysis
- 11.2.9.4. Recent Developments
- 11.2.9.5. Financials (Based on Availability)
- 11.2.10 QI-ANXIN
- 11.2.10.1. Overview
- 11.2.10.2. Products
- 11.2.10.3. SWOT Analysis
- 11.2.10.4. Recent Developments
- 11.2.10.5. Financials (Based on Availability)
- 11.2.11 Venustech
- 11.2.11.1. Overview
- 11.2.11.2. Products
- 11.2.11.3. SWOT Analysis
- 11.2.11.4. Recent Developments
- 11.2.11.5. Financials (Based on Availability)
- 11.2.12 Sangfor Technologies
- 11.2.12.1. Overview
- 11.2.12.2. Products
- 11.2.12.3. SWOT Analysis
- 11.2.12.4. Recent Developments
- 11.2.12.5. Financials (Based on Availability)
- 11.2.13 CyberArk
- 11.2.13.1. Overview
- 11.2.13.2. Products
- 11.2.13.3. SWOT Analysis
- 11.2.13.4. Recent Developments
- 11.2.13.5. Financials (Based on Availability)
- 11.2.14 TOPSEC
- 11.2.14.1. Overview
- 11.2.14.2. Products
- 11.2.14.3. SWOT Analysis
- 11.2.14.4. Recent Developments
- 11.2.14.5. Financials (Based on Availability)
- 11.2.15 Rapid7
- 11.2.15.1. Overview
- 11.2.15.2. Products
- 11.2.15.3. SWOT Analysis
- 11.2.15.4. Recent Developments
- 11.2.15.5. Financials (Based on Availability)
- 11.2.16 NSFOCUS
- 11.2.16.1. Overview
- 11.2.16.2. Products
- 11.2.16.3. SWOT Analysis
- 11.2.16.4. Recent Developments
- 11.2.16.5. Financials (Based on Availability)
- 11.2.17 DAS-security
- 11.2.17.1. Overview
- 11.2.17.2. Products
- 11.2.17.3. SWOT Analysis
- 11.2.17.4. Recent Developments
- 11.2.17.5. Financials (Based on Availability)
- 11.2.18 Asiainfo Security
- 11.2.18.1. Overview
- 11.2.18.2. Products
- 11.2.18.3. SWOT Analysis
- 11.2.18.4. Recent Developments
- 11.2.18.5. Financials (Based on Availability)
- 11.2.19 Hillstone Networks
- 11.2.19.1. Overview
- 11.2.19.2. Products
- 11.2.19.3. SWOT Analysis
- 11.2.19.4. Recent Developments
- 11.2.19.5. Financials (Based on Availability)
- 11.2.20 Dptech
- 11.2.20.1. Overview
- 11.2.20.2. Products
- 11.2.20.3. SWOT Analysis
- 11.2.20.4. Recent Developments
- 11.2.20.5. Financials (Based on Availability)
- 11.2.21 Thales
- 11.2.21.1. Overview
- 11.2.21.2. Products
- 11.2.21.3. SWOT Analysis
- 11.2.21.4. Recent Developments
- 11.2.21.5. Financials (Based on Availability)
- 11.2.22 Optiv
- 11.2.22.1. Overview
- 11.2.22.2. Products
- 11.2.22.3. SWOT Analysis
- 11.2.22.4. Recent Developments
- 11.2.22.5. Financials (Based on Availability)
- 11.2.23 U-blox
- 11.2.23.1. Overview
- 11.2.23.2. Products
- 11.2.23.3. SWOT Analysis
- 11.2.23.4. Recent Developments
- 11.2.23.5. Financials (Based on Availability)
- 11.2.1 Palo Alto Networks
List of Figures
- Figure 1: Global Iot Security As A Service Revenue Breakdown (million, %) by Region 2024 & 2032
- Figure 2: North America Iot Security As A Service Revenue (million), by Application 2024 & 2032
- Figure 3: North America Iot Security As A Service Revenue Share (%), by Application 2024 & 2032
- Figure 4: North America Iot Security As A Service Revenue (million), by Type 2024 & 2032
- Figure 5: North America Iot Security As A Service Revenue Share (%), by Type 2024 & 2032
- Figure 6: North America Iot Security As A Service Revenue (million), by Country 2024 & 2032
- Figure 7: North America Iot Security As A Service Revenue Share (%), by Country 2024 & 2032
- Figure 8: South America Iot Security As A Service Revenue (million), by Application 2024 & 2032
- Figure 9: South America Iot Security As A Service Revenue Share (%), by Application 2024 & 2032
- Figure 10: South America Iot Security As A Service Revenue (million), by Type 2024 & 2032
- Figure 11: South America Iot Security As A Service Revenue Share (%), by Type 2024 & 2032
- Figure 12: South America Iot Security As A Service Revenue (million), by Country 2024 & 2032
- Figure 13: South America Iot Security As A Service Revenue Share (%), by Country 2024 & 2032
- Figure 14: Europe Iot Security As A Service Revenue (million), by Application 2024 & 2032
- Figure 15: Europe Iot Security As A Service Revenue Share (%), by Application 2024 & 2032
- Figure 16: Europe Iot Security As A Service Revenue (million), by Type 2024 & 2032
- Figure 17: Europe Iot Security As A Service Revenue Share (%), by Type 2024 & 2032
- Figure 18: Europe Iot Security As A Service Revenue (million), by Country 2024 & 2032
- Figure 19: Europe Iot Security As A Service Revenue Share (%), by Country 2024 & 2032
- Figure 20: Middle East & Africa Iot Security As A Service Revenue (million), by Application 2024 & 2032
- Figure 21: Middle East & Africa Iot Security As A Service Revenue Share (%), by Application 2024 & 2032
- Figure 22: Middle East & Africa Iot Security As A Service Revenue (million), by Type 2024 & 2032
- Figure 23: Middle East & Africa Iot Security As A Service Revenue Share (%), by Type 2024 & 2032
- Figure 24: Middle East & Africa Iot Security As A Service Revenue (million), by Country 2024 & 2032
- Figure 25: Middle East & Africa Iot Security As A Service Revenue Share (%), by Country 2024 & 2032
- Figure 26: Asia Pacific Iot Security As A Service Revenue (million), by Application 2024 & 2032
- Figure 27: Asia Pacific Iot Security As A Service Revenue Share (%), by Application 2024 & 2032
- Figure 28: Asia Pacific Iot Security As A Service Revenue (million), by Type 2024 & 2032
- Figure 29: Asia Pacific Iot Security As A Service Revenue Share (%), by Type 2024 & 2032
- Figure 30: Asia Pacific Iot Security As A Service Revenue (million), by Country 2024 & 2032
- Figure 31: Asia Pacific Iot Security As A Service Revenue Share (%), by Country 2024 & 2032
List of Tables
- Table 1: Global Iot Security As A Service Revenue million Forecast, by Region 2019 & 2032
- Table 2: Global Iot Security As A Service Revenue million Forecast, by Application 2019 & 2032
- Table 3: Global Iot Security As A Service Revenue million Forecast, by Type 2019 & 2032
- Table 4: Global Iot Security As A Service Revenue million Forecast, by Region 2019 & 2032
- Table 5: Global Iot Security As A Service Revenue million Forecast, by Application 2019 & 2032
- Table 6: Global Iot Security As A Service Revenue million Forecast, by Type 2019 & 2032
- Table 7: Global Iot Security As A Service Revenue million Forecast, by Country 2019 & 2032
- Table 8: United States Iot Security As A Service Revenue (million) Forecast, by Application 2019 & 2032
- Table 9: Canada Iot Security As A Service Revenue (million) Forecast, by Application 2019 & 2032
- Table 10: Mexico Iot Security As A Service Revenue (million) Forecast, by Application 2019 & 2032
- Table 11: Global Iot Security As A Service Revenue million Forecast, by Application 2019 & 2032
- Table 12: Global Iot Security As A Service Revenue million Forecast, by Type 2019 & 2032
- Table 13: Global Iot Security As A Service Revenue million Forecast, by Country 2019 & 2032
- Table 14: Brazil Iot Security As A Service Revenue (million) Forecast, by Application 2019 & 2032
- Table 15: Argentina Iot Security As A Service Revenue (million) Forecast, by Application 2019 & 2032
- Table 16: Rest of South America Iot Security As A Service Revenue (million) Forecast, by Application 2019 & 2032
- Table 17: Global Iot Security As A Service Revenue million Forecast, by Application 2019 & 2032
- Table 18: Global Iot Security As A Service Revenue million Forecast, by Type 2019 & 2032
- Table 19: Global Iot Security As A Service Revenue million Forecast, by Country 2019 & 2032
- Table 20: United Kingdom Iot Security As A Service Revenue (million) Forecast, by Application 2019 & 2032
- Table 21: Germany Iot Security As A Service Revenue (million) Forecast, by Application 2019 & 2032
- Table 22: France Iot Security As A Service Revenue (million) Forecast, by Application 2019 & 2032
- Table 23: Italy Iot Security As A Service Revenue (million) Forecast, by Application 2019 & 2032
- Table 24: Spain Iot Security As A Service Revenue (million) Forecast, by Application 2019 & 2032
- Table 25: Russia Iot Security As A Service Revenue (million) Forecast, by Application 2019 & 2032
- Table 26: Benelux Iot Security As A Service Revenue (million) Forecast, by Application 2019 & 2032
- Table 27: Nordics Iot Security As A Service Revenue (million) Forecast, by Application 2019 & 2032
- Table 28: Rest of Europe Iot Security As A Service Revenue (million) Forecast, by Application 2019 & 2032
- Table 29: Global Iot Security As A Service Revenue million Forecast, by Application 2019 & 2032
- Table 30: Global Iot Security As A Service Revenue million Forecast, by Type 2019 & 2032
- Table 31: Global Iot Security As A Service Revenue million Forecast, by Country 2019 & 2032
- Table 32: Turkey Iot Security As A Service Revenue (million) Forecast, by Application 2019 & 2032
- Table 33: Israel Iot Security As A Service Revenue (million) Forecast, by Application 2019 & 2032
- Table 34: GCC Iot Security As A Service Revenue (million) Forecast, by Application 2019 & 2032
- Table 35: North Africa Iot Security As A Service Revenue (million) Forecast, by Application 2019 & 2032
- Table 36: South Africa Iot Security As A Service Revenue (million) Forecast, by Application 2019 & 2032
- Table 37: Rest of Middle East & Africa Iot Security As A Service Revenue (million) Forecast, by Application 2019 & 2032
- Table 38: Global Iot Security As A Service Revenue million Forecast, by Application 2019 & 2032
- Table 39: Global Iot Security As A Service Revenue million Forecast, by Type 2019 & 2032
- Table 40: Global Iot Security As A Service Revenue million Forecast, by Country 2019 & 2032
- Table 41: China Iot Security As A Service Revenue (million) Forecast, by Application 2019 & 2032
- Table 42: India Iot Security As A Service Revenue (million) Forecast, by Application 2019 & 2032
- Table 43: Japan Iot Security As A Service Revenue (million) Forecast, by Application 2019 & 2032
- Table 44: South Korea Iot Security As A Service Revenue (million) Forecast, by Application 2019 & 2032
- Table 45: ASEAN Iot Security As A Service Revenue (million) Forecast, by Application 2019 & 2032
- Table 46: Oceania Iot Security As A Service Revenue (million) Forecast, by Application 2019 & 2032
- Table 47: Rest of Asia Pacific Iot Security As A Service Revenue (million) Forecast, by Application 2019 & 2032
Frequently Asked Questions
1. What is the projected Compound Annual Growth Rate (CAGR) of the Iot Security As A Service?
The projected CAGR is approximately XXX%.
2. Which companies are prominent players in the Iot Security As A Service?
Key companies in the market include Palo Alto Networks, Cisco, IBM, Fortinet, Check Point, McAfee, Trend Micro, Broadcom (Symantec), RSA Security, QI-ANXIN, Venustech, Sangfor Technologies, CyberArk, TOPSEC, Rapid7, NSFOCUS, DAS-security, Asiainfo Security, Hillstone Networks, Dptech, Thales, Optiv, U-blox.
3. What are the main segments of the Iot Security As A Service?
The market segments include Application, Type.
4. Can you provide details about the market size?
The market size is estimated to be USD XXX million as of 2022.
5. What are some drivers contributing to market growth?
N/A
6. What are the notable trends driving market growth?
N/A
7. Are there any restraints impacting market growth?
N/A
8. Can you provide examples of recent developments in the market?
N/A
9. What pricing options are available for accessing the report?
Pricing options include single-user, multi-user, and enterprise licenses priced at USD 2900.00, USD 4350.00, and USD 5800.00 respectively.
10. Is the market size provided in terms of value or volume?
The market size is provided in terms of value, measured in million.
11. Are there any specific market keywords associated with the report?
Yes, the market keyword associated with the report is "Iot Security As A Service," which aids in identifying and referencing the specific market segment covered.
12. How do I determine which pricing option suits my needs best?
The pricing options vary based on user requirements and access needs. Individual users may opt for single-user licenses, while businesses requiring broader access may choose multi-user or enterprise licenses for cost-effective access to the report.
13. Are there any additional resources or data provided in the Iot Security As A Service report?
While the report offers comprehensive insights, it's advisable to review the specific contents or supplementary materials provided to ascertain if additional resources or data are available.
14. How can I stay updated on further developments or reports in the Iot Security As A Service?
To stay informed about further developments, trends, and reports in the Iot Security As A Service, consider subscribing to industry newsletters, following relevant companies and organizations, or regularly checking reputable industry news sources and publications.
Methodology
Step 1 - Identification of Relevant Samples Size from Population Database


Step 2 - Approaches for Defining Global Market Size (Value, Volume* & Price*)

Note*: In applicable scenarios
Step 3 - Data Sources
Primary Research
- Web Analytics
- Survey Reports
- Research Institute
- Latest Research Reports
- Opinion Leaders
Secondary Research
- Annual Reports
- White Paper
- Latest Press Release
- Industry Association
- Paid Database
- Investor Presentations

Step 4 - Data Triangulation
Involves using different sources of information in order to increase the validity of a study
These sources are likely to be stakeholders in a program - participants, other researchers, program staff, other community members, and so on.
Then we put all data in single framework & apply various statistical tools to find out the dynamic on the market.
During the analysis stage, feedback from the stakeholder groups would be compared to determine areas of agreement as well as areas of divergence
