

Key Insights
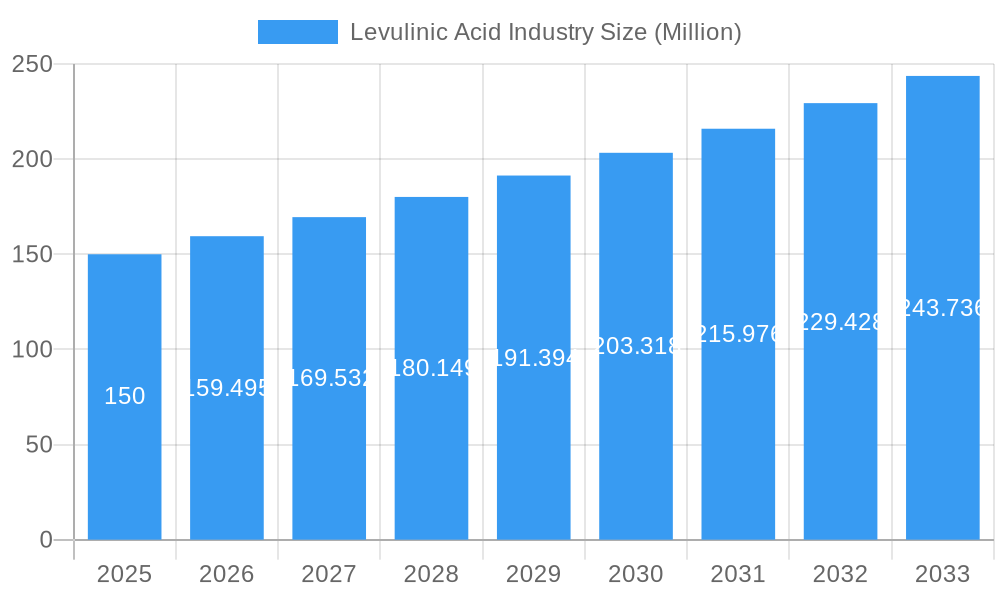
The global Levulinic Acid market is poised for significant expansion, projected to reach approximately USD 150 million by 2025 and grow at a Compound Annual Growth Rate (CAGR) of 6.13% through 2033. This robust growth is propelled by a confluence of factors, primarily driven by the increasing demand for sustainable and bio-based chemicals across diverse end-user industries. The expanding applications in cosmetics and personal care, pharmaceuticals, and polymers are acting as key accelerators, fueled by a global shift towards eco-friendly alternatives and a growing awareness of the versatile functionalities of levulinic acid. Its potential as a platform chemical, capable of being converted into a wide array of valuable derivatives, further solidifies its market position. Key market drivers include stringent environmental regulations promoting the use of renewable resources, advancements in production technologies making bio-based levulinic acid more cost-competitive, and the continuous innovation in its downstream applications. For instance, its role in producing bio-plastics, solvents, and fuel additives is gaining considerable traction.
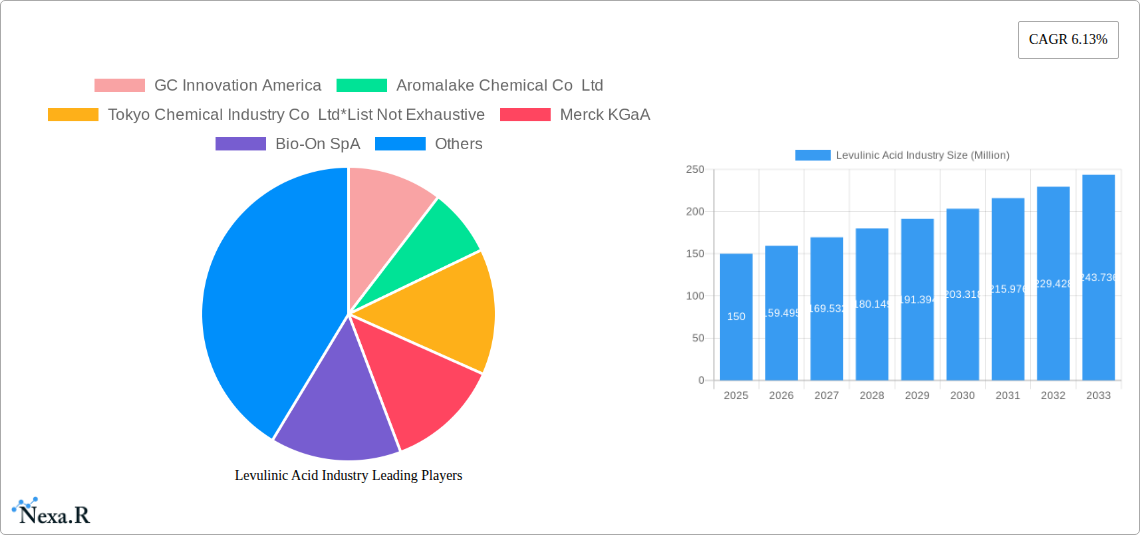
Levulinic Acid Industry Market Size (In Million)
The market, however, faces certain restraints that warrant strategic attention. These include the fluctuating costs of feedstock, primarily biomass, which can impact overall production economics. Furthermore, the development and scaling of efficient and cost-effective production processes remain an ongoing challenge. Despite these hurdles, the prevailing trends point towards a promising future. The exploration of novel applications in advanced materials and specialty chemicals, coupled with the increasing adoption of lignocellulosic biomass as a feedstock, are likely to offset these limitations. Geographically, Asia Pacific is expected to emerge as a dominant region, driven by strong industrial growth in countries like China and India, and supportive government initiatives promoting green chemistry. North America and Europe also represent significant markets, characterized by mature regulatory frameworks and a strong emphasis on sustainable product development.
Levulinic Acid Industry Company Market Share
Levulinic Acid Industry: A Comprehensive Market Analysis and Future Outlook (2019-2033)
This report offers an in-depth examination of the global Levulinic Acid market, a versatile platform chemical poised for significant expansion. Delve into market dynamics, growth trajectories, regional dominance, product innovations, and strategic opportunities shaping this crucial bio-based industry. The study encompasses the historical period from 2019 to 2024, with a base year of 2025 and a robust forecast extending to 2033. We analyze the market by parent and child segments, providing granular insights for industry professionals and investors. All monetary values are presented in Million units.
Levulinic Acid Industry Market Dynamics & Structure
The Levulinic Acid industry is characterized by a moderately concentrated market structure, with a handful of key players dominating production and innovation. Technological advancements in bio-based production processes are a primary driver, enabling more cost-effective and sustainable manufacturing. Regulatory frameworks, particularly those promoting bio-based chemicals and reducing reliance on fossil fuels, are increasingly supportive. Competitive product substitutes, such as other bio-based platform chemicals, exist but often lack the broad applicability of levulinic acid. End-user demographics are shifting towards sustainable and ethically sourced products, bolstering demand. Merger and acquisition (M&A) trends are observed as companies seek to expand their product portfolios, secure supply chains, and gain market share. For instance, the estimated M&A deal volume in the bio-based chemicals sector has seen a steady increase, with the Levulinic Acid market expected to reflect this trend. Innovation barriers primarily revolve around scaling up bio-production efficiently and achieving price parity with petrochemical alternatives in certain applications.
- Market Concentration: Moderately concentrated, with key players holding significant market shares in specific regions and applications.
- Technological Innovation Drivers: Focus on improving fermentation yields, developing novel catalytic pathways, and exploring diverse feedstock utilization.
- Regulatory Frameworks: Growing emphasis on green chemistry mandates and bio-based content certifications.
- Competitive Product Substitutes: Other bio-based acids and petrochemical-derived intermediates.
- End-User Demographics: Increasing consumer preference for sustainable and bio-derived ingredients.
- M&A Trends: Strategic acquisitions to enhance production capacity and broaden application reach.
Levulinic Acid Industry Growth Trends & Insights
The Levulinic Acid market is experiencing robust growth, driven by its versatility as a platform chemical and the increasing global imperative for sustainable alternatives. The market size is projected to witness a Compound Annual Growth Rate (CAGR) of approximately xx% from 2025 to 2033, reaching an estimated market value of xx Million units by 2033. Adoption rates are accelerating across various end-user industries, spurred by performance benefits and eco-friendly attributes. Technological disruptions, particularly in the realm of advanced biorefinery processes, are enhancing production efficiency and expanding the range of accessible feedstocks. Consumer behavior is also playing a pivotal role, with a growing demand for products that are environmentally responsible and derived from renewable resources. This shift is directly impacting industries like cosmetics and personal care, where bio-based ingredients are becoming a significant selling point. Furthermore, the development of novel applications for levulinic acid derivatives, such as advanced bioplastics and performance chemicals, is creating new avenues for market penetration. The ability to substitute petrochemical-based intermediates with a more sustainable bio-based alternative is a key factor driving this growth, making levulinic acid an attractive option for manufacturers looking to enhance their environmental credentials. The ongoing research and development efforts are crucial in unlocking the full potential of levulinic acid, leading to higher adoption rates and a significant expansion of its market reach. This expansion is not limited to established applications but extends to emerging sectors, indicating a diversified and resilient growth trajectory for the Levulinic Acid industry.
Dominant Regions, Countries, or Segments in Levulinic Acid Industry
The Cosmetics and Personal Care segment is currently a dominant driver of growth within the Levulinic Acid industry, showcasing strong market penetration and an increasing share of market value, projected to reach xx Million units by 2033. This dominance is fueled by a significant shift in consumer preferences towards natural, bio-based, and sustainable ingredients in skincare, haircare, and other personal hygiene products. Regulatory support for eco-friendly formulations and a growing awareness of the environmental impact of traditional cosmetic ingredients further bolster demand for levulinic acid and its derivatives.
- Cosmetics and Personal Care: This segment is leading the market due to increasing consumer demand for natural and sustainable ingredients, with an estimated market share of xx% in 2025. Key drivers include the use of levulinic acid derivatives as humectants, preservatives, and active ingredients in formulations. Economic policies favoring green product development and growing consumer awareness of ingredient sourcing contribute to its ascendancy.
- Pharmaceuticals: A significant and growing market, driven by the use of levulinic acid as a precursor for pharmaceutical intermediates and active pharmaceutical ingredients (APIs). The bio-based nature of levulinic acid aligns with the pharmaceutical industry's increasing focus on sustainable manufacturing processes. The global pharmaceutical market's robust growth, coupled with the demand for greener chemical synthesis, positions this segment for substantial expansion.
- Polymers and Plasticizers: This segment presents a substantial growth opportunity, particularly with the development of bio-based polymers and biodegradable plastics. Levulinic acid can be used to produce precursors for novel bioplastics, offering a sustainable alternative to conventional petroleum-based plastics. Infrastructure development supporting the circular economy and stringent regulations on plastic waste are key growth accelerators.
- Fuel and Fuel Additives: While historically a significant application, the growth in this segment is influenced by evolving energy policies and the development of alternative fuels. Levulinic acid can be converted into biofuels and fuel additives, offering a renewable component. The market's growth here is tied to global energy transitions and the drive towards decarbonization.
- Flavors and Fragrances: Levulinic acid derivatives can be used in the creation of certain flavor and fragrance compounds, contributing to its market presence. The demand for natural and bio-derived ingredients in this sector is a positive indicator for growth.
- Other End-user Industries: This includes applications in agrochemicals, textiles, and industrial solvents, offering further diversification and growth potential for the Levulinic Acid market.
Levulinic Acid Industry Product Landscape
The Levulinic Acid product landscape is characterized by continuous innovation and expanding applications. Key product developments include the synthesis of novel levulinic acid esters and amides, which exhibit enhanced performance characteristics for specific end-uses. These derivatives are finding increased utility as bio-based plasticizers, offering a sustainable alternative to phthalate-based plasticizers. In the realm of fuels, research is focused on efficient conversion pathways of levulinic acid to high-energy-density biofuels. Furthermore, its role as a versatile building block is being leveraged to create advanced polymers with improved biodegradability and mechanical properties. The performance metrics of these products are consistently being optimized for greater efficiency and cost-effectiveness, driving their adoption across various industries.
Key Drivers, Barriers & Challenges in Levulinic Acid Industry
Key Drivers: The Levulinic Acid industry is propelled by a confluence of factors, most notably the escalating global demand for bio-based and sustainable chemicals. Technological advancements in biorefining and fermentation processes are enhancing production efficiency and reducing costs. Favorable regulatory landscapes, including government incentives and mandates promoting renewable resources, are creating a conducive environment for market growth. The increasing awareness and preference for eco-friendly products among consumers and industries alike are also significant drivers. Furthermore, the versatility of levulinic acid as a platform chemical, enabling its application in a wide array of products from polymers to pharmaceuticals, fuels its expansion.
Barriers & Challenges: Despite its promising outlook, the Levulinic Acid market faces several challenges. The primary barrier is achieving cost competitiveness with established petrochemical alternatives, especially for large-scale commodity applications. Scaling up bio-production processes to meet growing demand remains a technical and logistical hurdle. Fluctuations in feedstock availability and pricing can impact production costs and stability. Regulatory hurdles and the need for standardization in bio-based product certifications can also slow down market adoption. Intense competition from other bio-based platform chemicals and existing petrochemical derivatives poses a constant challenge. Supply chain complexities and the need for robust infrastructure for bio-based materials can also present obstacles.
Emerging Opportunities in Levulinic Acid Industry
Emerging opportunities within the Levulinic Acid industry are abundant and diverse. The development of novel bio-based polymers with tailored properties for specific applications, such as biodegradable packaging and advanced composites, presents a significant growth avenue. Untapped markets in emerging economies are ripe for penetration, driven by increasing environmental consciousness and supportive government policies. The continuous exploration of new catalytic pathways and conversion technologies for levulinic acid derivatives is opening doors to innovative applications in specialty chemicals and advanced materials. Evolving consumer preferences for natural and sustainable ingredients in a broader range of product categories, beyond cosmetics and personal care, are creating new market niches. The circular economy initiatives are also fostering opportunities for levulinic acid-derived products that contribute to waste reduction and resource efficiency.
Growth Accelerators in the Levulinic Acid Industry Industry
Several catalysts are accelerating the growth of the Levulinic Acid industry. Significant investment in research and development is leading to breakthroughs in production efficiency and novel application development. Strategic partnerships and collaborations between chemical manufacturers, technology providers, and end-users are crucial for scaling up production and market adoption. Expansion into new geographical markets and the development of localized supply chains are vital for capturing global demand. The ongoing drive towards a bio-based economy, supported by global sustainability goals and government policies, provides a powerful impetus for growth. Furthermore, the increasing focus on the circular economy principles is creating a favorable environment for bio-based chemicals like levulinic acid.
Key Players Shaping the Levulinic Acid Industry Market
- GC Innovation America
- Aromalake Chemical Co Ltd
- Tokyo Chemical Industry Co Ltd
- Merck KGaA
- Bio-On SpA
- Boerchem Pharmtech Co Ltd
- Alfa Aesar Thermo Fisher Scientific
- AK Scientific Inc
- GFBiochemicals Ltd
- Ascender Chemical Co Ltd
- Summit Cosmetics Corporation
Notable Milestones in Levulinic Acid Industry Sector
- June 2022: GFBiochemicals agreed with German chemical giant BASF's European distribution organization, BTC Europe GmbH, on distributing biobased and biodegradable solvents derived from levulinic acid for the European market.
In-Depth Levulinic Acid Industry Market Outlook
The future market potential for Levulinic Acid is exceptionally bright, fueled by a sustained commitment to sustainability and bio-based innovation. Strategic opportunities lie in the further development and commercialization of high-value derivatives for advanced materials and specialty chemicals. Expanding production capacity to meet the escalating global demand and exploring new, cost-effective feedstocks will be critical for long-term success. The market is expected to witness increased M&A activities as companies seek to consolidate their positions and leverage synergies. Continued collaboration across the value chain, from feedstock suppliers to end-users, will be instrumental in driving market growth and unlocking new applications. The transition towards a circular economy and the increasing regulatory support for bio-based alternatives position Levulinic Acid as a cornerstone chemical for a more sustainable industrial future.
Levulinic Acid Industry Segmentation
-
1. End-user Industry
- 1.1. Cosmetics and Personal Care
- 1.2. Pharmaceuticals
- 1.3. Polymers and Plasticizers
- 1.4. Fuel and Fuel Additives
- 1.5. Flavors and Fragrances
- 1.6. Other End-user Industries
Levulinic Acid Industry Segmentation By Geography
-
1. Asia Pacific
- 1.1. China
- 1.2. India
- 1.3. Japan
- 1.4. South Korea
- 1.5. Rest of Asia Pacific
-
2. North America
- 2.1. United States
- 2.2. Canada
- 2.3. Mexico
-
3. Europe
- 3.1. Germany
- 3.2. United Kingdom
- 3.3. France
- 3.4. Italy
- 3.5. Rest of Europe
-
4. South America
- 4.1. Brazil
- 4.2. Argentina
- 4.3. Rest of South America
-
5. Middle East and Africa
- 5.1. Saudi Arabia
- 5.2. South Africa
- 5.3. Rest of Middle East and Africa
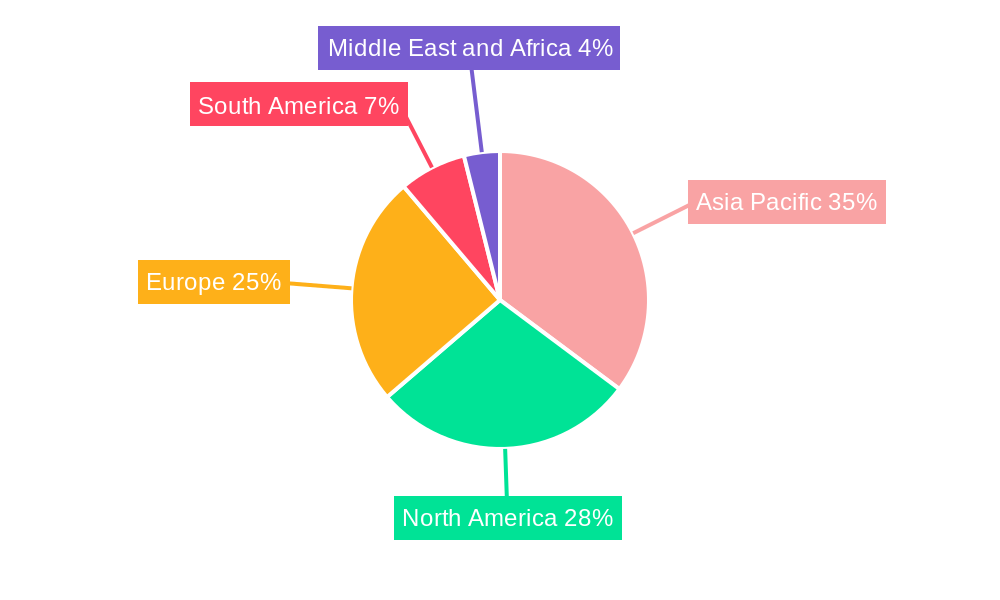
Levulinic Acid Industry Regional Market Share
Geographic Coverage of Levulinic Acid Industry
Levulinic Acid Industry REPORT HIGHLIGHTS
| Aspects | Details |
|---|---|
| Study Period | 2020-2034 |
| Base Year | 2025 |
| Estimated Year | 2026 |
| Forecast Period | 2026-2034 |
| Historical Period | 2020-2025 |
| Growth Rate | CAGR of 9.4% from 2020-2034 |
| Segmentation |
|
Table of Contents
- 1. Introduction
- 1.1. Research Scope
- 1.2. Market Segmentation
- 1.3. Research Objective
- 1.4. Definitions and Assumptions
- 2. Executive Summary
- 2.1. Market Snapshot
- 3. Market Dynamics
- 3.1. Market Drivers
- 3.2. Market Restrains
- 3.3. Market Trends
- 3.4. Market Opportunities
- 4. Market Factor Analysis
- 4.1. Porters Five Forces
- 4.1.1. Bargaining Power of Suppliers
- 4.1.2. Bargaining Power of Buyers
- 4.1.3. Threat of New Entrants
- 4.1.4. Threat of Substitutes
- 4.1.5. Competitive Rivalry
- 4.2. PESTEL analysis
- 4.3. BCG Analysis
- 4.3.1. Stars (High Growth, High Market Share)
- 4.3.2. Cash Cows (Low Growth, High Market Share)
- 4.3.3. Question Mark (High Growth, Low Market Share)
- 4.3.4. Dogs (Low Growth, Low Market Share)
- 4.4. Ansoff Matrix Analysis
- 4.5. Supply Chain Analysis
- 4.6. Regulatory Landscape
- 4.7. Current Market Potential and Opportunity Assessment (TAM–SAM–SOM Framework)
- 4.8. NRP Analyst Note
- 4.1. Porters Five Forces
- 5. Market Analysis, Insights and Forecast 2021-2033
- 5.1. Market Analysis, Insights and Forecast - by End-user Industry
- 5.1.1. Cosmetics and Personal Care
- 5.1.2. Pharmaceuticals
- 5.1.3. Polymers and Plasticizers
- 5.1.4. Fuel and Fuel Additives
- 5.1.5. Flavors and Fragrances
- 5.1.6. Other End-user Industries
- 5.2. Market Analysis, Insights and Forecast - by Region
- 5.2.1. Asia Pacific
- 5.2.2. North America
- 5.2.3. Europe
- 5.2.4. South America
- 5.2.5. Middle East and Africa
- 5.1. Market Analysis, Insights and Forecast - by End-user Industry
- 6. Global Levulinic Acid Industry Analysis, Insights and Forecast, 2021-2033
- 6.1. Market Analysis, Insights and Forecast - by End-user Industry
- 6.1.1. Cosmetics and Personal Care
- 6.1.2. Pharmaceuticals
- 6.1.3. Polymers and Plasticizers
- 6.1.4. Fuel and Fuel Additives
- 6.1.5. Flavors and Fragrances
- 6.1.6. Other End-user Industries
- 6.1. Market Analysis, Insights and Forecast - by End-user Industry
- 7. Asia Pacific Levulinic Acid Industry Analysis, Insights and Forecast, 2020-2032
- 7.1. Market Analysis, Insights and Forecast - by End-user Industry
- 7.1.1. Cosmetics and Personal Care
- 7.1.2. Pharmaceuticals
- 7.1.3. Polymers and Plasticizers
- 7.1.4. Fuel and Fuel Additives
- 7.1.5. Flavors and Fragrances
- 7.1.6. Other End-user Industries
- 7.1. Market Analysis, Insights and Forecast - by End-user Industry
- 8. North America Levulinic Acid Industry Analysis, Insights and Forecast, 2020-2032
- 8.1. Market Analysis, Insights and Forecast - by End-user Industry
- 8.1.1. Cosmetics and Personal Care
- 8.1.2. Pharmaceuticals
- 8.1.3. Polymers and Plasticizers
- 8.1.4. Fuel and Fuel Additives
- 8.1.5. Flavors and Fragrances
- 8.1.6. Other End-user Industries
- 8.1. Market Analysis, Insights and Forecast - by End-user Industry
- 9. Europe Levulinic Acid Industry Analysis, Insights and Forecast, 2020-2032
- 9.1. Market Analysis, Insights and Forecast - by End-user Industry
- 9.1.1. Cosmetics and Personal Care
- 9.1.2. Pharmaceuticals
- 9.1.3. Polymers and Plasticizers
- 9.1.4. Fuel and Fuel Additives
- 9.1.5. Flavors and Fragrances
- 9.1.6. Other End-user Industries
- 9.1. Market Analysis, Insights and Forecast - by End-user Industry
- 10. South America Levulinic Acid Industry Analysis, Insights and Forecast, 2020-2032
- 10.1. Market Analysis, Insights and Forecast - by End-user Industry
- 10.1.1. Cosmetics and Personal Care
- 10.1.2. Pharmaceuticals
- 10.1.3. Polymers and Plasticizers
- 10.1.4. Fuel and Fuel Additives
- 10.1.5. Flavors and Fragrances
- 10.1.6. Other End-user Industries
- 10.1. Market Analysis, Insights and Forecast - by End-user Industry
- 11. Middle East and Africa Levulinic Acid Industry Analysis, Insights and Forecast, 2020-2032
- 11.1. Market Analysis, Insights and Forecast - by End-user Industry
- 11.1.1. Cosmetics and Personal Care
- 11.1.2. Pharmaceuticals
- 11.1.3. Polymers and Plasticizers
- 11.1.4. Fuel and Fuel Additives
- 11.1.5. Flavors and Fragrances
- 11.1.6. Other End-user Industries
- 11.1. Market Analysis, Insights and Forecast - by End-user Industry
- 12. Competitive Analysis
- 12.1. Company Profiles
- 12.1.1 GC Innovation America
- 12.1.1.1. Company Overview
- 12.1.1.2. Products
- 12.1.1.3. Company Financials
- 12.1.1.4. SWOT Analysis
- 12.1.2 Aromalake Chemical Co Ltd
- 12.1.2.1. Company Overview
- 12.1.2.2. Products
- 12.1.2.3. Company Financials
- 12.1.2.4. SWOT Analysis
- 12.1.3 Tokyo Chemical Industry Co Ltd*List Not Exhaustive
- 12.1.3.1. Company Overview
- 12.1.3.2. Products
- 12.1.3.3. Company Financials
- 12.1.3.4. SWOT Analysis
- 12.1.4 Merck KGaA
- 12.1.4.1. Company Overview
- 12.1.4.2. Products
- 12.1.4.3. Company Financials
- 12.1.4.4. SWOT Analysis
- 12.1.5 Bio-On SpA
- 12.1.5.1. Company Overview
- 12.1.5.2. Products
- 12.1.5.3. Company Financials
- 12.1.5.4. SWOT Analysis
- 12.1.6 Boerchem Pharmtech Co Ltd
- 12.1.6.1. Company Overview
- 12.1.6.2. Products
- 12.1.6.3. Company Financials
- 12.1.6.4. SWOT Analysis
- 12.1.7 Alfa Aesar Thermo Fisher Scientific
- 12.1.7.1. Company Overview
- 12.1.7.2. Products
- 12.1.7.3. Company Financials
- 12.1.7.4. SWOT Analysis
- 12.1.8 AK Scientific Inc
- 12.1.8.1. Company Overview
- 12.1.8.2. Products
- 12.1.8.3. Company Financials
- 12.1.8.4. SWOT Analysis
- 12.1.9 GFBiochemicals Ltd
- 12.1.9.1. Company Overview
- 12.1.9.2. Products
- 12.1.9.3. Company Financials
- 12.1.9.4. SWOT Analysis
- 12.1.10 Ascender Chemical Co Ltd
- 12.1.10.1. Company Overview
- 12.1.10.2. Products
- 12.1.10.3. Company Financials
- 12.1.10.4. SWOT Analysis
- 12.1.11 Summit Cosmetics Corporation
- 12.1.11.1. Company Overview
- 12.1.11.2. Products
- 12.1.11.3. Company Financials
- 12.1.11.4. SWOT Analysis
- 12.1.1 GC Innovation America
- 12.2. Market Entropy
- 12.2.1 Company's Key Areas Served
- 12.2.2 Recent Developments
- 12.3. Company Market Share Analysis 2025
- 12.3.1 Top 5 Companies Market Share Analysis
- 12.3.2 Top 3 Companies Market Share Analysis
- 12.4. List of Potential Customers
- 13. Research Methodology
List of Figures
- Figure 1: Global Levulinic Acid Industry Revenue Breakdown (million, %) by Region 2025 & 2033
- Figure 2: Global Levulinic Acid Industry Volume Breakdown (kilotons, %) by Region 2025 & 2033
- Figure 3: Asia Pacific Levulinic Acid Industry Revenue (million), by End-user Industry 2025 & 2033
- Figure 4: Asia Pacific Levulinic Acid Industry Volume (kilotons), by End-user Industry 2025 & 2033
- Figure 5: Asia Pacific Levulinic Acid Industry Revenue Share (%), by End-user Industry 2025 & 2033
- Figure 6: Asia Pacific Levulinic Acid Industry Volume Share (%), by End-user Industry 2025 & 2033
- Figure 7: Asia Pacific Levulinic Acid Industry Revenue (million), by Country 2025 & 2033
- Figure 8: Asia Pacific Levulinic Acid Industry Volume (kilotons), by Country 2025 & 2033
- Figure 9: Asia Pacific Levulinic Acid Industry Revenue Share (%), by Country 2025 & 2033
- Figure 10: Asia Pacific Levulinic Acid Industry Volume Share (%), by Country 2025 & 2033
- Figure 11: North America Levulinic Acid Industry Revenue (million), by End-user Industry 2025 & 2033
- Figure 12: North America Levulinic Acid Industry Volume (kilotons), by End-user Industry 2025 & 2033
- Figure 13: North America Levulinic Acid Industry Revenue Share (%), by End-user Industry 2025 & 2033
- Figure 14: North America Levulinic Acid Industry Volume Share (%), by End-user Industry 2025 & 2033
- Figure 15: North America Levulinic Acid Industry Revenue (million), by Country 2025 & 2033
- Figure 16: North America Levulinic Acid Industry Volume (kilotons), by Country 2025 & 2033
- Figure 17: North America Levulinic Acid Industry Revenue Share (%), by Country 2025 & 2033
- Figure 18: North America Levulinic Acid Industry Volume Share (%), by Country 2025 & 2033
- Figure 19: Europe Levulinic Acid Industry Revenue (million), by End-user Industry 2025 & 2033
- Figure 20: Europe Levulinic Acid Industry Volume (kilotons), by End-user Industry 2025 & 2033
- Figure 21: Europe Levulinic Acid Industry Revenue Share (%), by End-user Industry 2025 & 2033
- Figure 22: Europe Levulinic Acid Industry Volume Share (%), by End-user Industry 2025 & 2033
- Figure 23: Europe Levulinic Acid Industry Revenue (million), by Country 2025 & 2033
- Figure 24: Europe Levulinic Acid Industry Volume (kilotons), by Country 2025 & 2033
- Figure 25: Europe Levulinic Acid Industry Revenue Share (%), by Country 2025 & 2033
- Figure 26: Europe Levulinic Acid Industry Volume Share (%), by Country 2025 & 2033
- Figure 27: South America Levulinic Acid Industry Revenue (million), by End-user Industry 2025 & 2033
- Figure 28: South America Levulinic Acid Industry Volume (kilotons), by End-user Industry 2025 & 2033
- Figure 29: South America Levulinic Acid Industry Revenue Share (%), by End-user Industry 2025 & 2033
- Figure 30: South America Levulinic Acid Industry Volume Share (%), by End-user Industry 2025 & 2033
- Figure 31: South America Levulinic Acid Industry Revenue (million), by Country 2025 & 2033
- Figure 32: South America Levulinic Acid Industry Volume (kilotons), by Country 2025 & 2033
- Figure 33: South America Levulinic Acid Industry Revenue Share (%), by Country 2025 & 2033
- Figure 34: South America Levulinic Acid Industry Volume Share (%), by Country 2025 & 2033
- Figure 35: Middle East and Africa Levulinic Acid Industry Revenue (million), by End-user Industry 2025 & 2033
- Figure 36: Middle East and Africa Levulinic Acid Industry Volume (kilotons), by End-user Industry 2025 & 2033
- Figure 37: Middle East and Africa Levulinic Acid Industry Revenue Share (%), by End-user Industry 2025 & 2033
- Figure 38: Middle East and Africa Levulinic Acid Industry Volume Share (%), by End-user Industry 2025 & 2033
- Figure 39: Middle East and Africa Levulinic Acid Industry Revenue (million), by Country 2025 & 2033
- Figure 40: Middle East and Africa Levulinic Acid Industry Volume (kilotons), by Country 2025 & 2033
- Figure 41: Middle East and Africa Levulinic Acid Industry Revenue Share (%), by Country 2025 & 2033
- Figure 42: Middle East and Africa Levulinic Acid Industry Volume Share (%), by Country 2025 & 2033
List of Tables
- Table 1: Global Levulinic Acid Industry Revenue million Forecast, by End-user Industry 2020 & 2033
- Table 2: Global Levulinic Acid Industry Volume kilotons Forecast, by End-user Industry 2020 & 2033
- Table 3: Global Levulinic Acid Industry Revenue million Forecast, by Region 2020 & 2033
- Table 4: Global Levulinic Acid Industry Volume kilotons Forecast, by Region 2020 & 2033
- Table 5: Global Levulinic Acid Industry Revenue million Forecast, by End-user Industry 2020 & 2033
- Table 6: Global Levulinic Acid Industry Volume kilotons Forecast, by End-user Industry 2020 & 2033
- Table 7: Global Levulinic Acid Industry Revenue million Forecast, by Country 2020 & 2033
- Table 8: Global Levulinic Acid Industry Volume kilotons Forecast, by Country 2020 & 2033
- Table 9: China Levulinic Acid Industry Revenue (million) Forecast, by Application 2020 & 2033
- Table 10: China Levulinic Acid Industry Volume (kilotons) Forecast, by Application 2020 & 2033
- Table 11: India Levulinic Acid Industry Revenue (million) Forecast, by Application 2020 & 2033
- Table 12: India Levulinic Acid Industry Volume (kilotons) Forecast, by Application 2020 & 2033
- Table 13: Japan Levulinic Acid Industry Revenue (million) Forecast, by Application 2020 & 2033
- Table 14: Japan Levulinic Acid Industry Volume (kilotons) Forecast, by Application 2020 & 2033
- Table 15: South Korea Levulinic Acid Industry Revenue (million) Forecast, by Application 2020 & 2033
- Table 16: South Korea Levulinic Acid Industry Volume (kilotons) Forecast, by Application 2020 & 2033
- Table 17: Rest of Asia Pacific Levulinic Acid Industry Revenue (million) Forecast, by Application 2020 & 2033
- Table 18: Rest of Asia Pacific Levulinic Acid Industry Volume (kilotons) Forecast, by Application 2020 & 2033
- Table 19: Global Levulinic Acid Industry Revenue million Forecast, by End-user Industry 2020 & 2033
- Table 20: Global Levulinic Acid Industry Volume kilotons Forecast, by End-user Industry 2020 & 2033
- Table 21: Global Levulinic Acid Industry Revenue million Forecast, by Country 2020 & 2033
- Table 22: Global Levulinic Acid Industry Volume kilotons Forecast, by Country 2020 & 2033
- Table 23: United States Levulinic Acid Industry Revenue (million) Forecast, by Application 2020 & 2033
- Table 24: United States Levulinic Acid Industry Volume (kilotons) Forecast, by Application 2020 & 2033
- Table 25: Canada Levulinic Acid Industry Revenue (million) Forecast, by Application 2020 & 2033
- Table 26: Canada Levulinic Acid Industry Volume (kilotons) Forecast, by Application 2020 & 2033
- Table 27: Mexico Levulinic Acid Industry Revenue (million) Forecast, by Application 2020 & 2033
- Table 28: Mexico Levulinic Acid Industry Volume (kilotons) Forecast, by Application 2020 & 2033
- Table 29: Global Levulinic Acid Industry Revenue million Forecast, by End-user Industry 2020 & 2033
- Table 30: Global Levulinic Acid Industry Volume kilotons Forecast, by End-user Industry 2020 & 2033
- Table 31: Global Levulinic Acid Industry Revenue million Forecast, by Country 2020 & 2033
- Table 32: Global Levulinic Acid Industry Volume kilotons Forecast, by Country 2020 & 2033
- Table 33: Germany Levulinic Acid Industry Revenue (million) Forecast, by Application 2020 & 2033
- Table 34: Germany Levulinic Acid Industry Volume (kilotons) Forecast, by Application 2020 & 2033
- Table 35: United Kingdom Levulinic Acid Industry Revenue (million) Forecast, by Application 2020 & 2033
- Table 36: United Kingdom Levulinic Acid Industry Volume (kilotons) Forecast, by Application 2020 & 2033
- Table 37: France Levulinic Acid Industry Revenue (million) Forecast, by Application 2020 & 2033
- Table 38: France Levulinic Acid Industry Volume (kilotons) Forecast, by Application 2020 & 2033
- Table 39: Italy Levulinic Acid Industry Revenue (million) Forecast, by Application 2020 & 2033
- Table 40: Italy Levulinic Acid Industry Volume (kilotons) Forecast, by Application 2020 & 2033
- Table 41: Rest of Europe Levulinic Acid Industry Revenue (million) Forecast, by Application 2020 & 2033
- Table 42: Rest of Europe Levulinic Acid Industry Volume (kilotons) Forecast, by Application 2020 & 2033
- Table 43: Global Levulinic Acid Industry Revenue million Forecast, by End-user Industry 2020 & 2033
- Table 44: Global Levulinic Acid Industry Volume kilotons Forecast, by End-user Industry 2020 & 2033
- Table 45: Global Levulinic Acid Industry Revenue million Forecast, by Country 2020 & 2033
- Table 46: Global Levulinic Acid Industry Volume kilotons Forecast, by Country 2020 & 2033
- Table 47: Brazil Levulinic Acid Industry Revenue (million) Forecast, by Application 2020 & 2033
- Table 48: Brazil Levulinic Acid Industry Volume (kilotons) Forecast, by Application 2020 & 2033
- Table 49: Argentina Levulinic Acid Industry Revenue (million) Forecast, by Application 2020 & 2033
- Table 50: Argentina Levulinic Acid Industry Volume (kilotons) Forecast, by Application 2020 & 2033
- Table 51: Rest of South America Levulinic Acid Industry Revenue (million) Forecast, by Application 2020 & 2033
- Table 52: Rest of South America Levulinic Acid Industry Volume (kilotons) Forecast, by Application 2020 & 2033
- Table 53: Global Levulinic Acid Industry Revenue million Forecast, by End-user Industry 2020 & 2033
- Table 54: Global Levulinic Acid Industry Volume kilotons Forecast, by End-user Industry 2020 & 2033
- Table 55: Global Levulinic Acid Industry Revenue million Forecast, by Country 2020 & 2033
- Table 56: Global Levulinic Acid Industry Volume kilotons Forecast, by Country 2020 & 2033
- Table 57: Saudi Arabia Levulinic Acid Industry Revenue (million) Forecast, by Application 2020 & 2033
- Table 58: Saudi Arabia Levulinic Acid Industry Volume (kilotons) Forecast, by Application 2020 & 2033
- Table 59: South Africa Levulinic Acid Industry Revenue (million) Forecast, by Application 2020 & 2033
- Table 60: South Africa Levulinic Acid Industry Volume (kilotons) Forecast, by Application 2020 & 2033
- Table 61: Rest of Middle East and Africa Levulinic Acid Industry Revenue (million) Forecast, by Application 2020 & 2033
- Table 62: Rest of Middle East and Africa Levulinic Acid Industry Volume (kilotons) Forecast, by Application 2020 & 2033
Frequently Asked Questions
1. What is the projected Compound Annual Growth Rate (CAGR) of the Levulinic Acid Industry?
The projected CAGR is approximately 9.4%.
2. Which companies are prominent players in the Levulinic Acid Industry?
Key companies in the market include GC Innovation America, Aromalake Chemical Co Ltd, Tokyo Chemical Industry Co Ltd*List Not Exhaustive, Merck KGaA, Bio-On SpA, Boerchem Pharmtech Co Ltd, Alfa Aesar Thermo Fisher Scientific, AK Scientific Inc, GFBiochemicals Ltd, Ascender Chemical Co Ltd, Summit Cosmetics Corporation.
3. What are the main segments of the Levulinic Acid Industry?
The market segments include End-user Industry.
4. Can you provide details about the market size?
The market size is estimated to be USD 80 million as of 2022.
5. What are some drivers contributing to market growth?
Increasing Usage as a Substitute for Traditional Fertilizer; Other Drivers.
6. What are the notable trends driving market growth?
Cosmetics and Personal Care to Dominate the Market.
7. Are there any restraints impacting market growth?
Unfavorable Conditions Arising Due to the COVID-19 Impact.
8. Can you provide examples of recent developments in the market?
June 2022: GFBiochemicals agreed with German chemical giant BASF's European distribution organization, BTC Europe GmbH, on distributing biobased and biodegradable solvents derived from levulinic acid for the European market.
9. What pricing options are available for accessing the report?
Pricing options include single-user, multi-user, and enterprise licenses priced at USD 4750, USD 5250, and USD 8750 respectively.
10. Is the market size provided in terms of value or volume?
The market size is provided in terms of value, measured in million and volume, measured in kilotons.
11. Are there any specific market keywords associated with the report?
Yes, the market keyword associated with the report is "Levulinic Acid Industry," which aids in identifying and referencing the specific market segment covered.
12. How do I determine which pricing option suits my needs best?
The pricing options vary based on user requirements and access needs. Individual users may opt for single-user licenses, while businesses requiring broader access may choose multi-user or enterprise licenses for cost-effective access to the report.
13. Are there any additional resources or data provided in the Levulinic Acid Industry report?
While the report offers comprehensive insights, it's advisable to review the specific contents or supplementary materials provided to ascertain if additional resources or data are available.
14. How can I stay updated on further developments or reports in the Levulinic Acid Industry?
To stay informed about further developments, trends, and reports in the Levulinic Acid Industry, consider subscribing to industry newsletters, following relevant companies and organizations, or regularly checking reputable industry news sources and publications.
Methodology
Step 1 - Identification of Relevant Samples Size from Population Database


Step 2 - Approaches for Defining Global Market Size (Value, Volume* & Price*)

Note*: In applicable scenarios
Step 3 - Data Sources
Primary Research
- Web Analytics
- Survey Reports
- Research Institute
- Latest Research Reports
- Opinion Leaders
Secondary Research
- Annual Reports
- White Paper
- Latest Press Release
- Industry Association
- Paid Database
- Investor Presentations

Step 4 - Data Triangulation
Involves using different sources of information in order to increase the validity of a study
These sources are likely to be stakeholders in a program - participants, other researchers, program staff, other community members, and so on.
Then we put all data in single framework & apply various statistical tools to find out the dynamic on the market.
During the analysis stage, feedback from the stakeholder groups would be compared to determine areas of agreement as well as areas of divergence