

Key Insights
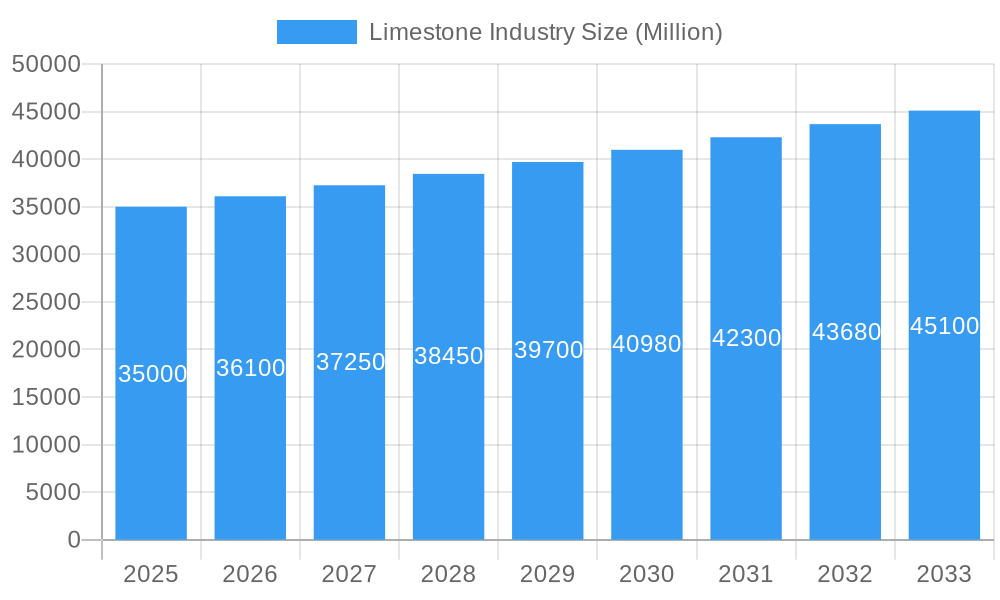
The global Limestone market is forecast for significant expansion, projected to reach $6.47 billion by 2025, with a Compound Annual Growth Rate (CAGR) of 4.7% through 2033. This growth is driven by robust demand in key sectors including construction, agriculture, and chemical manufacturing. Global urbanization and infrastructure development initiatives are increasing limestone consumption for cement, road construction, and building materials. Its critical role in water treatment, flue gas desulfurization, steel production, and chemical manufacturing further solidifies its market position. The market encompasses diverse applications such as Industry Lime, Chemical Lime, Construction Lime, and Refractory Lime, serving industries like Paper and Pulp, Water Treatment, Agriculture, Plastics, Building and Construction, and Steel Manufacturing.
Limestone Industry Market Size (In Billion)
The Asia Pacific region, propelled by rapid industrialization and infrastructure development, is anticipated to be a primary growth driver. Major players, including CARMEUSE, Lhoist Group, and LafargeHolcim, are enhancing capacity and advancing technology to meet rising demand. Challenges such as volatile raw material costs, strict environmental regulations for quarrying and processing, and high transportation expenses exist. However, innovations in processing and the development of specialized lime products are expected to offset these constraints. The market indicates sustained, healthy demand for limestone, highlighting its integral role in global industrial and economic activities.
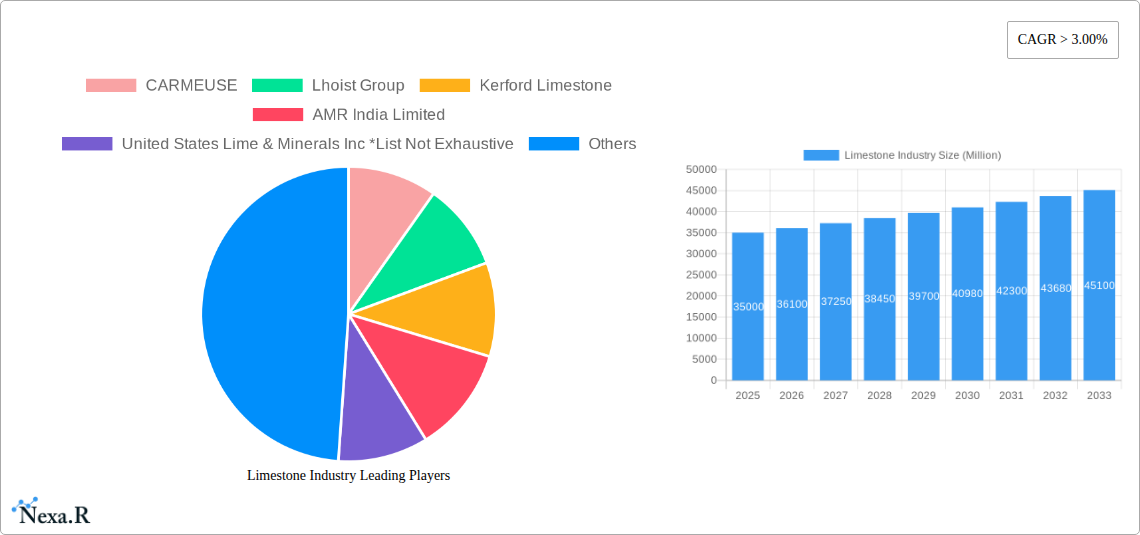
Limestone Industry Company Market Share
Unlocking Growth: Comprehensive Limestone Industry Market Analysis (2019-2033)
This in-depth report provides a definitive forecast and analysis of the global limestone market, offering critical insights into its intricate dynamics, growth trajectory, and future potential. Covering a comprehensive study period from 2019 to 2033, with a base year of 2025 and a detailed forecast period of 2025-2033, this report is an essential resource for stakeholders seeking to understand and capitalize on the evolving limestone industry. We meticulously examine parent and child markets, delivering quantitative data in million units and actionable intelligence for strategic decision-making.
Limestone Industry Market Dynamics & Structure
The limestone industry exhibits a moderately consolidated market structure, with a few dominant global players and a significant number of regional and specialized producers. Key companies like CARMEUSE, Lhoist Group, Imerys, and Omya AG command substantial market shares, influencing pricing and supply chain dynamics. Technological innovation is a significant driver, particularly in improving extraction efficiency, processing technologies for higher purity grades, and developing novel applications for calcium carbonate and lime products. Regulatory frameworks, primarily focused on environmental protection during mining and processing, alongside stringent quality standards for specific applications, shape market entry and operational costs.
- Market Concentration: Dominated by integrated players with significant global presence, but with room for niche specialization.
- Technological Innovation: Focus on sustainable extraction, energy-efficient calcination, and advanced material science for value-added products.
- Regulatory Frameworks: Environmental compliance, emission control, and land reclamation are critical operational considerations.
- Competitive Product Substitutes: While limestone is foundational, substitutes exist in certain applications (e.g., synthetic calcium carbonate in specific industries), though often at higher costs.
- End-User Demographics: Growing demand from burgeoning economies and increasing use in environmental applications are key demographic shifts.
- M&A Trends: Strategic acquisitions are prevalent for market expansion, resource acquisition, and vertical integration, as evidenced by recent deals. For instance, May 2023: Graymont acquired GCCP Resources Ltd's Gridland limestone quarry in Ipoh, Perak, enhancing its position in Malaysia.
Limestone Industry Growth Trends & Insights
The limestone market is poised for robust growth, driven by a confluence of industrial expansion, infrastructure development, and increasing environmental consciousness. The global limestone market size is projected to witness a healthy Compound Annual Growth Rate (CAGR) throughout the forecast period (2025-2033), reflecting sustained demand across its diverse applications. Adoption rates for specialized lime products in sectors like water treatment and flue gas desulfurization are accelerating, fueled by stricter environmental regulations and a growing emphasis on sustainable industrial practices. Technological disruptions are primarily focused on enhancing efficiency and reducing the environmental footprint of limestone quarrying and processing, including advancements in beneficiation techniques and the development of more energy-efficient kilns for lime production.
Consumer behavior shifts are subtly influencing the market, with an increasing preference for materials produced with minimal environmental impact and sourced responsibly. This trend is particularly evident in the construction lime segment, where eco-friendly building materials are gaining traction. The historical period (2019-2024) showcased steady growth, laying a strong foundation for the projected expansion. The estimated year 2025 marks a critical juncture where various market forces are expected to coalesce, leading to accelerated growth. Market penetration of specialized lime derivatives in new applications continues to expand, driven by research and development initiatives.
Dominant Regions, Countries, or Segments in Limestone Industry
The limestone industry's growth is unevenly distributed across regions, with Asia-Pacific currently emerging as the dominant force, primarily driven by the rapid industrialization and extensive infrastructure development in countries like China and India. The end-user industry of Building and Construction represents a significant segment, consuming large volumes of limestone for cement, aggregates, and various construction materials. The Construction Lime application segment is a direct beneficiary of this demand.
In the Asia-Pacific region, favorable geological deposits, coupled with supportive government policies aimed at boosting infrastructure and manufacturing, create a conducive environment for limestone extraction and utilization. China, in particular, leads global limestone production, supplying both domestic and international markets. India, with its vast construction projects and growing industrial base, is another key market.
- Dominant Application Segment: Construction Lime and Industry Lime are leading segments due to their widespread use in manufacturing and infrastructure.
- Dominant End-User Industry: Building and Construction and Steel Manufacturing are key consumers, with significant growth potential.
- Key Drivers in Asia-Pacific:
- Massive infrastructure projects (roads, bridges, housing).
- Rapid urbanization and population growth.
- Government initiatives promoting manufacturing and industrial output.
- Growing demand for chemical lime in various manufacturing processes.
- Market Share & Growth Potential: Asia-Pacific is expected to maintain its dominance throughout the forecast period (2025-2033), exhibiting a higher CAGR compared to other regions. Countries like Indonesia and Vietnam are also showing promising growth trajectories within the region.
Limestone Industry Product Landscape
The limestone industry offers a diverse product landscape, with fundamental products like ground limestone and quicklime serving as building blocks for numerous applications. Innovations are centered on enhancing the purity and specific properties of these materials to meet stringent industrial requirements. For instance, advancements in processing allow for the production of high-purity calcium carbonate essential for the pharmaceutical and food industries.
Hydrated lime, a derivative of quicklime, finds extensive use in water treatment and construction. Unique selling propositions often lie in tailored particle sizes, specific chemical compositions, and consistent quality. Technological advancements are enabling the development of functionalized limestone derivatives for specialized applications, such as in flame retardants for plastics and advanced composite materials. The performance metrics of these products, including chemical reactivity, particle size distribution, and whiteness, are critical for their successful application.
Key Drivers, Barriers & Challenges in Limestone Industry
The limestone industry is propelled by several key drivers, including robust demand from the steel manufacturing, construction, and chemical industries. Growing awareness and regulatory pressure for environmental solutions, such as flue gas desulfurization and water treatment, are also significant growth accelerators. Technological advancements in mining and processing equipment enhance efficiency and reduce operational costs, further stimulating the market.
- Key Drivers:
- Global construction boom and infrastructure development.
- Essential ingredient in steel production and chemical manufacturing.
- Increasing use in environmental applications (water treatment, flue gas scrubbing).
- Advancements in processing technology leading to higher-value products.
However, the industry faces notable barriers and challenges. Environmental regulations, particularly concerning quarrying impacts and carbon emissions from calcination, pose significant compliance costs and operational restrictions. Supply chain disruptions, fluctuating energy prices, and the capital-intensive nature of mining operations can impact profitability. Furthermore, the transportation costs of a relatively low-value bulk commodity can limit market reach.
- Key Challenges:
- Strict environmental regulations and permitting complexities.
- Rising energy costs affecting calcination processes.
- Logistical challenges and transportation costs.
- Availability of suitable high-quality limestone deposits in proximity to demand centers.
- Competition from alternative materials in specific niche applications.
Emerging Opportunities in Limestone Industry
Emerging opportunities within the limestone industry lie in the development of specialized, high-value calcium carbonate applications and the increasing demand for lime in emerging environmental technologies. The growing focus on sustainable construction materials presents an avenue for limestone-based products with reduced carbon footprints. Furthermore, the plastics industry is exploring new ways to incorporate limestone fillers for enhanced properties and cost reduction.
- Untapped Markets: Developing economies with nascent infrastructure projects offer significant expansion potential.
- Innovative Applications: Focus on advanced composites, specialized coatings, and biodegradable plastic additives.
- Evolving Consumer Preferences: Demand for sustainable and responsibly sourced building materials.
- Circular Economy Initiatives: Opportunities in using industrial by-products and waste materials in limestone processing.
Growth Accelerators in the Limestone Industry Industry
Several catalysts are accelerating the long-term growth of the limestone industry. Technological breakthroughs in lime production that significantly reduce energy consumption and CO2 emissions are game-changers, making lime more competitive and environmentally friendly. Strategic partnerships between mining companies and end-user industries foster innovation and ensure stable supply chains. Market expansion strategies, particularly targeting developing regions and exploring new applications in sectors like agriculture (soil conditioning) and pharmaceuticals, will further drive growth.
Key Players Shaping the Limestone Industry Market
- CARMEUSE
- Lhoist Group
- Kerford Limestone
- AMR India Limited
- United States Lime & Minerals Inc
- RSMM Limited
- LafargeHolcim
- GLC Minerals LLC
- The National Lime & Stone Company
- Imerys
- Okutama Kogyo Co Ltd
- Ryokolime Industry Co Ltd (Mitsubishi Materials Corporation)
- Schaefer Kalk
- Gujarat Mineral Development Corporation Ltd
- Omya AG
- Minerals Technologies Inc
- Graymont Limited
Notable Milestones in Limestone Industry Sector
- May 2023: Graymont announced the acquisition of GCCP Resources Ltd's Gridland limestone quarry located in Ipoh, Perak, to provide essential lime and limestone solutions to customers in essential industries across Malaysia. Through the acquisition, the company has strengthened its market presence in Malaysia.
- April 2022: Imerys announced new capacity expansion and optimization investments in the Sylacauga (AL) plant in Alabama, United States. Through the expansion, the company strengthened its market presence by supporting the growing demand for ground calcium carbonate products.
In-Depth Limestone Industry Market Outlook
The limestone industry is characterized by a positive outlook, fueled by ongoing global infrastructure development, a robust steel manufacturing sector, and an increasing adoption of lime in environmental remediation. Future market potential is immense, especially in emerging economies. Strategic opportunities for growth lie in the development of value-added limestone derivatives and the exploration of novel applications in advanced materials and sustainable technologies. Companies that prioritize technological innovation, environmental sustainability, and market diversification will be best positioned to capitalize on the sustained demand for lime and limestone products in the coming years.
Limestone Industry Segmentation
-
1. Application
- 1.1. Industry Lime
- 1.2. Chemical Lime
- 1.3. Construction Lime
- 1.4. Refractory Lime
-
2. End-user Industry
- 2.1. Paper and Pulp
- 2.2. Water Treatment
- 2.3. Agriculture
- 2.4. Plastics
- 2.5. Building and Construction
- 2.6. Steel Manufacturing and Other Industries
- 2.7. Other End-user Industries
Limestone Industry Segmentation By Geography
-
1. Asia Pacific
- 1.1. China
- 1.2. India
- 1.3. Japan
- 1.4. South Korea
- 1.5. Malaysia
- 1.6. Thailand
- 1.7. Indonesia
- 1.8. Vietnam
- 1.9. Rest of Asia Pacific
-
2. North America
- 2.1. United States
- 2.2. Canada
- 2.3. Mexico
-
3. Europe
- 3.1. Germany
- 3.2. United Kingdom
- 3.3. France
- 3.4. Italy
- 3.5. Spain
- 3.6. Nordic Countries
- 3.7. Turkey
- 3.8. Russia
- 3.9. Rest of Europe
-
4. South America
- 4.1. Brazil
- 4.2. Argentina
- 4.3. Colombia
-
5. Middle East and Africa
- 5.1. Saudi Arabia
- 5.2. South Africa
- 5.3. Nigeria
- 5.4. Qatar
- 5.5. Egypt
- 5.6. United Arab Emirates
- 5.7. Rest of Middle East and Africa
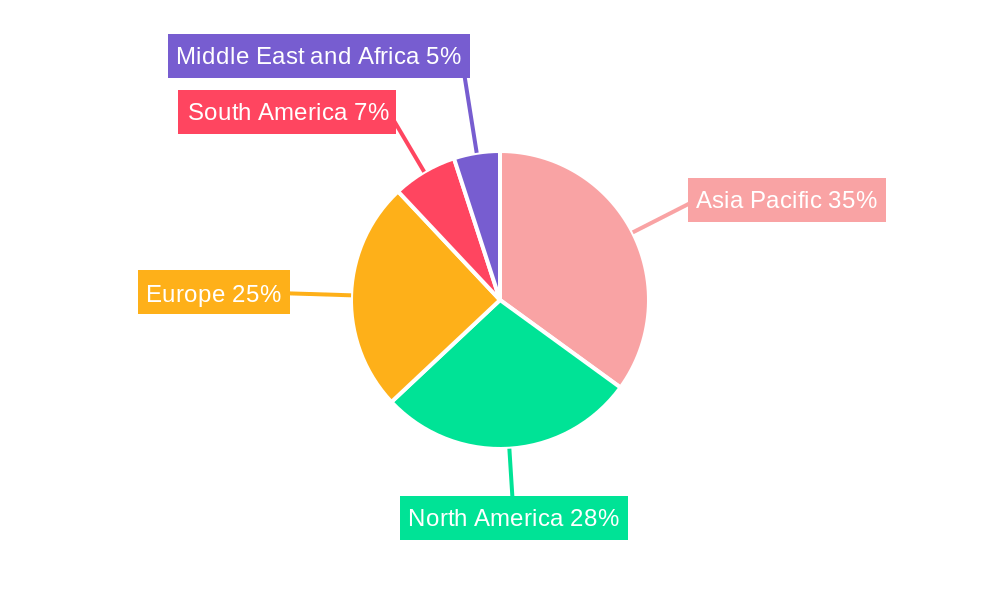
Limestone Industry Regional Market Share
Geographic Coverage of Limestone Industry
Limestone Industry REPORT HIGHLIGHTS
| Aspects | Details |
|---|---|
| Study Period | 2020-2034 |
| Base Year | 2025 |
| Estimated Year | 2026 |
| Forecast Period | 2026-2034 |
| Historical Period | 2020-2025 |
| Growth Rate | CAGR of 4.7% from 2020-2034 |
| Segmentation |
|
Table of Contents
- 1. Introduction
- 1.1. Research Scope
- 1.2. Market Segmentation
- 1.3. Research Objective
- 1.4. Definitions and Assumptions
- 2. Executive Summary
- 2.1. Market Snapshot
- 3. Market Dynamics
- 3.1. Market Drivers
- 3.2. Market Restrains
- 3.3. Market Trends
- 3.4. Market Opportunities
- 4. Market Factor Analysis
- 4.1. Porters Five Forces
- 4.1.1. Bargaining Power of Suppliers
- 4.1.2. Bargaining Power of Buyers
- 4.1.3. Threat of New Entrants
- 4.1.4. Threat of Substitutes
- 4.1.5. Competitive Rivalry
- 4.2. PESTEL analysis
- 4.3. BCG Analysis
- 4.3.1. Stars (High Growth, High Market Share)
- 4.3.2. Cash Cows (Low Growth, High Market Share)
- 4.3.3. Question Mark (High Growth, Low Market Share)
- 4.3.4. Dogs (Low Growth, Low Market Share)
- 4.4. Ansoff Matrix Analysis
- 4.5. Supply Chain Analysis
- 4.6. Regulatory Landscape
- 4.7. Current Market Potential and Opportunity Assessment (TAM–SAM–SOM Framework)
- 4.8. NRP Analyst Note
- 4.1. Porters Five Forces
- 5. Market Analysis, Insights and Forecast 2021-2033
- 5.1. Market Analysis, Insights and Forecast - by Application
- 5.1.1. Industry Lime
- 5.1.2. Chemical Lime
- 5.1.3. Construction Lime
- 5.1.4. Refractory Lime
- 5.2. Market Analysis, Insights and Forecast - by End-user Industry
- 5.2.1. Paper and Pulp
- 5.2.2. Water Treatment
- 5.2.3. Agriculture
- 5.2.4. Plastics
- 5.2.5. Building and Construction
- 5.2.6. Steel Manufacturing and Other Industries
- 5.2.7. Other End-user Industries
- 5.3. Market Analysis, Insights and Forecast - by Region
- 5.3.1. Asia Pacific
- 5.3.2. North America
- 5.3.3. Europe
- 5.3.4. South America
- 5.3.5. Middle East and Africa
- 5.1. Market Analysis, Insights and Forecast - by Application
- 6. Global Limestone Industry Analysis, Insights and Forecast, 2021-2033
- 6.1. Market Analysis, Insights and Forecast - by Application
- 6.1.1. Industry Lime
- 6.1.2. Chemical Lime
- 6.1.3. Construction Lime
- 6.1.4. Refractory Lime
- 6.2. Market Analysis, Insights and Forecast - by End-user Industry
- 6.2.1. Paper and Pulp
- 6.2.2. Water Treatment
- 6.2.3. Agriculture
- 6.2.4. Plastics
- 6.2.5. Building and Construction
- 6.2.6. Steel Manufacturing and Other Industries
- 6.2.7. Other End-user Industries
- 6.1. Market Analysis, Insights and Forecast - by Application
- 7. Asia Pacific Limestone Industry Analysis, Insights and Forecast, 2020-2032
- 7.1. Market Analysis, Insights and Forecast - by Application
- 7.1.1. Industry Lime
- 7.1.2. Chemical Lime
- 7.1.3. Construction Lime
- 7.1.4. Refractory Lime
- 7.2. Market Analysis, Insights and Forecast - by End-user Industry
- 7.2.1. Paper and Pulp
- 7.2.2. Water Treatment
- 7.2.3. Agriculture
- 7.2.4. Plastics
- 7.2.5. Building and Construction
- 7.2.6. Steel Manufacturing and Other Industries
- 7.2.7. Other End-user Industries
- 7.1. Market Analysis, Insights and Forecast - by Application
- 8. North America Limestone Industry Analysis, Insights and Forecast, 2020-2032
- 8.1. Market Analysis, Insights and Forecast - by Application
- 8.1.1. Industry Lime
- 8.1.2. Chemical Lime
- 8.1.3. Construction Lime
- 8.1.4. Refractory Lime
- 8.2. Market Analysis, Insights and Forecast - by End-user Industry
- 8.2.1. Paper and Pulp
- 8.2.2. Water Treatment
- 8.2.3. Agriculture
- 8.2.4. Plastics
- 8.2.5. Building and Construction
- 8.2.6. Steel Manufacturing and Other Industries
- 8.2.7. Other End-user Industries
- 8.1. Market Analysis, Insights and Forecast - by Application
- 9. Europe Limestone Industry Analysis, Insights and Forecast, 2020-2032
- 9.1. Market Analysis, Insights and Forecast - by Application
- 9.1.1. Industry Lime
- 9.1.2. Chemical Lime
- 9.1.3. Construction Lime
- 9.1.4. Refractory Lime
- 9.2. Market Analysis, Insights and Forecast - by End-user Industry
- 9.2.1. Paper and Pulp
- 9.2.2. Water Treatment
- 9.2.3. Agriculture
- 9.2.4. Plastics
- 9.2.5. Building and Construction
- 9.2.6. Steel Manufacturing and Other Industries
- 9.2.7. Other End-user Industries
- 9.1. Market Analysis, Insights and Forecast - by Application
- 10. South America Limestone Industry Analysis, Insights and Forecast, 2020-2032
- 10.1. Market Analysis, Insights and Forecast - by Application
- 10.1.1. Industry Lime
- 10.1.2. Chemical Lime
- 10.1.3. Construction Lime
- 10.1.4. Refractory Lime
- 10.2. Market Analysis, Insights and Forecast - by End-user Industry
- 10.2.1. Paper and Pulp
- 10.2.2. Water Treatment
- 10.2.3. Agriculture
- 10.2.4. Plastics
- 10.2.5. Building and Construction
- 10.2.6. Steel Manufacturing and Other Industries
- 10.2.7. Other End-user Industries
- 10.1. Market Analysis, Insights and Forecast - by Application
- 11. Middle East and Africa Limestone Industry Analysis, Insights and Forecast, 2020-2032
- 11.1. Market Analysis, Insights and Forecast - by Application
- 11.1.1. Industry Lime
- 11.1.2. Chemical Lime
- 11.1.3. Construction Lime
- 11.1.4. Refractory Lime
- 11.2. Market Analysis, Insights and Forecast - by End-user Industry
- 11.2.1. Paper and Pulp
- 11.2.2. Water Treatment
- 11.2.3. Agriculture
- 11.2.4. Plastics
- 11.2.5. Building and Construction
- 11.2.6. Steel Manufacturing and Other Industries
- 11.2.7. Other End-user Industries
- 11.1. Market Analysis, Insights and Forecast - by Application
- 12. Competitive Analysis
- 12.1. Company Profiles
- 12.1.1 CARMEUSE
- 12.1.1.1. Company Overview
- 12.1.1.2. Products
- 12.1.1.3. Company Financials
- 12.1.1.4. SWOT Analysis
- 12.1.2 Lhoist Group
- 12.1.2.1. Company Overview
- 12.1.2.2. Products
- 12.1.2.3. Company Financials
- 12.1.2.4. SWOT Analysis
- 12.1.3 Kerford Limestone
- 12.1.3.1. Company Overview
- 12.1.3.2. Products
- 12.1.3.3. Company Financials
- 12.1.3.4. SWOT Analysis
- 12.1.4 AMR India Limited
- 12.1.4.1. Company Overview
- 12.1.4.2. Products
- 12.1.4.3. Company Financials
- 12.1.4.4. SWOT Analysis
- 12.1.5 United States Lime & Minerals Inc *List Not Exhaustive
- 12.1.5.1. Company Overview
- 12.1.5.2. Products
- 12.1.5.3. Company Financials
- 12.1.5.4. SWOT Analysis
- 12.1.6 RSMM Limited
- 12.1.6.1. Company Overview
- 12.1.6.2. Products
- 12.1.6.3. Company Financials
- 12.1.6.4. SWOT Analysis
- 12.1.7 LafargeHolcim
- 12.1.7.1. Company Overview
- 12.1.7.2. Products
- 12.1.7.3. Company Financials
- 12.1.7.4. SWOT Analysis
- 12.1.8 GLC Minerals LLC
- 12.1.8.1. Company Overview
- 12.1.8.2. Products
- 12.1.8.3. Company Financials
- 12.1.8.4. SWOT Analysis
- 12.1.9 The National Lime & Stone Company
- 12.1.9.1. Company Overview
- 12.1.9.2. Products
- 12.1.9.3. Company Financials
- 12.1.9.4. SWOT Analysis
- 12.1.10 Imerys
- 12.1.10.1. Company Overview
- 12.1.10.2. Products
- 12.1.10.3. Company Financials
- 12.1.10.4. SWOT Analysis
- 12.1.11 Okutama Kogyo Co Ltd
- 12.1.11.1. Company Overview
- 12.1.11.2. Products
- 12.1.11.3. Company Financials
- 12.1.11.4. SWOT Analysis
- 12.1.12 Ryokolime Industry Co Ltd (Mitsubishi Materials Corporation)
- 12.1.12.1. Company Overview
- 12.1.12.2. Products
- 12.1.12.3. Company Financials
- 12.1.12.4. SWOT Analysis
- 12.1.13 Schaefer Kalk
- 12.1.13.1. Company Overview
- 12.1.13.2. Products
- 12.1.13.3. Company Financials
- 12.1.13.4. SWOT Analysis
- 12.1.14 Gujarat Mineral Development Corporation Ltd
- 12.1.14.1. Company Overview
- 12.1.14.2. Products
- 12.1.14.3. Company Financials
- 12.1.14.4. SWOT Analysis
- 12.1.15 Omya AG
- 12.1.15.1. Company Overview
- 12.1.15.2. Products
- 12.1.15.3. Company Financials
- 12.1.15.4. SWOT Analysis
- 12.1.16 Minerals Technologies Inc
- 12.1.16.1. Company Overview
- 12.1.16.2. Products
- 12.1.16.3. Company Financials
- 12.1.16.4. SWOT Analysis
- 12.1.17 Graymont Limited
- 12.1.17.1. Company Overview
- 12.1.17.2. Products
- 12.1.17.3. Company Financials
- 12.1.17.4. SWOT Analysis
- 12.1.1 CARMEUSE
- 12.2. Market Entropy
- 12.2.1 Company's Key Areas Served
- 12.2.2 Recent Developments
- 12.3. Company Market Share Analysis 2025
- 12.3.1 Top 5 Companies Market Share Analysis
- 12.3.2 Top 3 Companies Market Share Analysis
- 12.4. List of Potential Customers
- 13. Research Methodology
List of Figures
- Figure 1: Global Limestone Industry Revenue Breakdown (billion, %) by Region 2025 & 2033
- Figure 2: Global Limestone Industry Volume Breakdown (Billion, %) by Region 2025 & 2033
- Figure 3: Asia Pacific Limestone Industry Revenue (billion), by Application 2025 & 2033
- Figure 4: Asia Pacific Limestone Industry Volume (Billion), by Application 2025 & 2033
- Figure 5: Asia Pacific Limestone Industry Revenue Share (%), by Application 2025 & 2033
- Figure 6: Asia Pacific Limestone Industry Volume Share (%), by Application 2025 & 2033
- Figure 7: Asia Pacific Limestone Industry Revenue (billion), by End-user Industry 2025 & 2033
- Figure 8: Asia Pacific Limestone Industry Volume (Billion), by End-user Industry 2025 & 2033
- Figure 9: Asia Pacific Limestone Industry Revenue Share (%), by End-user Industry 2025 & 2033
- Figure 10: Asia Pacific Limestone Industry Volume Share (%), by End-user Industry 2025 & 2033
- Figure 11: Asia Pacific Limestone Industry Revenue (billion), by Country 2025 & 2033
- Figure 12: Asia Pacific Limestone Industry Volume (Billion), by Country 2025 & 2033
- Figure 13: Asia Pacific Limestone Industry Revenue Share (%), by Country 2025 & 2033
- Figure 14: Asia Pacific Limestone Industry Volume Share (%), by Country 2025 & 2033
- Figure 15: North America Limestone Industry Revenue (billion), by Application 2025 & 2033
- Figure 16: North America Limestone Industry Volume (Billion), by Application 2025 & 2033
- Figure 17: North America Limestone Industry Revenue Share (%), by Application 2025 & 2033
- Figure 18: North America Limestone Industry Volume Share (%), by Application 2025 & 2033
- Figure 19: North America Limestone Industry Revenue (billion), by End-user Industry 2025 & 2033
- Figure 20: North America Limestone Industry Volume (Billion), by End-user Industry 2025 & 2033
- Figure 21: North America Limestone Industry Revenue Share (%), by End-user Industry 2025 & 2033
- Figure 22: North America Limestone Industry Volume Share (%), by End-user Industry 2025 & 2033
- Figure 23: North America Limestone Industry Revenue (billion), by Country 2025 & 2033
- Figure 24: North America Limestone Industry Volume (Billion), by Country 2025 & 2033
- Figure 25: North America Limestone Industry Revenue Share (%), by Country 2025 & 2033
- Figure 26: North America Limestone Industry Volume Share (%), by Country 2025 & 2033
- Figure 27: Europe Limestone Industry Revenue (billion), by Application 2025 & 2033
- Figure 28: Europe Limestone Industry Volume (Billion), by Application 2025 & 2033
- Figure 29: Europe Limestone Industry Revenue Share (%), by Application 2025 & 2033
- Figure 30: Europe Limestone Industry Volume Share (%), by Application 2025 & 2033
- Figure 31: Europe Limestone Industry Revenue (billion), by End-user Industry 2025 & 2033
- Figure 32: Europe Limestone Industry Volume (Billion), by End-user Industry 2025 & 2033
- Figure 33: Europe Limestone Industry Revenue Share (%), by End-user Industry 2025 & 2033
- Figure 34: Europe Limestone Industry Volume Share (%), by End-user Industry 2025 & 2033
- Figure 35: Europe Limestone Industry Revenue (billion), by Country 2025 & 2033
- Figure 36: Europe Limestone Industry Volume (Billion), by Country 2025 & 2033
- Figure 37: Europe Limestone Industry Revenue Share (%), by Country 2025 & 2033
- Figure 38: Europe Limestone Industry Volume Share (%), by Country 2025 & 2033
- Figure 39: South America Limestone Industry Revenue (billion), by Application 2025 & 2033
- Figure 40: South America Limestone Industry Volume (Billion), by Application 2025 & 2033
- Figure 41: South America Limestone Industry Revenue Share (%), by Application 2025 & 2033
- Figure 42: South America Limestone Industry Volume Share (%), by Application 2025 & 2033
- Figure 43: South America Limestone Industry Revenue (billion), by End-user Industry 2025 & 2033
- Figure 44: South America Limestone Industry Volume (Billion), by End-user Industry 2025 & 2033
- Figure 45: South America Limestone Industry Revenue Share (%), by End-user Industry 2025 & 2033
- Figure 46: South America Limestone Industry Volume Share (%), by End-user Industry 2025 & 2033
- Figure 47: South America Limestone Industry Revenue (billion), by Country 2025 & 2033
- Figure 48: South America Limestone Industry Volume (Billion), by Country 2025 & 2033
- Figure 49: South America Limestone Industry Revenue Share (%), by Country 2025 & 2033
- Figure 50: South America Limestone Industry Volume Share (%), by Country 2025 & 2033
- Figure 51: Middle East and Africa Limestone Industry Revenue (billion), by Application 2025 & 2033
- Figure 52: Middle East and Africa Limestone Industry Volume (Billion), by Application 2025 & 2033
- Figure 53: Middle East and Africa Limestone Industry Revenue Share (%), by Application 2025 & 2033
- Figure 54: Middle East and Africa Limestone Industry Volume Share (%), by Application 2025 & 2033
- Figure 55: Middle East and Africa Limestone Industry Revenue (billion), by End-user Industry 2025 & 2033
- Figure 56: Middle East and Africa Limestone Industry Volume (Billion), by End-user Industry 2025 & 2033
- Figure 57: Middle East and Africa Limestone Industry Revenue Share (%), by End-user Industry 2025 & 2033
- Figure 58: Middle East and Africa Limestone Industry Volume Share (%), by End-user Industry 2025 & 2033
- Figure 59: Middle East and Africa Limestone Industry Revenue (billion), by Country 2025 & 2033
- Figure 60: Middle East and Africa Limestone Industry Volume (Billion), by Country 2025 & 2033
- Figure 61: Middle East and Africa Limestone Industry Revenue Share (%), by Country 2025 & 2033
- Figure 62: Middle East and Africa Limestone Industry Volume Share (%), by Country 2025 & 2033
List of Tables
- Table 1: Global Limestone Industry Revenue billion Forecast, by Application 2020 & 2033
- Table 2: Global Limestone Industry Volume Billion Forecast, by Application 2020 & 2033
- Table 3: Global Limestone Industry Revenue billion Forecast, by End-user Industry 2020 & 2033
- Table 4: Global Limestone Industry Volume Billion Forecast, by End-user Industry 2020 & 2033
- Table 5: Global Limestone Industry Revenue billion Forecast, by Region 2020 & 2033
- Table 6: Global Limestone Industry Volume Billion Forecast, by Region 2020 & 2033
- Table 7: Global Limestone Industry Revenue billion Forecast, by Application 2020 & 2033
- Table 8: Global Limestone Industry Volume Billion Forecast, by Application 2020 & 2033
- Table 9: Global Limestone Industry Revenue billion Forecast, by End-user Industry 2020 & 2033
- Table 10: Global Limestone Industry Volume Billion Forecast, by End-user Industry 2020 & 2033
- Table 11: Global Limestone Industry Revenue billion Forecast, by Country 2020 & 2033
- Table 12: Global Limestone Industry Volume Billion Forecast, by Country 2020 & 2033
- Table 13: China Limestone Industry Revenue (billion) Forecast, by Application 2020 & 2033
- Table 14: China Limestone Industry Volume (Billion) Forecast, by Application 2020 & 2033
- Table 15: India Limestone Industry Revenue (billion) Forecast, by Application 2020 & 2033
- Table 16: India Limestone Industry Volume (Billion) Forecast, by Application 2020 & 2033
- Table 17: Japan Limestone Industry Revenue (billion) Forecast, by Application 2020 & 2033
- Table 18: Japan Limestone Industry Volume (Billion) Forecast, by Application 2020 & 2033
- Table 19: South Korea Limestone Industry Revenue (billion) Forecast, by Application 2020 & 2033
- Table 20: South Korea Limestone Industry Volume (Billion) Forecast, by Application 2020 & 2033
- Table 21: Malaysia Limestone Industry Revenue (billion) Forecast, by Application 2020 & 2033
- Table 22: Malaysia Limestone Industry Volume (Billion) Forecast, by Application 2020 & 2033
- Table 23: Thailand Limestone Industry Revenue (billion) Forecast, by Application 2020 & 2033
- Table 24: Thailand Limestone Industry Volume (Billion) Forecast, by Application 2020 & 2033
- Table 25: Indonesia Limestone Industry Revenue (billion) Forecast, by Application 2020 & 2033
- Table 26: Indonesia Limestone Industry Volume (Billion) Forecast, by Application 2020 & 2033
- Table 27: Vietnam Limestone Industry Revenue (billion) Forecast, by Application 2020 & 2033
- Table 28: Vietnam Limestone Industry Volume (Billion) Forecast, by Application 2020 & 2033
- Table 29: Rest of Asia Pacific Limestone Industry Revenue (billion) Forecast, by Application 2020 & 2033
- Table 30: Rest of Asia Pacific Limestone Industry Volume (Billion) Forecast, by Application 2020 & 2033
- Table 31: Global Limestone Industry Revenue billion Forecast, by Application 2020 & 2033
- Table 32: Global Limestone Industry Volume Billion Forecast, by Application 2020 & 2033
- Table 33: Global Limestone Industry Revenue billion Forecast, by End-user Industry 2020 & 2033
- Table 34: Global Limestone Industry Volume Billion Forecast, by End-user Industry 2020 & 2033
- Table 35: Global Limestone Industry Revenue billion Forecast, by Country 2020 & 2033
- Table 36: Global Limestone Industry Volume Billion Forecast, by Country 2020 & 2033
- Table 37: United States Limestone Industry Revenue (billion) Forecast, by Application 2020 & 2033
- Table 38: United States Limestone Industry Volume (Billion) Forecast, by Application 2020 & 2033
- Table 39: Canada Limestone Industry Revenue (billion) Forecast, by Application 2020 & 2033
- Table 40: Canada Limestone Industry Volume (Billion) Forecast, by Application 2020 & 2033
- Table 41: Mexico Limestone Industry Revenue (billion) Forecast, by Application 2020 & 2033
- Table 42: Mexico Limestone Industry Volume (Billion) Forecast, by Application 2020 & 2033
- Table 43: Global Limestone Industry Revenue billion Forecast, by Application 2020 & 2033
- Table 44: Global Limestone Industry Volume Billion Forecast, by Application 2020 & 2033
- Table 45: Global Limestone Industry Revenue billion Forecast, by End-user Industry 2020 & 2033
- Table 46: Global Limestone Industry Volume Billion Forecast, by End-user Industry 2020 & 2033
- Table 47: Global Limestone Industry Revenue billion Forecast, by Country 2020 & 2033
- Table 48: Global Limestone Industry Volume Billion Forecast, by Country 2020 & 2033
- Table 49: Germany Limestone Industry Revenue (billion) Forecast, by Application 2020 & 2033
- Table 50: Germany Limestone Industry Volume (Billion) Forecast, by Application 2020 & 2033
- Table 51: United Kingdom Limestone Industry Revenue (billion) Forecast, by Application 2020 & 2033
- Table 52: United Kingdom Limestone Industry Volume (Billion) Forecast, by Application 2020 & 2033
- Table 53: France Limestone Industry Revenue (billion) Forecast, by Application 2020 & 2033
- Table 54: France Limestone Industry Volume (Billion) Forecast, by Application 2020 & 2033
- Table 55: Italy Limestone Industry Revenue (billion) Forecast, by Application 2020 & 2033
- Table 56: Italy Limestone Industry Volume (Billion) Forecast, by Application 2020 & 2033
- Table 57: Spain Limestone Industry Revenue (billion) Forecast, by Application 2020 & 2033
- Table 58: Spain Limestone Industry Volume (Billion) Forecast, by Application 2020 & 2033
- Table 59: Nordic Countries Limestone Industry Revenue (billion) Forecast, by Application 2020 & 2033
- Table 60: Nordic Countries Limestone Industry Volume (Billion) Forecast, by Application 2020 & 2033
- Table 61: Turkey Limestone Industry Revenue (billion) Forecast, by Application 2020 & 2033
- Table 62: Turkey Limestone Industry Volume (Billion) Forecast, by Application 2020 & 2033
- Table 63: Russia Limestone Industry Revenue (billion) Forecast, by Application 2020 & 2033
- Table 64: Russia Limestone Industry Volume (Billion) Forecast, by Application 2020 & 2033
- Table 65: Rest of Europe Limestone Industry Revenue (billion) Forecast, by Application 2020 & 2033
- Table 66: Rest of Europe Limestone Industry Volume (Billion) Forecast, by Application 2020 & 2033
- Table 67: Global Limestone Industry Revenue billion Forecast, by Application 2020 & 2033
- Table 68: Global Limestone Industry Volume Billion Forecast, by Application 2020 & 2033
- Table 69: Global Limestone Industry Revenue billion Forecast, by End-user Industry 2020 & 2033
- Table 70: Global Limestone Industry Volume Billion Forecast, by End-user Industry 2020 & 2033
- Table 71: Global Limestone Industry Revenue billion Forecast, by Country 2020 & 2033
- Table 72: Global Limestone Industry Volume Billion Forecast, by Country 2020 & 2033
- Table 73: Brazil Limestone Industry Revenue (billion) Forecast, by Application 2020 & 2033
- Table 74: Brazil Limestone Industry Volume (Billion) Forecast, by Application 2020 & 2033
- Table 75: Argentina Limestone Industry Revenue (billion) Forecast, by Application 2020 & 2033
- Table 76: Argentina Limestone Industry Volume (Billion) Forecast, by Application 2020 & 2033
- Table 77: Colombia Limestone Industry Revenue (billion) Forecast, by Application 2020 & 2033
- Table 78: Colombia Limestone Industry Volume (Billion) Forecast, by Application 2020 & 2033
- Table 79: Global Limestone Industry Revenue billion Forecast, by Application 2020 & 2033
- Table 80: Global Limestone Industry Volume Billion Forecast, by Application 2020 & 2033
- Table 81: Global Limestone Industry Revenue billion Forecast, by End-user Industry 2020 & 2033
- Table 82: Global Limestone Industry Volume Billion Forecast, by End-user Industry 2020 & 2033
- Table 83: Global Limestone Industry Revenue billion Forecast, by Country 2020 & 2033
- Table 84: Global Limestone Industry Volume Billion Forecast, by Country 2020 & 2033
- Table 85: Saudi Arabia Limestone Industry Revenue (billion) Forecast, by Application 2020 & 2033
- Table 86: Saudi Arabia Limestone Industry Volume (Billion) Forecast, by Application 2020 & 2033
- Table 87: South Africa Limestone Industry Revenue (billion) Forecast, by Application 2020 & 2033
- Table 88: South Africa Limestone Industry Volume (Billion) Forecast, by Application 2020 & 2033
- Table 89: Nigeria Limestone Industry Revenue (billion) Forecast, by Application 2020 & 2033
- Table 90: Nigeria Limestone Industry Volume (Billion) Forecast, by Application 2020 & 2033
- Table 91: Qatar Limestone Industry Revenue (billion) Forecast, by Application 2020 & 2033
- Table 92: Qatar Limestone Industry Volume (Billion) Forecast, by Application 2020 & 2033
- Table 93: Egypt Limestone Industry Revenue (billion) Forecast, by Application 2020 & 2033
- Table 94: Egypt Limestone Industry Volume (Billion) Forecast, by Application 2020 & 2033
- Table 95: United Arab Emirates Limestone Industry Revenue (billion) Forecast, by Application 2020 & 2033
- Table 96: United Arab Emirates Limestone Industry Volume (Billion) Forecast, by Application 2020 & 2033
- Table 97: Rest of Middle East and Africa Limestone Industry Revenue (billion) Forecast, by Application 2020 & 2033
- Table 98: Rest of Middle East and Africa Limestone Industry Volume (Billion) Forecast, by Application 2020 & 2033
Frequently Asked Questions
1. What is the projected Compound Annual Growth Rate (CAGR) of the Limestone Industry?
The projected CAGR is approximately 4.7%.
2. Which companies are prominent players in the Limestone Industry?
Key companies in the market include CARMEUSE, Lhoist Group, Kerford Limestone, AMR India Limited, United States Lime & Minerals Inc *List Not Exhaustive, RSMM Limited, LafargeHolcim, GLC Minerals LLC, The National Lime & Stone Company, Imerys, Okutama Kogyo Co Ltd, Ryokolime Industry Co Ltd (Mitsubishi Materials Corporation), Schaefer Kalk, Gujarat Mineral Development Corporation Ltd, Omya AG, Minerals Technologies Inc, Graymont Limited.
3. What are the main segments of the Limestone Industry?
The market segments include Application, End-user Industry.
4. Can you provide details about the market size?
The market size is estimated to be USD 6.47 billion as of 2022.
5. What are some drivers contributing to market growth?
Increasing Demand from the Construction Industry; Increasing Steel Production Globally; Other Drivers.
6. What are the notable trends driving market growth?
Increasing Usage in Steel Manufacturing and Other Industries Driving Market Growth.
7. Are there any restraints impacting market growth?
Natural Gas Liquid Demand in the United States.
8. Can you provide examples of recent developments in the market?
May 2023: Graymont announced the acquisition of GCCP Resources Ltd's Gridland limestone quarry located in Ipoh, Perak, to provide essential lime and limestone solutions to customers in essential industries across Malaysia. Through the acquisition, the company has strengthened its market presence in Malaysia.
9. What pricing options are available for accessing the report?
Pricing options include single-user, multi-user, and enterprise licenses priced at USD 4750, USD 5250, and USD 8750 respectively.
10. Is the market size provided in terms of value or volume?
The market size is provided in terms of value, measured in billion and volume, measured in Billion.
11. Are there any specific market keywords associated with the report?
Yes, the market keyword associated with the report is "Limestone Industry," which aids in identifying and referencing the specific market segment covered.
12. How do I determine which pricing option suits my needs best?
The pricing options vary based on user requirements and access needs. Individual users may opt for single-user licenses, while businesses requiring broader access may choose multi-user or enterprise licenses for cost-effective access to the report.
13. Are there any additional resources or data provided in the Limestone Industry report?
While the report offers comprehensive insights, it's advisable to review the specific contents or supplementary materials provided to ascertain if additional resources or data are available.
14. How can I stay updated on further developments or reports in the Limestone Industry?
To stay informed about further developments, trends, and reports in the Limestone Industry, consider subscribing to industry newsletters, following relevant companies and organizations, or regularly checking reputable industry news sources and publications.
Methodology
Step 1 - Identification of Relevant Samples Size from Population Database


Step 2 - Approaches for Defining Global Market Size (Value, Volume* & Price*)

Note*: In applicable scenarios
Step 3 - Data Sources
Primary Research
- Web Analytics
- Survey Reports
- Research Institute
- Latest Research Reports
- Opinion Leaders
Secondary Research
- Annual Reports
- White Paper
- Latest Press Release
- Industry Association
- Paid Database
- Investor Presentations

Step 4 - Data Triangulation
Involves using different sources of information in order to increase the validity of a study
These sources are likely to be stakeholders in a program - participants, other researchers, program staff, other community members, and so on.
Then we put all data in single framework & apply various statistical tools to find out the dynamic on the market.
During the analysis stage, feedback from the stakeholder groups would be compared to determine areas of agreement as well as areas of divergence