

Key Insights
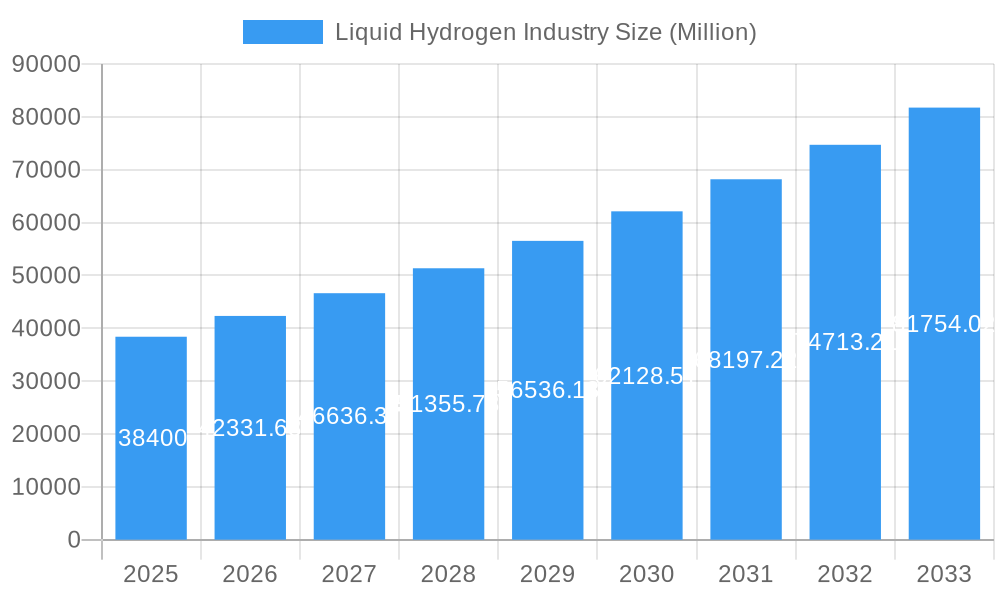
The liquid hydrogen market, valued at $38.4 billion in 2025, is projected to experience robust growth, driven primarily by the burgeoning demand from the transportation and energy sectors. A compound annual growth rate (CAGR) of 10.27% from 2025 to 2033 indicates a significant expansion of this market. Key drivers include the increasing adoption of fuel cell electric vehicles (FCEVs) in the automotive and aerospace industries, the growing need for clean energy solutions to mitigate climate change, and government initiatives promoting hydrogen as a sustainable fuel source. The automotive sector is currently the largest end-user industry, with aerospace (including space exploration) quickly gaining traction due to the advantages of hydrogen in rocket propulsion. The distribution segment is characterized by the use of cryogenic tanks and high-pressure tube trailers, both of which are expected to witness significant advancements in efficiency and safety in the coming years. While challenges remain, such as the high cost of production and storage, and the lack of widespread infrastructure for hydrogen distribution, ongoing technological advancements and supportive government policies are paving the way for wider adoption of liquid hydrogen. This growth is expected to be geographically diverse, with North America, Europe, and Asia-Pacific leading the market, driven by strong government support and substantial investments in hydrogen infrastructure.
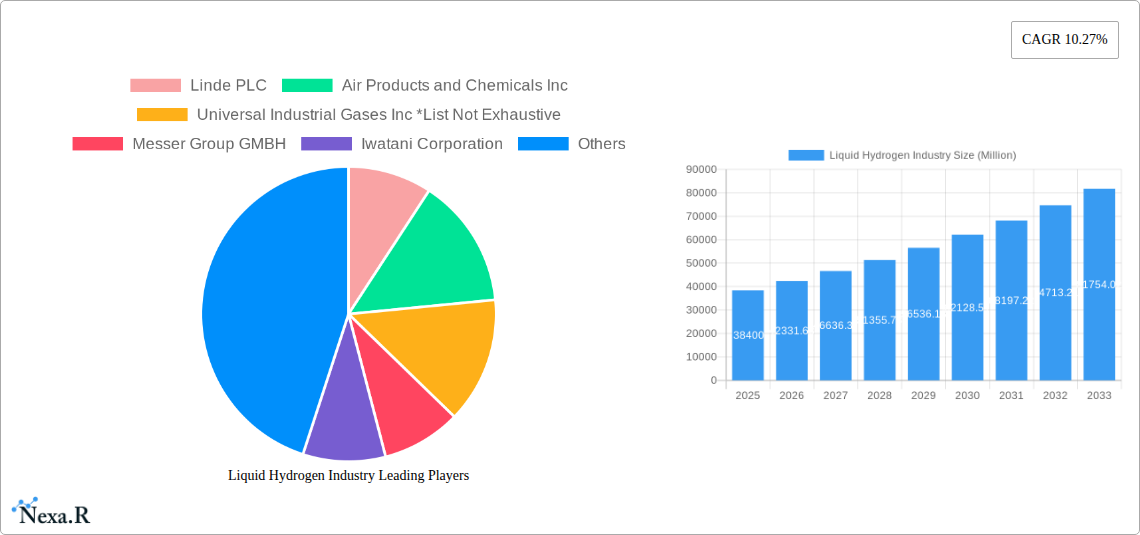
Liquid Hydrogen Industry Market Size (In Billion)
The market segmentation reveals significant opportunities across various sectors. Automotive remains dominant, bolstered by the increasing development of FCEVs. However, aerospace is a rapidly growing segment, primarily fueled by the increasing demand for hydrogen in space launches and aircraft propulsion systems. The marine industry is also emerging as a significant consumer of liquid hydrogen, as it seeks cleaner alternatives for powering vessels. The consistent growth trajectory and the involvement of major players such as Linde PLC, Air Products and Chemicals Inc., and Air Liquide, demonstrate the market's maturity and potential. The ongoing research and development efforts focused on improving hydrogen production efficiency and storage technologies, coupled with the expanding regulatory support, are anticipated to propel substantial market growth in the forecast period.
Liquid Hydrogen Industry Company Market Share
Liquid Hydrogen Industry Market Report: 2019-2033
This comprehensive report provides an in-depth analysis of the liquid hydrogen industry, encompassing market dynamics, growth trends, key players, and future prospects. The study period covers 2019-2033, with 2025 as the base and estimated year. This report is invaluable for industry professionals, investors, and strategic decision-makers seeking to understand and capitalize on opportunities within this rapidly evolving sector. The parent market is the broader hydrogen energy sector, while child markets include automotive, aerospace, and marine applications.
Liquid Hydrogen Industry Market Dynamics & Structure
The liquid hydrogen market is characterized by moderate concentration, with key players like Linde PLC, Air Products and Chemicals Inc., and Air Liquide holding significant market share. However, the landscape is dynamic, with ongoing M&A activity and the emergence of new players. Technological innovation, particularly in production and storage, is a crucial driver. Stringent environmental regulations are pushing adoption, while the availability of cost-competitive substitutes (like batteries) poses a challenge. End-user demographics are shifting towards sectors prioritizing decarbonization, such as automotive and aerospace.
- Market Concentration: Highly concentrated with top 5 players holding xx% market share (2024).
- Technological Innovation: PEM electrolysis, cryogenic storage advancements driving efficiency gains.
- Regulatory Framework: Stringent emission regulations incentivize liquid hydrogen adoption, varying by region.
- Competitive Substitutes: Batteries, fuel cells represent competing technologies in specific applications.
- End-User Demographics: Automotive, aerospace, and marine sectors are key drivers, with growing interest from other industries.
- M&A Trends: Consolidation expected, with larger players acquiring smaller companies to expand production capacity and geographic reach. xx M&A deals recorded between 2019 and 2024.
Liquid Hydrogen Industry Growth Trends & Insights
The liquid hydrogen market is experiencing robust growth, driven by increasing demand from various sectors. The market size is projected to reach xx million units by 2033, exhibiting a CAGR of xx% during the forecast period (2025-2033). This growth is fueled by technological advancements reducing production costs, supportive government policies, and growing awareness of environmental concerns. Technological disruptions, such as advancements in electrolysis and cryogenic storage, are significantly impacting adoption rates. Consumer behavior is shifting towards cleaner energy solutions, boosting demand for liquid hydrogen. Market penetration is projected to increase from xx% in 2025 to xx% in 2033.
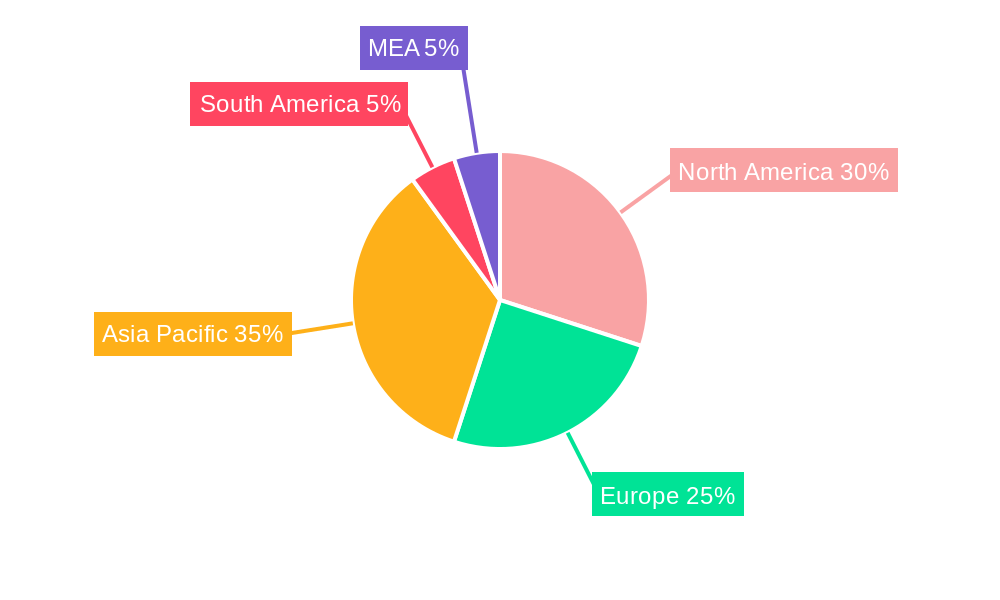
Dominant Regions, Countries, or Segments in Liquid Hydrogen Industry
North America and Europe currently dominate the liquid hydrogen market, driven by supportive government policies and substantial investments in infrastructure. Within end-user segments, the automotive and aerospace sectors demonstrate the highest growth potential, particularly in the production of green liquid hydrogen. Cryogenic tank distribution is currently the dominant method, although high-pressure tube trailers are gaining traction.
- Key Drivers (North America): Strong government incentives, robust R&D investments, and the development of large-scale production facilities.
- Key Drivers (Europe): EU Green Deal policies, substantial investments in renewable energy infrastructure, and a strong focus on decarbonization.
- Automotive Segment: High growth potential fueled by the rising adoption of hydrogen fuel cell vehicles.
- Aerospace Segment: Demand is driven by the need for clean aviation fuels and the exploration of space travel.
- Marine Segment: Emerging market with growing interest in hydrogen-powered ships.
- Cryogenic Tanks: Currently dominate due to established infrastructure and established efficiency.
- High-Pressure Tube Trailers: Growing adoption for long-distance transport.
Liquid Hydrogen Industry Product Landscape
Liquid hydrogen is primarily distributed via cryogenic tanks and high-pressure tube trailers. Product innovation centers on improving storage efficiency, reducing transportation costs, and enhancing safety. Advancements in materials science are enabling the development of lighter and more efficient storage tanks. Unique selling propositions include reduced carbon emissions and increased energy density compared to other fuels.
Key Drivers, Barriers & Challenges in Liquid Hydrogen Industry
Key Drivers:
- Increasing environmental concerns and stringent emission regulations.
- Growing demand from the automotive, aerospace, and marine sectors.
- Government support through subsidies, tax credits, and research funding.
- Technological advancements leading to cost reductions.
Challenges:
- High production costs compared to traditional fossil fuels.
- Complex and expensive infrastructure requirements for storage and transportation.
- Safety concerns associated with handling and transportation of liquid hydrogen.
- Competition from alternative energy technologies (batteries, biofuels). These factors are estimated to reduce market growth by xx% annually.
Emerging Opportunities in Liquid Hydrogen Industry
- Untapped markets in developing economies with growing energy demands.
- Innovative applications in industrial processes and energy storage.
- Growing consumer preference for sustainable and environmentally friendly energy sources.
- Development of hydrogen refueling infrastructure supporting widespread adoption.
Growth Accelerators in the Liquid Hydrogen Industry
Technological breakthroughs in hydrogen production, storage, and transportation are key catalysts. Strategic partnerships between energy companies, automotive manufacturers, and technology providers are accelerating market growth. Expansion into new geographic markets and diversification of applications are driving long-term expansion.
Key Players Shaping the Liquid Hydrogen Industry Market
- Linde PLC
- Air Products and Chemicals Inc.
- Universal Industrial Gases Inc.
- Messer Group GMBH
- Iwatani Corporation
- Air Liquide
- Nippon Sanso Holdings Corporation
- Praxair Technology Inc.
- ITM Power
Notable Milestones in Liquid Hydrogen Industry Sector
- March 2023: Iwatani Corporation and ENEOS Corporation launch a project to develop marine transportation technologies for liquefied hydrogen, aiming for a 30 JPY/Nm3 supply cost by 2030.
- September 2022: Linde announces the construction of a 35-megawatt PEM electrolyzer in Niagara Falls, expanding its green liquid hydrogen production capacity in the US.
- May 2022: Air Liquide invests USD 250 million in a large-scale liquid hydrogen production complex in Nevada, targeting the hydrogen mobility market.
In-Depth Liquid Hydrogen Industry Market Outlook
The liquid hydrogen market presents significant long-term growth potential, driven by ongoing technological advancements, supportive government policies, and increasing environmental awareness. Strategic opportunities exist in developing efficient and cost-effective production methods, expanding infrastructure, and penetrating new market segments. Continued innovation and collaboration across the value chain are crucial for realizing this potential.
Liquid Hydrogen Industry Segmentation
-
1. Distribution
- 1.1. Cryogenic Tank
- 1.2. High-Pressure Tube Trailers
-
2. End-user Industry
- 2.1. Automotive
- 2.2. Aerospace (including Outer Space)
- 2.3. Marine
- 2.4. Other End-User Industries
Liquid Hydrogen Industry Segmentation By Geography
-
1. Asia Pacific
- 1.1. China
- 1.2. India
- 1.3. Japan
- 1.4. South Korea
- 1.5. Rest of Asia Pacific
-
2. North America
- 2.1. United States
- 2.2. Canada
- 2.3. Mexico
-
3. Europe
- 3.1. Germany
- 3.2. United Kingdom
- 3.3. Italy
- 3.4. France
- 3.5. Rest of Europe
-
4. Rest of the World
- 4.1. South America
- 4.2. Middle East and Africa
Liquid Hydrogen Industry Regional Market Share
Geographic Coverage of Liquid Hydrogen Industry
Liquid Hydrogen Industry REPORT HIGHLIGHTS
| Aspects | Details |
|---|---|
| Study Period | 2020-2034 |
| Base Year | 2025 |
| Estimated Year | 2026 |
| Forecast Period | 2026-2034 |
| Historical Period | 2020-2025 |
| Growth Rate | CAGR of 10.27% from 2020-2034 |
| Segmentation |
|
Table of Contents
- 1. Introduction
- 1.1. Research Scope
- 1.2. Market Segmentation
- 1.3. Research Objective
- 1.4. Definitions and Assumptions
- 2. Executive Summary
- 2.1. Market Snapshot
- 3. Market Dynamics
- 3.1. Market Drivers
- 3.2. Market Restrains
- 3.3. Market Trends
- 3.4. Market Opportunities
- 4. Market Factor Analysis
- 4.1. Porters Five Forces
- 4.1.1. Bargaining Power of Suppliers
- 4.1.2. Bargaining Power of Buyers
- 4.1.3. Threat of New Entrants
- 4.1.4. Threat of Substitutes
- 4.1.5. Competitive Rivalry
- 4.2. PESTEL analysis
- 4.3. BCG Analysis
- 4.3.1. Stars (High Growth, High Market Share)
- 4.3.2. Cash Cows (Low Growth, High Market Share)
- 4.3.3. Question Mark (High Growth, Low Market Share)
- 4.3.4. Dogs (Low Growth, Low Market Share)
- 4.4. Ansoff Matrix Analysis
- 4.5. Supply Chain Analysis
- 4.6. Regulatory Landscape
- 4.7. Current Market Potential and Opportunity Assessment (TAM–SAM–SOM Framework)
- 4.8. NRP Analyst Note
- 4.1. Porters Five Forces
- 5. Market Analysis, Insights and Forecast 2021-2033
- 5.1. Market Analysis, Insights and Forecast - by Distribution
- 5.1.1. Cryogenic Tank
- 5.1.2. High-Pressure Tube Trailers
- 5.2. Market Analysis, Insights and Forecast - by End-user Industry
- 5.2.1. Automotive
- 5.2.2. Aerospace (including Outer Space)
- 5.2.3. Marine
- 5.2.4. Other End-User Industries
- 5.3. Market Analysis, Insights and Forecast - by Region
- 5.3.1. Asia Pacific
- 5.3.2. North America
- 5.3.3. Europe
- 5.3.4. Rest of the World
- 5.1. Market Analysis, Insights and Forecast - by Distribution
- 6. Global Liquid Hydrogen Industry Analysis, Insights and Forecast, 2021-2033
- 6.1. Market Analysis, Insights and Forecast - by Distribution
- 6.1.1. Cryogenic Tank
- 6.1.2. High-Pressure Tube Trailers
- 6.2. Market Analysis, Insights and Forecast - by End-user Industry
- 6.2.1. Automotive
- 6.2.2. Aerospace (including Outer Space)
- 6.2.3. Marine
- 6.2.4. Other End-User Industries
- 6.1. Market Analysis, Insights and Forecast - by Distribution
- 7. Asia Pacific Liquid Hydrogen Industry Analysis, Insights and Forecast, 2020-2032
- 7.1. Market Analysis, Insights and Forecast - by Distribution
- 7.1.1. Cryogenic Tank
- 7.1.2. High-Pressure Tube Trailers
- 7.2. Market Analysis, Insights and Forecast - by End-user Industry
- 7.2.1. Automotive
- 7.2.2. Aerospace (including Outer Space)
- 7.2.3. Marine
- 7.2.4. Other End-User Industries
- 7.1. Market Analysis, Insights and Forecast - by Distribution
- 8. North America Liquid Hydrogen Industry Analysis, Insights and Forecast, 2020-2032
- 8.1. Market Analysis, Insights and Forecast - by Distribution
- 8.1.1. Cryogenic Tank
- 8.1.2. High-Pressure Tube Trailers
- 8.2. Market Analysis, Insights and Forecast - by End-user Industry
- 8.2.1. Automotive
- 8.2.2. Aerospace (including Outer Space)
- 8.2.3. Marine
- 8.2.4. Other End-User Industries
- 8.1. Market Analysis, Insights and Forecast - by Distribution
- 9. Europe Liquid Hydrogen Industry Analysis, Insights and Forecast, 2020-2032
- 9.1. Market Analysis, Insights and Forecast - by Distribution
- 9.1.1. Cryogenic Tank
- 9.1.2. High-Pressure Tube Trailers
- 9.2. Market Analysis, Insights and Forecast - by End-user Industry
- 9.2.1. Automotive
- 9.2.2. Aerospace (including Outer Space)
- 9.2.3. Marine
- 9.2.4. Other End-User Industries
- 9.1. Market Analysis, Insights and Forecast - by Distribution
- 10. Rest of the World Liquid Hydrogen Industry Analysis, Insights and Forecast, 2020-2032
- 10.1. Market Analysis, Insights and Forecast - by Distribution
- 10.1.1. Cryogenic Tank
- 10.1.2. High-Pressure Tube Trailers
- 10.2. Market Analysis, Insights and Forecast - by End-user Industry
- 10.2.1. Automotive
- 10.2.2. Aerospace (including Outer Space)
- 10.2.3. Marine
- 10.2.4. Other End-User Industries
- 10.1. Market Analysis, Insights and Forecast - by Distribution
- 11. Competitive Analysis
- 11.1. Company Profiles
- 11.1.1 Linde PLC
- 11.1.1.1. Company Overview
- 11.1.1.2. Products
- 11.1.1.3. Company Financials
- 11.1.1.4. SWOT Analysis
- 11.1.2 Air Products and Chemicals Inc
- 11.1.2.1. Company Overview
- 11.1.2.2. Products
- 11.1.2.3. Company Financials
- 11.1.2.4. SWOT Analysis
- 11.1.3 Universal Industrial Gases Inc *List Not Exhaustive
- 11.1.3.1. Company Overview
- 11.1.3.2. Products
- 11.1.3.3. Company Financials
- 11.1.3.4. SWOT Analysis
- 11.1.4 Messer Group GMBH
- 11.1.4.1. Company Overview
- 11.1.4.2. Products
- 11.1.4.3. Company Financials
- 11.1.4.4. SWOT Analysis
- 11.1.5 Iwatani Corporation
- 11.1.5.1. Company Overview
- 11.1.5.2. Products
- 11.1.5.3. Company Financials
- 11.1.5.4. SWOT Analysis
- 11.1.6 Air Liquide
- 11.1.6.1. Company Overview
- 11.1.6.2. Products
- 11.1.6.3. Company Financials
- 11.1.6.4. SWOT Analysis
- 11.1.7 Nippon Sanso Holdings Corporation
- 11.1.7.1. Company Overview
- 11.1.7.2. Products
- 11.1.7.3. Company Financials
- 11.1.7.4. SWOT Analysis
- 11.1.8 Nippon Sanso Holdings Corporation
- 11.1.8.1. Company Overview
- 11.1.8.2. Products
- 11.1.8.3. Company Financials
- 11.1.8.4. SWOT Analysis
- 11.1.9 Praxair Technology Inc.
- 11.1.9.1. Company Overview
- 11.1.9.2. Products
- 11.1.9.3. Company Financials
- 11.1.9.4. SWOT Analysis
- 11.1.10 ITM Power
- 11.1.10.1. Company Overview
- 11.1.10.2. Products
- 11.1.10.3. Company Financials
- 11.1.10.4. SWOT Analysis
- 11.1.1 Linde PLC
- 11.2. Market Entropy
- 11.2.1 Company's Key Areas Served
- 11.2.2 Recent Developments
- 11.3. Company Market Share Analysis 2025
- 11.3.1 Top 5 Companies Market Share Analysis
- 11.3.2 Top 3 Companies Market Share Analysis
- 11.4. List of Potential Customers
- 12. Research Methodology
List of Figures
- Figure 1: Global Liquid Hydrogen Industry Revenue Breakdown (Million, %) by Region 2025 & 2033
- Figure 2: Global Liquid Hydrogen Industry Volume Breakdown (kilotons, %) by Region 2025 & 2033
- Figure 3: Asia Pacific Liquid Hydrogen Industry Revenue (Million), by Distribution 2025 & 2033
- Figure 4: Asia Pacific Liquid Hydrogen Industry Volume (kilotons), by Distribution 2025 & 2033
- Figure 5: Asia Pacific Liquid Hydrogen Industry Revenue Share (%), by Distribution 2025 & 2033
- Figure 6: Asia Pacific Liquid Hydrogen Industry Volume Share (%), by Distribution 2025 & 2033
- Figure 7: Asia Pacific Liquid Hydrogen Industry Revenue (Million), by End-user Industry 2025 & 2033
- Figure 8: Asia Pacific Liquid Hydrogen Industry Volume (kilotons), by End-user Industry 2025 & 2033
- Figure 9: Asia Pacific Liquid Hydrogen Industry Revenue Share (%), by End-user Industry 2025 & 2033
- Figure 10: Asia Pacific Liquid Hydrogen Industry Volume Share (%), by End-user Industry 2025 & 2033
- Figure 11: Asia Pacific Liquid Hydrogen Industry Revenue (Million), by Country 2025 & 2033
- Figure 12: Asia Pacific Liquid Hydrogen Industry Volume (kilotons), by Country 2025 & 2033
- Figure 13: Asia Pacific Liquid Hydrogen Industry Revenue Share (%), by Country 2025 & 2033
- Figure 14: Asia Pacific Liquid Hydrogen Industry Volume Share (%), by Country 2025 & 2033
- Figure 15: North America Liquid Hydrogen Industry Revenue (Million), by Distribution 2025 & 2033
- Figure 16: North America Liquid Hydrogen Industry Volume (kilotons), by Distribution 2025 & 2033
- Figure 17: North America Liquid Hydrogen Industry Revenue Share (%), by Distribution 2025 & 2033
- Figure 18: North America Liquid Hydrogen Industry Volume Share (%), by Distribution 2025 & 2033
- Figure 19: North America Liquid Hydrogen Industry Revenue (Million), by End-user Industry 2025 & 2033
- Figure 20: North America Liquid Hydrogen Industry Volume (kilotons), by End-user Industry 2025 & 2033
- Figure 21: North America Liquid Hydrogen Industry Revenue Share (%), by End-user Industry 2025 & 2033
- Figure 22: North America Liquid Hydrogen Industry Volume Share (%), by End-user Industry 2025 & 2033
- Figure 23: North America Liquid Hydrogen Industry Revenue (Million), by Country 2025 & 2033
- Figure 24: North America Liquid Hydrogen Industry Volume (kilotons), by Country 2025 & 2033
- Figure 25: North America Liquid Hydrogen Industry Revenue Share (%), by Country 2025 & 2033
- Figure 26: North America Liquid Hydrogen Industry Volume Share (%), by Country 2025 & 2033
- Figure 27: Europe Liquid Hydrogen Industry Revenue (Million), by Distribution 2025 & 2033
- Figure 28: Europe Liquid Hydrogen Industry Volume (kilotons), by Distribution 2025 & 2033
- Figure 29: Europe Liquid Hydrogen Industry Revenue Share (%), by Distribution 2025 & 2033
- Figure 30: Europe Liquid Hydrogen Industry Volume Share (%), by Distribution 2025 & 2033
- Figure 31: Europe Liquid Hydrogen Industry Revenue (Million), by End-user Industry 2025 & 2033
- Figure 32: Europe Liquid Hydrogen Industry Volume (kilotons), by End-user Industry 2025 & 2033
- Figure 33: Europe Liquid Hydrogen Industry Revenue Share (%), by End-user Industry 2025 & 2033
- Figure 34: Europe Liquid Hydrogen Industry Volume Share (%), by End-user Industry 2025 & 2033
- Figure 35: Europe Liquid Hydrogen Industry Revenue (Million), by Country 2025 & 2033
- Figure 36: Europe Liquid Hydrogen Industry Volume (kilotons), by Country 2025 & 2033
- Figure 37: Europe Liquid Hydrogen Industry Revenue Share (%), by Country 2025 & 2033
- Figure 38: Europe Liquid Hydrogen Industry Volume Share (%), by Country 2025 & 2033
- Figure 39: Rest of the World Liquid Hydrogen Industry Revenue (Million), by Distribution 2025 & 2033
- Figure 40: Rest of the World Liquid Hydrogen Industry Volume (kilotons), by Distribution 2025 & 2033
- Figure 41: Rest of the World Liquid Hydrogen Industry Revenue Share (%), by Distribution 2025 & 2033
- Figure 42: Rest of the World Liquid Hydrogen Industry Volume Share (%), by Distribution 2025 & 2033
- Figure 43: Rest of the World Liquid Hydrogen Industry Revenue (Million), by End-user Industry 2025 & 2033
- Figure 44: Rest of the World Liquid Hydrogen Industry Volume (kilotons), by End-user Industry 2025 & 2033
- Figure 45: Rest of the World Liquid Hydrogen Industry Revenue Share (%), by End-user Industry 2025 & 2033
- Figure 46: Rest of the World Liquid Hydrogen Industry Volume Share (%), by End-user Industry 2025 & 2033
- Figure 47: Rest of the World Liquid Hydrogen Industry Revenue (Million), by Country 2025 & 2033
- Figure 48: Rest of the World Liquid Hydrogen Industry Volume (kilotons), by Country 2025 & 2033
- Figure 49: Rest of the World Liquid Hydrogen Industry Revenue Share (%), by Country 2025 & 2033
- Figure 50: Rest of the World Liquid Hydrogen Industry Volume Share (%), by Country 2025 & 2033
List of Tables
- Table 1: Global Liquid Hydrogen Industry Revenue Million Forecast, by Distribution 2020 & 2033
- Table 2: Global Liquid Hydrogen Industry Volume kilotons Forecast, by Distribution 2020 & 2033
- Table 3: Global Liquid Hydrogen Industry Revenue Million Forecast, by End-user Industry 2020 & 2033
- Table 4: Global Liquid Hydrogen Industry Volume kilotons Forecast, by End-user Industry 2020 & 2033
- Table 5: Global Liquid Hydrogen Industry Revenue Million Forecast, by Region 2020 & 2033
- Table 6: Global Liquid Hydrogen Industry Volume kilotons Forecast, by Region 2020 & 2033
- Table 7: Global Liquid Hydrogen Industry Revenue Million Forecast, by Distribution 2020 & 2033
- Table 8: Global Liquid Hydrogen Industry Volume kilotons Forecast, by Distribution 2020 & 2033
- Table 9: Global Liquid Hydrogen Industry Revenue Million Forecast, by End-user Industry 2020 & 2033
- Table 10: Global Liquid Hydrogen Industry Volume kilotons Forecast, by End-user Industry 2020 & 2033
- Table 11: Global Liquid Hydrogen Industry Revenue Million Forecast, by Country 2020 & 2033
- Table 12: Global Liquid Hydrogen Industry Volume kilotons Forecast, by Country 2020 & 2033
- Table 13: China Liquid Hydrogen Industry Revenue (Million) Forecast, by Application 2020 & 2033
- Table 14: China Liquid Hydrogen Industry Volume (kilotons) Forecast, by Application 2020 & 2033
- Table 15: India Liquid Hydrogen Industry Revenue (Million) Forecast, by Application 2020 & 2033
- Table 16: India Liquid Hydrogen Industry Volume (kilotons) Forecast, by Application 2020 & 2033
- Table 17: Japan Liquid Hydrogen Industry Revenue (Million) Forecast, by Application 2020 & 2033
- Table 18: Japan Liquid Hydrogen Industry Volume (kilotons) Forecast, by Application 2020 & 2033
- Table 19: South Korea Liquid Hydrogen Industry Revenue (Million) Forecast, by Application 2020 & 2033
- Table 20: South Korea Liquid Hydrogen Industry Volume (kilotons) Forecast, by Application 2020 & 2033
- Table 21: Rest of Asia Pacific Liquid Hydrogen Industry Revenue (Million) Forecast, by Application 2020 & 2033
- Table 22: Rest of Asia Pacific Liquid Hydrogen Industry Volume (kilotons) Forecast, by Application 2020 & 2033
- Table 23: Global Liquid Hydrogen Industry Revenue Million Forecast, by Distribution 2020 & 2033
- Table 24: Global Liquid Hydrogen Industry Volume kilotons Forecast, by Distribution 2020 & 2033
- Table 25: Global Liquid Hydrogen Industry Revenue Million Forecast, by End-user Industry 2020 & 2033
- Table 26: Global Liquid Hydrogen Industry Volume kilotons Forecast, by End-user Industry 2020 & 2033
- Table 27: Global Liquid Hydrogen Industry Revenue Million Forecast, by Country 2020 & 2033
- Table 28: Global Liquid Hydrogen Industry Volume kilotons Forecast, by Country 2020 & 2033
- Table 29: United States Liquid Hydrogen Industry Revenue (Million) Forecast, by Application 2020 & 2033
- Table 30: United States Liquid Hydrogen Industry Volume (kilotons) Forecast, by Application 2020 & 2033
- Table 31: Canada Liquid Hydrogen Industry Revenue (Million) Forecast, by Application 2020 & 2033
- Table 32: Canada Liquid Hydrogen Industry Volume (kilotons) Forecast, by Application 2020 & 2033
- Table 33: Mexico Liquid Hydrogen Industry Revenue (Million) Forecast, by Application 2020 & 2033
- Table 34: Mexico Liquid Hydrogen Industry Volume (kilotons) Forecast, by Application 2020 & 2033
- Table 35: Global Liquid Hydrogen Industry Revenue Million Forecast, by Distribution 2020 & 2033
- Table 36: Global Liquid Hydrogen Industry Volume kilotons Forecast, by Distribution 2020 & 2033
- Table 37: Global Liquid Hydrogen Industry Revenue Million Forecast, by End-user Industry 2020 & 2033
- Table 38: Global Liquid Hydrogen Industry Volume kilotons Forecast, by End-user Industry 2020 & 2033
- Table 39: Global Liquid Hydrogen Industry Revenue Million Forecast, by Country 2020 & 2033
- Table 40: Global Liquid Hydrogen Industry Volume kilotons Forecast, by Country 2020 & 2033
- Table 41: Germany Liquid Hydrogen Industry Revenue (Million) Forecast, by Application 2020 & 2033
- Table 42: Germany Liquid Hydrogen Industry Volume (kilotons) Forecast, by Application 2020 & 2033
- Table 43: United Kingdom Liquid Hydrogen Industry Revenue (Million) Forecast, by Application 2020 & 2033
- Table 44: United Kingdom Liquid Hydrogen Industry Volume (kilotons) Forecast, by Application 2020 & 2033
- Table 45: Italy Liquid Hydrogen Industry Revenue (Million) Forecast, by Application 2020 & 2033
- Table 46: Italy Liquid Hydrogen Industry Volume (kilotons) Forecast, by Application 2020 & 2033
- Table 47: France Liquid Hydrogen Industry Revenue (Million) Forecast, by Application 2020 & 2033
- Table 48: France Liquid Hydrogen Industry Volume (kilotons) Forecast, by Application 2020 & 2033
- Table 49: Rest of Europe Liquid Hydrogen Industry Revenue (Million) Forecast, by Application 2020 & 2033
- Table 50: Rest of Europe Liquid Hydrogen Industry Volume (kilotons) Forecast, by Application 2020 & 2033
- Table 51: Global Liquid Hydrogen Industry Revenue Million Forecast, by Distribution 2020 & 2033
- Table 52: Global Liquid Hydrogen Industry Volume kilotons Forecast, by Distribution 2020 & 2033
- Table 53: Global Liquid Hydrogen Industry Revenue Million Forecast, by End-user Industry 2020 & 2033
- Table 54: Global Liquid Hydrogen Industry Volume kilotons Forecast, by End-user Industry 2020 & 2033
- Table 55: Global Liquid Hydrogen Industry Revenue Million Forecast, by Country 2020 & 2033
- Table 56: Global Liquid Hydrogen Industry Volume kilotons Forecast, by Country 2020 & 2033
- Table 57: South America Liquid Hydrogen Industry Revenue (Million) Forecast, by Application 2020 & 2033
- Table 58: South America Liquid Hydrogen Industry Volume (kilotons) Forecast, by Application 2020 & 2033
- Table 59: Middle East and Africa Liquid Hydrogen Industry Revenue (Million) Forecast, by Application 2020 & 2033
- Table 60: Middle East and Africa Liquid Hydrogen Industry Volume (kilotons) Forecast, by Application 2020 & 2033
Frequently Asked Questions
1. What is the projected Compound Annual Growth Rate (CAGR) of the Liquid Hydrogen Industry?
The projected CAGR is approximately 10.27%.
2. Which companies are prominent players in the Liquid Hydrogen Industry?
Key companies in the market include Linde PLC, Air Products and Chemicals Inc, Universal Industrial Gases Inc *List Not Exhaustive, Messer Group GMBH, Iwatani Corporation, Air Liquide, Nippon Sanso Holdings Corporation, Nippon Sanso Holdings Corporation , Praxair Technology Inc. , ITM Power.
3. What are the main segments of the Liquid Hydrogen Industry?
The market segments include Distribution, End-user Industry.
4. Can you provide details about the market size?
The market size is estimated to be USD 38400 Million as of 2022.
5. What are some drivers contributing to market growth?
Growing Demand for Liquid Hydrogen for Space Exploration; Increasing Adoption of Hydrogen Fuel Cell in Commercial Vehicle.
6. What are the notable trends driving market growth?
Aerospace Industry to Dominate the Market.
7. Are there any restraints impacting market growth?
High Cost Associated with Handling and Storage; Other Restraints.
8. Can you provide examples of recent developments in the market?
Mar 2023: Iwatani Corporation and ENEOS Corporation were working to deliver a "Liquefied Hydrogen Supply Chain Commercialization Demonstration Project. The project aims to develop marine transportation technologies of liquefied clean hydrogen, which will help to achieve a hydrogen supply cost of 30 JPY/Nm3 by 2030.
9. What pricing options are available for accessing the report?
Pricing options include single-user, multi-user, and enterprise licenses priced at USD 4750, USD 5250, and USD 8750 respectively.
10. Is the market size provided in terms of value or volume?
The market size is provided in terms of value, measured in Million and volume, measured in kilotons.
11. Are there any specific market keywords associated with the report?
Yes, the market keyword associated with the report is "Liquid Hydrogen Industry," which aids in identifying and referencing the specific market segment covered.
12. How do I determine which pricing option suits my needs best?
The pricing options vary based on user requirements and access needs. Individual users may opt for single-user licenses, while businesses requiring broader access may choose multi-user or enterprise licenses for cost-effective access to the report.
13. Are there any additional resources or data provided in the Liquid Hydrogen Industry report?
While the report offers comprehensive insights, it's advisable to review the specific contents or supplementary materials provided to ascertain if additional resources or data are available.
14. How can I stay updated on further developments or reports in the Liquid Hydrogen Industry?
To stay informed about further developments, trends, and reports in the Liquid Hydrogen Industry, consider subscribing to industry newsletters, following relevant companies and organizations, or regularly checking reputable industry news sources and publications.
Methodology
Step 1 - Identification of Relevant Samples Size from Population Database


Step 2 - Approaches for Defining Global Market Size (Value, Volume* & Price*)

Note*: In applicable scenarios
Step 3 - Data Sources
Primary Research
- Web Analytics
- Survey Reports
- Research Institute
- Latest Research Reports
- Opinion Leaders
Secondary Research
- Annual Reports
- White Paper
- Latest Press Release
- Industry Association
- Paid Database
- Investor Presentations

Step 4 - Data Triangulation
Involves using different sources of information in order to increase the validity of a study
These sources are likely to be stakeholders in a program - participants, other researchers, program staff, other community members, and so on.
Then we put all data in single framework & apply various statistical tools to find out the dynamic on the market.
During the analysis stage, feedback from the stakeholder groups would be compared to determine areas of agreement as well as areas of divergence