

Key Insights
The MEA Waterborne Adhesives market, though smaller than mature markets like North America and Europe, demonstrates substantial growth potential with a projected CAGR of 9.5%. Key growth drivers include the robust expansion of the construction sector, especially in the UAE and Saudi Arabia, with significant infrastructure projects driving demand. Increasing adoption of eco-friendly and sustainable materials, owing to the lower VOC emissions of waterborne adhesives and alignment with regional environmental regulations, is another significant factor. The packaging industry, particularly for food and consumer goods, also contributes to market expansion. Based on the global market size and projected CAGR, the MEA market size is estimated at 38.63 billion in the base year 2024. This estimate is supported by rapid industrialization across the region. The building and construction sector dominates end-user demand, followed by paper, board, and packaging. Acrylics and PVA emulsions are the primary resin types, with growing demand for polyurethane dispersions and advanced resins due to superior performance. Potential restraints include raw material price volatility and limited awareness of waterborne adhesive benefits in certain sectors.
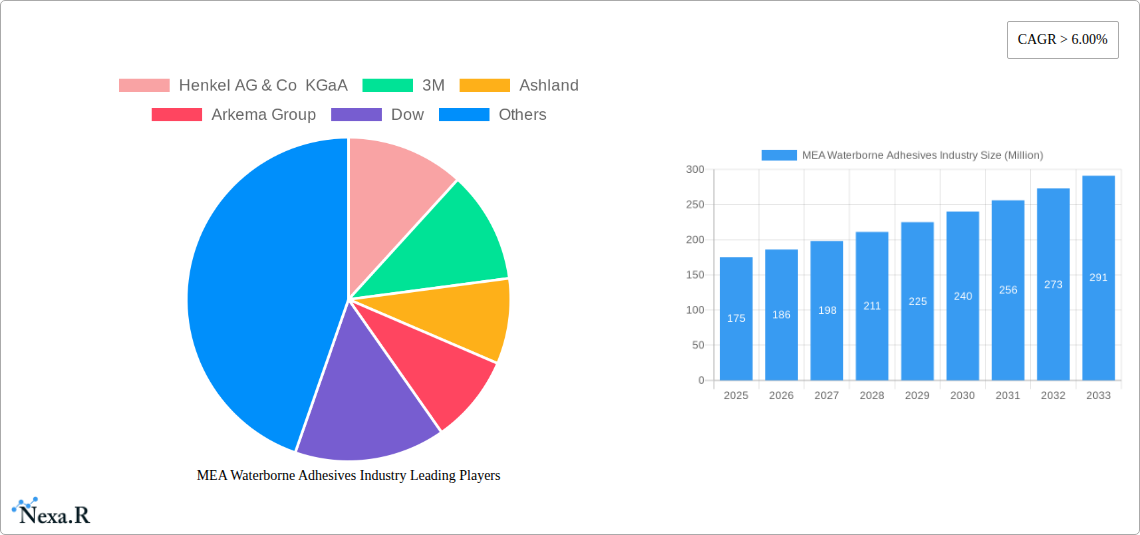
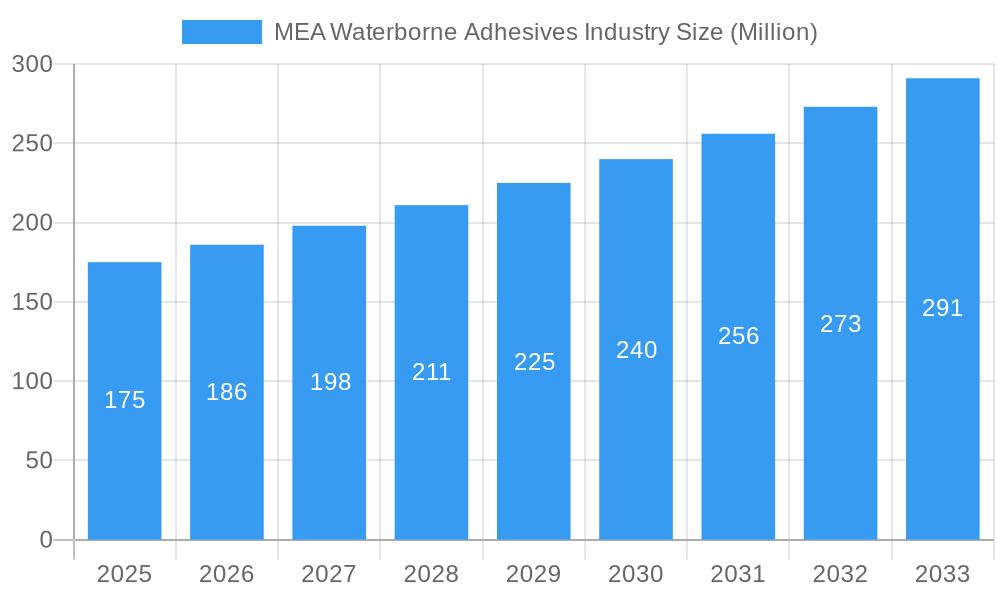
MEA Waterborne Adhesives Industry Market Size (In Billion)
Looking ahead to 2033, ongoing infrastructural development and industrial expansion in the MEA region are expected to sustain market growth. A heightened focus on sustainable building practices and circular economy principles will further accelerate the adoption of waterborne adhesives. The competitive landscape will be shaped by established players and the potential emergence of new regional manufacturers. Challenges may include maintaining supply chain stability and navigating fluctuating energy prices impacting raw material costs. Growth rates will vary across sub-regions, with economically expanding nations likely outpacing slower-growing ones. Strategic partnerships and R&D investments in performance enhancement and cost optimization will be critical for long-term success in this dynamic market.
MEA Waterborne Adhesives Industry Company Market Share
MEA Waterborne Adhesives Industry: A Comprehensive Market Report (2019-2033)
This comprehensive report provides an in-depth analysis of the Middle East and Africa (MEA) waterborne adhesives market, offering invaluable insights for industry professionals, investors, and strategists. The report covers the period 2019-2033, with a focus on the 2025-2033 forecast period. Market size is presented in million units.
MEA Waterborne Adhesives Industry Market Dynamics & Structure
This section analyzes the MEA waterborne adhesives market's structure, focusing on market concentration, technological advancements, regulatory landscapes, competitive dynamics, and end-user demographics. The analysis incorporates both quantitative and qualitative data, including market share percentages and M&A deal volumes.
Market Concentration: The MEA waterborne adhesives market exhibits a moderately concentrated structure, with key players such as Henkel AG & Co KGaA, 3M, Ashland, Arkema Group, Dow, Avery Dennison Corporation, Sika AG, and Wacker Chemie AG holding significant market share. However, the presence of several smaller regional players indicates opportunities for both consolidation and competition. The market share of the top 5 players is estimated at xx% in 2025.
Technological Innovation: Technological advancements in adhesive formulations, focusing on improved performance, sustainability, and ease of application, are key drivers of market growth. Innovation in areas such as bio-based adhesives and high-performance waterborne formulations is particularly significant. However, high R&D costs and stringent regulatory requirements pose barriers to innovation.
Regulatory Frameworks: Government regulations focusing on environmental sustainability and worker safety influence product formulations and manufacturing processes. Compliance with these regulations impacts both production costs and market entry strategies.
Competitive Product Substitutes: Solvent-based adhesives remain a competitive alternative, particularly in niche applications. However, increasing environmental concerns and stricter regulations are gradually shifting the preference towards waterborne options.
End-User Demographics: Growth in the construction, packaging, and woodworking industries in several MEA countries significantly impacts market demand. Changing consumer preferences towards eco-friendly products also favor the growth of waterborne adhesives.
M&A Trends: The MEA waterborne adhesives market has witnessed a moderate level of M&A activity in recent years. The number of transactions is estimated to be xx in the period 2019-2024, primarily driven by strategies for market expansion and technological acquisition.
MEA Waterborne Adhesives Industry Growth Trends & Insights
This section analyzes the historical and projected growth of the MEA waterborne adhesives market, incorporating data on market size evolution, adoption rates, technological disruptions, and shifts in consumer behavior. The analysis utilizes data and models to project the market's future trajectory and identify potential growth areas. The market size is expected to grow from xx million units in 2024 to xx million units by 2033, achieving a CAGR of xx%.
Several factors are driving this growth. Increased infrastructure development across the MEA region, especially in the building and construction sector, fuels demand. A rising middle class with increased disposable income contributes to the consumption of packaged goods, in turn demanding greater adhesive use. Additionally, the adoption of sustainable practices by manufacturers is pushing the shift towards environmentally friendly waterborne adhesives.
Dominant Regions, Countries, or Segments in MEA Waterborne Adhesives Industry
This section identifies the leading regions, countries, and segments within the MEA waterborne adhesives market, highlighting key growth drivers.
Leading Regions: The report identifies [Specific Country/Region] as the leading market due to [Reasons e.g., robust construction sector, favorable government policies]. [Another Region] is projected to experience significant growth due to [Reasons].
Resin Type: Polyvinyl Acetate (PVA) Emulsion currently holds the largest market share, driven by its cost-effectiveness and wide range of applications. However, Acrylics are expected to showcase high growth due to their superior performance characteristics.
End-user Industry: The building and construction sector is the dominant end-user industry, followed by paper, board, and packaging. Growth in these sectors is closely linked to economic development and urbanization across the MEA region.
Key Drivers:
- Rapid urbanization and infrastructure development.
- Rising disposable incomes and consumption.
- Government initiatives promoting sustainable construction practices.
- Growing demand for packaged goods.
MEA Waterborne Adhesives Industry Product Landscape
Waterborne adhesives in the MEA market encompass a range of products tailored to specific applications, exhibiting diverse performance characteristics like adhesion strength, open time, and water resistance. Recent innovations focus on enhancing these properties while incorporating eco-friendly features, such as lower VOC emissions and bio-based components. Manufacturers are also emphasizing ease of application and improved processing efficiency, catering to both industrial and DIY users.
Key Drivers, Barriers & Challenges in MEA Waterborne Adhesives Industry
Key Drivers: Increased construction activity, a growing packaging industry, and government support for sustainable materials are major drivers. Technological advancements leading to improved adhesive performance also contribute.
Key Challenges: Fluctuations in raw material prices, stringent environmental regulations, and intense competition from established players present significant challenges. Supply chain disruptions and logistical complexities also impact market stability. The impact of these challenges is estimated to reduce the market CAGR by xx% in the forecast period.
Emerging Opportunities in MEA Waterborne Adhesives Industry
Untapped markets in rural areas and the growing demand for specialized adhesives in niche sectors like healthcare and electronics represent significant opportunities. The development of bio-based and recyclable waterborne adhesives aligns with growing sustainability concerns and presents a strong opportunity for market expansion.
Growth Accelerators in the MEA Waterborne Adhesives Industry Industry
Strategic partnerships between adhesive manufacturers and downstream industries facilitate market penetration and product development. Technological breakthroughs in adhesive formulations and application methods further drive market expansion. Furthermore, the focus on developing high-performance, sustainable solutions creates significant growth potential.
Key Players Shaping the MEA Waterborne Adhesives Industry Market
- Henkel AG & Co KGaA
- 3M
- Ashland
- Arkema Group
- Dow
- Avery Dennison Corporation
- Sika AG
- Wacker Chemie AG
- List Not Exhaustive
Notable Milestones in MEA Waterborne Adhesives Industry Sector
- 2022 Q3: Launch of a new bio-based PVA emulsion by [Company Name].
- 2021 Q4: Acquisition of [Company A] by [Company B].
- 2020 Q1: Implementation of stricter environmental regulations in [Country].
- (Further milestones to be added)
In-Depth MEA Waterborne Adhesives Industry Market Outlook
The MEA waterborne adhesives market presents substantial growth potential driven by sustained infrastructure development, rising consumption, and increasing adoption of sustainable practices. Strategic investments in research and development, coupled with strategic partnerships, will be crucial for players seeking to capitalize on these opportunities. The focus on developing high-performance, environmentally friendly adhesives will shape the market's trajectory in the coming years.
MEA Waterborne Adhesives Industry Segmentation
-
1. Resin Type
- 1.1. Acrylics
- 1.2. Polyvinyl Acetate (PVA) Emulsion
- 1.3. Ethylene Vinyl Acetate (EVA) Emulsion
- 1.4. Polyuret
- 1.5. Other Resin Types
-
2. End-user Industry
- 2.1. Building & Construction
- 2.2. Paper, Board, and Packaging
- 2.3. Woodworking & Joinery
- 2.4. Transportation
- 2.5. Healthcare
- 2.6. Electrical & Electronics
- 2.7. Other End-user Industries
-
3. Geography
- 3.1. Saudi Arabia
- 3.2. South Africa
- 3.3. Rest of Middle-East and Africa
MEA Waterborne Adhesives Industry Segmentation By Geography
- 1. Saudi Arabia
- 2. South Africa
- 3. Rest of Middle East and Africa
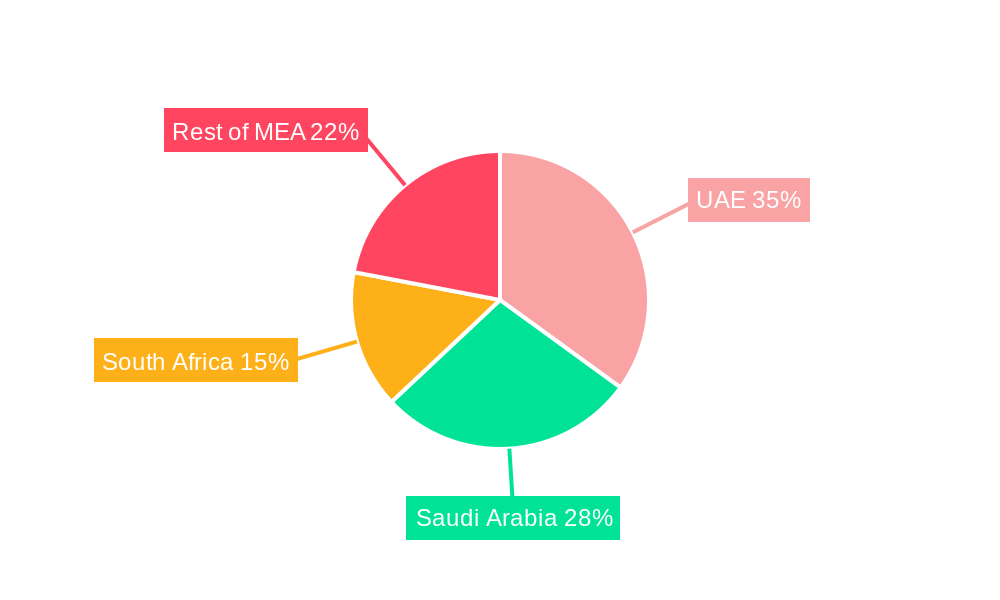
MEA Waterborne Adhesives Industry Regional Market Share
Geographic Coverage of MEA Waterborne Adhesives Industry
MEA Waterborne Adhesives Industry REPORT HIGHLIGHTS
| Aspects | Details |
|---|---|
| Study Period | 2020-2034 |
| Base Year | 2025 |
| Estimated Year | 2026 |
| Forecast Period | 2026-2034 |
| Historical Period | 2020-2025 |
| Growth Rate | CAGR of 9.5% from 2020-2034 |
| Segmentation |
|
Table of Contents
- 1. Introduction
- 1.1. Research Scope
- 1.2. Market Segmentation
- 1.3. Research Objective
- 1.4. Definitions and Assumptions
- 2. Executive Summary
- 2.1. Market Snapshot
- 3. Market Dynamics
- 3.1. Market Drivers
- 3.2. Market Restrains
- 3.3. Market Trends
- 3.4. Market Opportunities
- 4. Market Factor Analysis
- 4.1. Porters Five Forces
- 4.1.1. Bargaining Power of Suppliers
- 4.1.2. Bargaining Power of Buyers
- 4.1.3. Threat of New Entrants
- 4.1.4. Threat of Substitutes
- 4.1.5. Competitive Rivalry
- 4.2. PESTEL analysis
- 4.3. BCG Analysis
- 4.3.1. Stars (High Growth, High Market Share)
- 4.3.2. Cash Cows (Low Growth, High Market Share)
- 4.3.3. Question Mark (High Growth, Low Market Share)
- 4.3.4. Dogs (Low Growth, Low Market Share)
- 4.4. Ansoff Matrix Analysis
- 4.5. Supply Chain Analysis
- 4.6. Regulatory Landscape
- 4.7. Current Market Potential and Opportunity Assessment (TAM–SAM–SOM Framework)
- 4.8. NRP Analyst Note
- 4.1. Porters Five Forces
- 5. Market Analysis, Insights and Forecast 2021-2033
- 5.1. Market Analysis, Insights and Forecast - by Resin Type
- 5.1.1. Acrylics
- 5.1.2. Polyvinyl Acetate (PVA) Emulsion
- 5.1.3. Ethylene Vinyl Acetate (EVA) Emulsion
- 5.1.4. Polyuret
- 5.1.5. Other Resin Types
- 5.2. Market Analysis, Insights and Forecast - by End-user Industry
- 5.2.1. Building & Construction
- 5.2.2. Paper, Board, and Packaging
- 5.2.3. Woodworking & Joinery
- 5.2.4. Transportation
- 5.2.5. Healthcare
- 5.2.6. Electrical & Electronics
- 5.2.7. Other End-user Industries
- 5.3. Market Analysis, Insights and Forecast - by Geography
- 5.3.1. Saudi Arabia
- 5.3.2. South Africa
- 5.3.3. Rest of Middle-East and Africa
- 5.4. Market Analysis, Insights and Forecast - by Region
- 5.4.1. Saudi Arabia
- 5.4.2. South Africa
- 5.4.3. Rest of Middle East and Africa
- 5.1. Market Analysis, Insights and Forecast - by Resin Type
- 6. Global MEA Waterborne Adhesives Industry Analysis, Insights and Forecast, 2021-2033
- 6.1. Market Analysis, Insights and Forecast - by Resin Type
- 6.1.1. Acrylics
- 6.1.2. Polyvinyl Acetate (PVA) Emulsion
- 6.1.3. Ethylene Vinyl Acetate (EVA) Emulsion
- 6.1.4. Polyuret
- 6.1.5. Other Resin Types
- 6.2. Market Analysis, Insights and Forecast - by End-user Industry
- 6.2.1. Building & Construction
- 6.2.2. Paper, Board, and Packaging
- 6.2.3. Woodworking & Joinery
- 6.2.4. Transportation
- 6.2.5. Healthcare
- 6.2.6. Electrical & Electronics
- 6.2.7. Other End-user Industries
- 6.3. Market Analysis, Insights and Forecast - by Geography
- 6.3.1. Saudi Arabia
- 6.3.2. South Africa
- 6.3.3. Rest of Middle-East and Africa
- 6.1. Market Analysis, Insights and Forecast - by Resin Type
- 7. Saudi Arabia MEA Waterborne Adhesives Industry Analysis, Insights and Forecast, 2020-2032
- 7.1. Market Analysis, Insights and Forecast - by Resin Type
- 7.1.1. Acrylics
- 7.1.2. Polyvinyl Acetate (PVA) Emulsion
- 7.1.3. Ethylene Vinyl Acetate (EVA) Emulsion
- 7.1.4. Polyuret
- 7.1.5. Other Resin Types
- 7.2. Market Analysis, Insights and Forecast - by End-user Industry
- 7.2.1. Building & Construction
- 7.2.2. Paper, Board, and Packaging
- 7.2.3. Woodworking & Joinery
- 7.2.4. Transportation
- 7.2.5. Healthcare
- 7.2.6. Electrical & Electronics
- 7.2.7. Other End-user Industries
- 7.3. Market Analysis, Insights and Forecast - by Geography
- 7.3.1. Saudi Arabia
- 7.3.2. South Africa
- 7.3.3. Rest of Middle-East and Africa
- 7.1. Market Analysis, Insights and Forecast - by Resin Type
- 8. South Africa MEA Waterborne Adhesives Industry Analysis, Insights and Forecast, 2020-2032
- 8.1. Market Analysis, Insights and Forecast - by Resin Type
- 8.1.1. Acrylics
- 8.1.2. Polyvinyl Acetate (PVA) Emulsion
- 8.1.3. Ethylene Vinyl Acetate (EVA) Emulsion
- 8.1.4. Polyuret
- 8.1.5. Other Resin Types
- 8.2. Market Analysis, Insights and Forecast - by End-user Industry
- 8.2.1. Building & Construction
- 8.2.2. Paper, Board, and Packaging
- 8.2.3. Woodworking & Joinery
- 8.2.4. Transportation
- 8.2.5. Healthcare
- 8.2.6. Electrical & Electronics
- 8.2.7. Other End-user Industries
- 8.3. Market Analysis, Insights and Forecast - by Geography
- 8.3.1. Saudi Arabia
- 8.3.2. South Africa
- 8.3.3. Rest of Middle-East and Africa
- 8.1. Market Analysis, Insights and Forecast - by Resin Type
- 9. Rest of Middle East and Africa MEA Waterborne Adhesives Industry Analysis, Insights and Forecast, 2020-2032
- 9.1. Market Analysis, Insights and Forecast - by Resin Type
- 9.1.1. Acrylics
- 9.1.2. Polyvinyl Acetate (PVA) Emulsion
- 9.1.3. Ethylene Vinyl Acetate (EVA) Emulsion
- 9.1.4. Polyuret
- 9.1.5. Other Resin Types
- 9.2. Market Analysis, Insights and Forecast - by End-user Industry
- 9.2.1. Building & Construction
- 9.2.2. Paper, Board, and Packaging
- 9.2.3. Woodworking & Joinery
- 9.2.4. Transportation
- 9.2.5. Healthcare
- 9.2.6. Electrical & Electronics
- 9.2.7. Other End-user Industries
- 9.3. Market Analysis, Insights and Forecast - by Geography
- 9.3.1. Saudi Arabia
- 9.3.2. South Africa
- 9.3.3. Rest of Middle-East and Africa
- 9.1. Market Analysis, Insights and Forecast - by Resin Type
- 10. Competitive Analysis
- 10.1. Company Profiles
- 10.1.1 Henkel AG & Co KGaA
- 10.1.1.1. Company Overview
- 10.1.1.2. Products
- 10.1.1.3. Company Financials
- 10.1.1.4. SWOT Analysis
- 10.1.2 3M
- 10.1.2.1. Company Overview
- 10.1.2.2. Products
- 10.1.2.3. Company Financials
- 10.1.2.4. SWOT Analysis
- 10.1.3 Ashland
- 10.1.3.1. Company Overview
- 10.1.3.2. Products
- 10.1.3.3. Company Financials
- 10.1.3.4. SWOT Analysis
- 10.1.4 Arkema Group
- 10.1.4.1. Company Overview
- 10.1.4.2. Products
- 10.1.4.3. Company Financials
- 10.1.4.4. SWOT Analysis
- 10.1.5 Dow
- 10.1.5.1. Company Overview
- 10.1.5.2. Products
- 10.1.5.3. Company Financials
- 10.1.5.4. SWOT Analysis
- 10.1.6 Avery Dennison Corporation
- 10.1.6.1. Company Overview
- 10.1.6.2. Products
- 10.1.6.3. Company Financials
- 10.1.6.4. SWOT Analysis
- 10.1.7 Sika AG
- 10.1.7.1. Company Overview
- 10.1.7.2. Products
- 10.1.7.3. Company Financials
- 10.1.7.4. SWOT Analysis
- 10.1.8 Wacker Chemie AG*List Not Exhaustive
- 10.1.8.1. Company Overview
- 10.1.8.2. Products
- 10.1.8.3. Company Financials
- 10.1.8.4. SWOT Analysis
- 10.1.1 Henkel AG & Co KGaA
- 10.2. Market Entropy
- 10.2.1 Company's Key Areas Served
- 10.2.2 Recent Developments
- 10.3. Company Market Share Analysis 2025
- 10.3.1 Top 5 Companies Market Share Analysis
- 10.3.2 Top 3 Companies Market Share Analysis
- 10.4. List of Potential Customers
- 11. Research Methodology
List of Figures
- Figure 1: Global MEA Waterborne Adhesives Industry Revenue Breakdown (billion, %) by Region 2025 & 2033
- Figure 2: Saudi Arabia MEA Waterborne Adhesives Industry Revenue (billion), by Resin Type 2025 & 2033
- Figure 3: Saudi Arabia MEA Waterborne Adhesives Industry Revenue Share (%), by Resin Type 2025 & 2033
- Figure 4: Saudi Arabia MEA Waterborne Adhesives Industry Revenue (billion), by End-user Industry 2025 & 2033
- Figure 5: Saudi Arabia MEA Waterborne Adhesives Industry Revenue Share (%), by End-user Industry 2025 & 2033
- Figure 6: Saudi Arabia MEA Waterborne Adhesives Industry Revenue (billion), by Geography 2025 & 2033
- Figure 7: Saudi Arabia MEA Waterborne Adhesives Industry Revenue Share (%), by Geography 2025 & 2033
- Figure 8: Saudi Arabia MEA Waterborne Adhesives Industry Revenue (billion), by Country 2025 & 2033
- Figure 9: Saudi Arabia MEA Waterborne Adhesives Industry Revenue Share (%), by Country 2025 & 2033
- Figure 10: South Africa MEA Waterborne Adhesives Industry Revenue (billion), by Resin Type 2025 & 2033
- Figure 11: South Africa MEA Waterborne Adhesives Industry Revenue Share (%), by Resin Type 2025 & 2033
- Figure 12: South Africa MEA Waterborne Adhesives Industry Revenue (billion), by End-user Industry 2025 & 2033
- Figure 13: South Africa MEA Waterborne Adhesives Industry Revenue Share (%), by End-user Industry 2025 & 2033
- Figure 14: South Africa MEA Waterborne Adhesives Industry Revenue (billion), by Geography 2025 & 2033
- Figure 15: South Africa MEA Waterborne Adhesives Industry Revenue Share (%), by Geography 2025 & 2033
- Figure 16: South Africa MEA Waterborne Adhesives Industry Revenue (billion), by Country 2025 & 2033
- Figure 17: South Africa MEA Waterborne Adhesives Industry Revenue Share (%), by Country 2025 & 2033
- Figure 18: Rest of Middle East and Africa MEA Waterborne Adhesives Industry Revenue (billion), by Resin Type 2025 & 2033
- Figure 19: Rest of Middle East and Africa MEA Waterborne Adhesives Industry Revenue Share (%), by Resin Type 2025 & 2033
- Figure 20: Rest of Middle East and Africa MEA Waterborne Adhesives Industry Revenue (billion), by End-user Industry 2025 & 2033
- Figure 21: Rest of Middle East and Africa MEA Waterborne Adhesives Industry Revenue Share (%), by End-user Industry 2025 & 2033
- Figure 22: Rest of Middle East and Africa MEA Waterborne Adhesives Industry Revenue (billion), by Geography 2025 & 2033
- Figure 23: Rest of Middle East and Africa MEA Waterborne Adhesives Industry Revenue Share (%), by Geography 2025 & 2033
- Figure 24: Rest of Middle East and Africa MEA Waterborne Adhesives Industry Revenue (billion), by Country 2025 & 2033
- Figure 25: Rest of Middle East and Africa MEA Waterborne Adhesives Industry Revenue Share (%), by Country 2025 & 2033
List of Tables
- Table 1: Global MEA Waterborne Adhesives Industry Revenue billion Forecast, by Resin Type 2020 & 2033
- Table 2: Global MEA Waterborne Adhesives Industry Revenue billion Forecast, by End-user Industry 2020 & 2033
- Table 3: Global MEA Waterborne Adhesives Industry Revenue billion Forecast, by Geography 2020 & 2033
- Table 4: Global MEA Waterborne Adhesives Industry Revenue billion Forecast, by Region 2020 & 2033
- Table 5: Global MEA Waterborne Adhesives Industry Revenue billion Forecast, by Resin Type 2020 & 2033
- Table 6: Global MEA Waterborne Adhesives Industry Revenue billion Forecast, by End-user Industry 2020 & 2033
- Table 7: Global MEA Waterborne Adhesives Industry Revenue billion Forecast, by Geography 2020 & 2033
- Table 8: Global MEA Waterborne Adhesives Industry Revenue billion Forecast, by Country 2020 & 2033
- Table 9: Global MEA Waterborne Adhesives Industry Revenue billion Forecast, by Resin Type 2020 & 2033
- Table 10: Global MEA Waterborne Adhesives Industry Revenue billion Forecast, by End-user Industry 2020 & 2033
- Table 11: Global MEA Waterborne Adhesives Industry Revenue billion Forecast, by Geography 2020 & 2033
- Table 12: Global MEA Waterborne Adhesives Industry Revenue billion Forecast, by Country 2020 & 2033
- Table 13: Global MEA Waterborne Adhesives Industry Revenue billion Forecast, by Resin Type 2020 & 2033
- Table 14: Global MEA Waterborne Adhesives Industry Revenue billion Forecast, by End-user Industry 2020 & 2033
- Table 15: Global MEA Waterborne Adhesives Industry Revenue billion Forecast, by Geography 2020 & 2033
- Table 16: Global MEA Waterborne Adhesives Industry Revenue billion Forecast, by Country 2020 & 2033
Frequently Asked Questions
1. What is the projected Compound Annual Growth Rate (CAGR) of the MEA Waterborne Adhesives Industry?
The projected CAGR is approximately 9.5%.
2. Which companies are prominent players in the MEA Waterborne Adhesives Industry?
Key companies in the market include Henkel AG & Co KGaA, 3M, Ashland, Arkema Group, Dow, Avery Dennison Corporation, Sika AG, Wacker Chemie AG*List Not Exhaustive.
3. What are the main segments of the MEA Waterborne Adhesives Industry?
The market segments include Resin Type, End-user Industry, Geography.
4. Can you provide details about the market size?
The market size is estimated to be USD 38.63 billion as of 2022.
5. What are some drivers contributing to market growth?
; Availability of Raw Materials and Low Production Cost; Increasing Demand from Construction Industry.
6. What are the notable trends driving market growth?
Building & Construction to Dominate the Market.
7. Are there any restraints impacting market growth?
; Limited Usage in High End Applications; Other Restraints.
8. Can you provide examples of recent developments in the market?
N/A
9. What pricing options are available for accessing the report?
Pricing options include single-user, multi-user, and enterprise licenses priced at USD 4750, USD 5250, and USD 8750 respectively.
10. Is the market size provided in terms of value or volume?
The market size is provided in terms of value, measured in billion.
11. Are there any specific market keywords associated with the report?
Yes, the market keyword associated with the report is "MEA Waterborne Adhesives Industry," which aids in identifying and referencing the specific market segment covered.
12. How do I determine which pricing option suits my needs best?
The pricing options vary based on user requirements and access needs. Individual users may opt for single-user licenses, while businesses requiring broader access may choose multi-user or enterprise licenses for cost-effective access to the report.
13. Are there any additional resources or data provided in the MEA Waterborne Adhesives Industry report?
While the report offers comprehensive insights, it's advisable to review the specific contents or supplementary materials provided to ascertain if additional resources or data are available.
14. How can I stay updated on further developments or reports in the MEA Waterborne Adhesives Industry?
To stay informed about further developments, trends, and reports in the MEA Waterborne Adhesives Industry, consider subscribing to industry newsletters, following relevant companies and organizations, or regularly checking reputable industry news sources and publications.
Methodology
Step 1 - Identification of Relevant Samples Size from Population Database


Step 2 - Approaches for Defining Global Market Size (Value, Volume* & Price*)

Note*: In applicable scenarios
Step 3 - Data Sources
Primary Research
- Web Analytics
- Survey Reports
- Research Institute
- Latest Research Reports
- Opinion Leaders
Secondary Research
- Annual Reports
- White Paper
- Latest Press Release
- Industry Association
- Paid Database
- Investor Presentations

Step 4 - Data Triangulation
Involves using different sources of information in order to increase the validity of a study
These sources are likely to be stakeholders in a program - participants, other researchers, program staff, other community members, and so on.
Then we put all data in single framework & apply various statistical tools to find out the dynamic on the market.
During the analysis stage, feedback from the stakeholder groups would be compared to determine areas of agreement as well as areas of divergence