

Key Insights
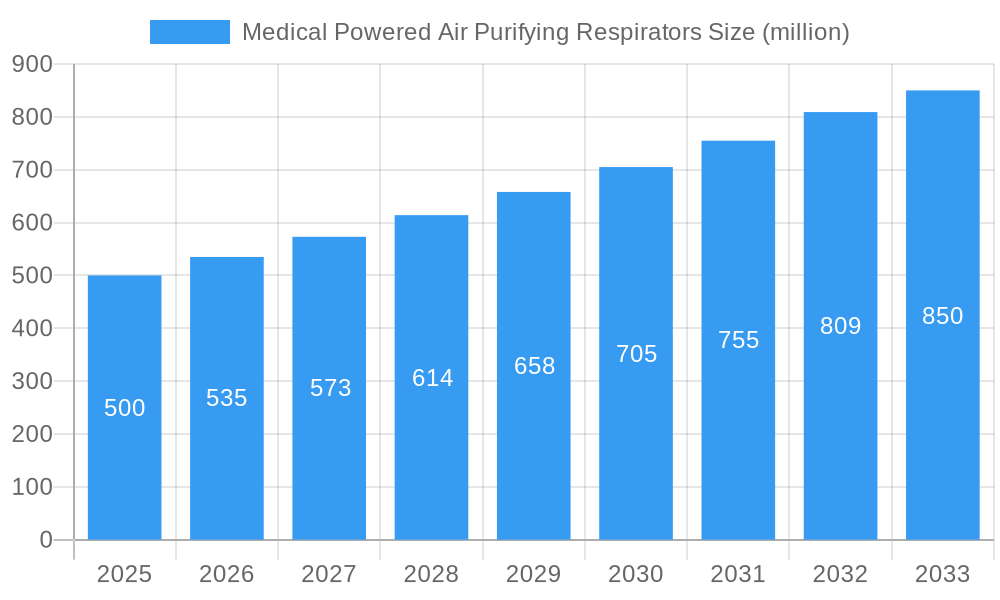
The global market for medical powered air purifying respirators (PAPR) is experiencing robust growth, driven by increasing awareness of occupational hazards in healthcare settings and stringent regulations promoting worker safety. The market, estimated at $500 million in 2025, is projected to exhibit a Compound Annual Growth Rate (CAGR) of 7% from 2025 to 2033, reaching approximately $850 million by 2033. This growth is fueled by several key factors. Firstly, the rising incidence of infectious diseases, such as influenza and tuberculosis, necessitates the use of advanced respiratory protection equipment like PAPRs to minimize the risk of infection among healthcare professionals. Secondly, the increasing adoption of PAPRs in various medical procedures, particularly those involving aerosolized particles, further boosts market demand. Technological advancements, including the development of lighter, more comfortable, and efficient PAPR systems, are also contributing to market expansion. Finally, government initiatives and regulatory mandates emphasizing workplace safety in healthcare facilities are creating a favorable environment for market growth.
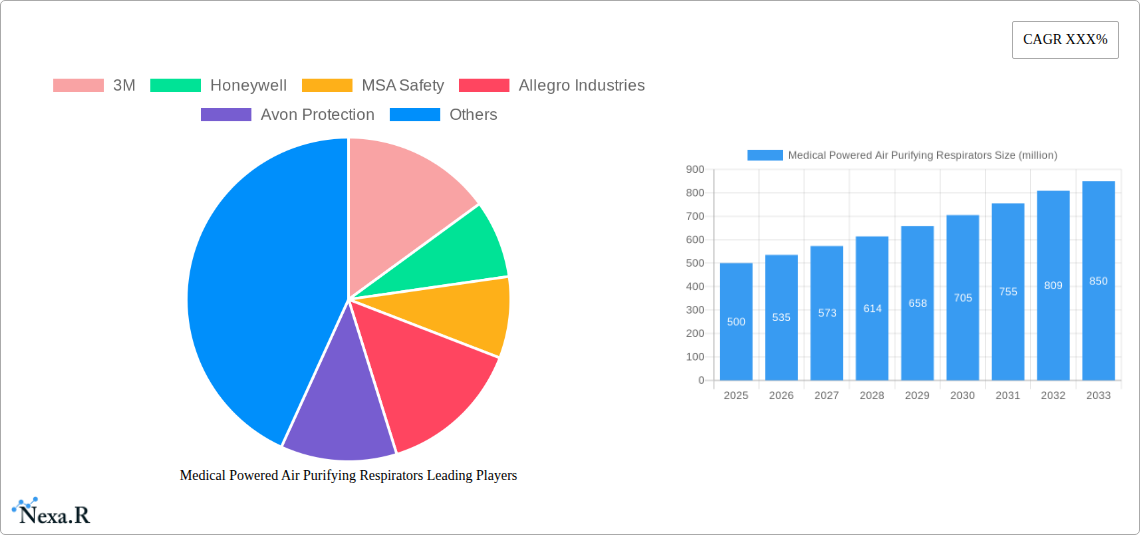
Medical Powered Air Purifying Respirators Market Size (In Million)
However, the market faces certain challenges. The high initial cost of PAPRs compared to traditional respirators can hinder adoption, particularly in resource-constrained healthcare settings. Furthermore, the need for regular maintenance and replacement of filters can impact the overall cost of ownership. Despite these restraints, the long-term benefits of enhanced respiratory protection and reduced healthcare-associated infections are expected to outweigh the initial investment costs. Major players like 3M, Honeywell, MSA Safety, and Dräger are continuously innovating to improve product design, reduce costs, and expand their market reach, contributing to the overall market dynamism. The segment encompassing hospitals and clinics constitutes a substantial portion of the market, followed by ambulatory surgical centers and research laboratories. Future growth is expected to be influenced by factors such as emerging infectious disease outbreaks, technological advancements, and evolving regulatory landscapes.
Medical Powered Air Purifying Respirators Company Market Share
Medical Powered Air Purifying Respirators Market Report: 2019-2033
This comprehensive report provides a detailed analysis of the Medical Powered Air Purifying Respirators (PAPR) market, offering invaluable insights for industry professionals, investors, and strategic decision-makers. Covering the period 2019-2033, with a base year of 2025 and a forecast period of 2025-2033, this report leverages extensive primary and secondary research to deliver a holistic understanding of this critical segment within the broader Personal Protective Equipment (PPE) and Healthcare markets. The total market size in 2025 is estimated at xx million units.
Medical Powered Air Purifying Respirators Market Dynamics & Structure
The Medical PAPR market is characterized by moderate concentration, with key players like 3M, Honeywell, and MSA Safety holding significant market share (estimated at 45% collectively in 2025). Technological innovation, driven by advancements in filter technology, battery life, and user comfort, is a key growth driver. Stringent regulatory frameworks, such as those set by NIOSH and OSHA, influence product design and adoption. Competitive substitutes, including traditional respirators and other respiratory protection devices, present challenges. The end-user demographic encompasses healthcare professionals (hospitals, clinics), industrial workers (pharmaceutical, manufacturing), and first responders. M&A activity in the sector is moderate, with xx deals recorded between 2019 and 2024, primarily focused on consolidating market share and expanding product portfolios.
- Market Concentration: Moderately concentrated, with top 3 players holding ~45% market share in 2025.
- Technological Innovation: Focus on improved filtration efficiency, extended battery life, enhanced comfort, and connectivity features.
- Regulatory Landscape: Strict compliance requirements (NIOSH, OSHA) influencing design and adoption.
- Competitive Substitutes: Traditional respirators, other respiratory protection devices pose competition.
- End-User Demographics: Primarily healthcare professionals, industrial workers, and first responders.
- M&A Activity: xx deals between 2019-2024, driving consolidation and expansion.
Medical Powered Air Purifying Respirators Growth Trends & Insights
The Medical PAPR market experienced significant growth during the historical period (2019-2024), driven by increased awareness of respiratory hazards and stringent safety regulations. The market size is projected to reach xx million units by 2033, exhibiting a Compound Annual Growth Rate (CAGR) of xx% during the forecast period (2025-2033). Technological disruptions, such as the integration of smart sensors and data analytics capabilities, are expected to further fuel adoption. A shift towards premium, feature-rich PAPRs is observed, reflecting a growing preference for enhanced safety and comfort. Market penetration in developing economies remains relatively low, presenting significant growth opportunities.
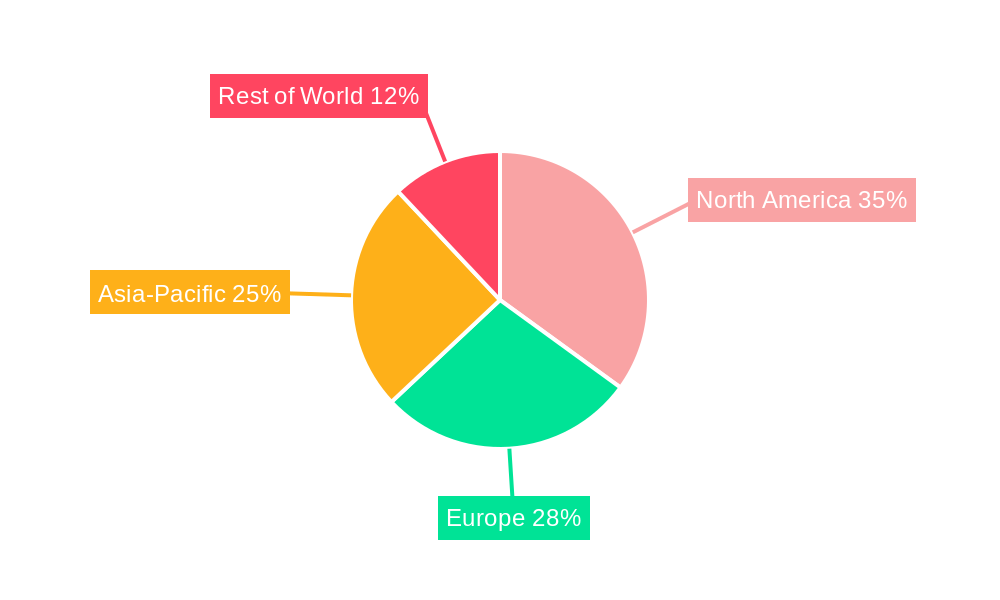
Dominant Regions, Countries, or Segments in Medical Powered Air Purifying Respirators
North America currently dominates the Medical PAPR market, driven by stringent safety regulations, high healthcare expenditure, and a robust industrial sector. Europe follows closely, with strong growth anticipated in Asia-Pacific due to increasing industrialization and rising healthcare infrastructure development. The healthcare segment accounts for the largest share, followed by industrial and first responder segments.
- North America: Strong regulatory environment, high healthcare spending, and established industrial base.
- Europe: Significant market presence, driven by similar factors to North America.
- Asia-Pacific: High growth potential due to increasing industrialization and rising healthcare infrastructure.
- Healthcare Segment: Largest market share due to high demand from hospitals and clinics.
Medical Powered Air Purifying Respirators Product Landscape
Medical PAPRs offer a wide range of features, including different filter types (HEPA, particulate, gas/vapor), varying battery life, and diverse headgear designs. Recent innovations include lightweight, comfortable designs, integrated communication systems, and improved filter efficiency. Unique selling propositions focus on superior respiratory protection, enhanced user comfort, and advanced features that meet specific application needs. Technological advancements are constantly being developed to further improve performance and user experience.
Key Drivers, Barriers & Challenges in Medical Powered Air Purifying Respirators
Key Drivers: Increasing awareness of airborne hazards, stringent safety regulations, growth in healthcare and industrial sectors, and technological advancements are driving market growth. Government initiatives promoting workplace safety further contribute to increased adoption.
Key Challenges: High initial investment costs, battery life limitations, potential discomfort from prolonged use, and supply chain disruptions impact market expansion. Regulatory complexities and intense competition also pose significant challenges. The impact of these challenges is estimated to reduce market growth by approximately xx% in 2025.
Emerging Opportunities in Medical Powered Air Purifying Respirators
Emerging opportunities lie in untapped markets, particularly in developing economies, and the development of specialized PAPRs for niche applications (e.g., infectious disease control, hazardous material handling). Integration of smart technologies, such as real-time monitoring and data analytics, holds immense potential. Evolving consumer preferences toward lightweight, ergonomic designs and improved comfort will shape future product development.
Growth Accelerators in the Medical Powered Air Purifying Respirators Industry
Technological breakthroughs in filter technology, battery life, and connectivity are key catalysts for long-term growth. Strategic partnerships between manufacturers and healthcare providers will accelerate market penetration. Expansion into new markets and diversification of product offerings will further fuel market growth.
Key Players Shaping the Medical Powered Air Purifying Respirators Market
- 3M
- Honeywell
- MSA Safety
- Allegro Industries
- Avon Protection
- Dräger
- Bullard
- Dragerwerk
- Kimberly-Clark Corporation
- Mine Safety Appliances (MSA) Company
- Scott Safety
- Avon Protection Systems
- Miller Electric
- ILC Dover
- Lincoln
- Sundstrom Safety AB
- ESAB
- Optrel
- Bio-Medical Devices International, Inc.
- Helmet Integrated Systems Ltd.
- Tecmen
- OTOS
- Maxair Systems
- RPB Safety
- Gentex Corporation
Notable Milestones in Medical Powered Air Purifying Respirators Sector
- 2020: Increased demand due to the COVID-19 pandemic.
- 2021: Several key players announced new product launches focusing on improved filtration and comfort.
- 2022: xx mergers and acquisitions reported.
- 2023: Focus on integrating smart technology.
- 2024: Significant investment in R&D.
In-Depth Medical Powered Air Purifying Respirators Market Outlook
The Medical PAPR market is poised for sustained growth over the forecast period, driven by continued technological advancements, increasing regulatory scrutiny, and expanding end-user segments. Strategic investments in R&D, strategic partnerships, and expansion into emerging markets will be crucial for capturing growth opportunities. The market is expected to witness a shift towards more sophisticated, feature-rich PAPRs integrated with advanced technologies.
Medical Powered Air Purifying Respirators Segmentation
-
1. Application
- 1.1. Industrial
- 1.2. Pharmaceutical Industry
- 1.3. Others
-
2. Type
- 2.1. Half Face Mask
- 2.2. Full Face Mask
Medical Powered Air Purifying Respirators Segmentation By Geography
-
1. North America
- 1.1. United States
- 1.2. Canada
- 1.3. Mexico
-
2. South America
- 2.1. Brazil
- 2.2. Argentina
- 2.3. Rest of South America
-
3. Europe
- 3.1. United Kingdom
- 3.2. Germany
- 3.3. France
- 3.4. Italy
- 3.5. Spain
- 3.6. Russia
- 3.7. Benelux
- 3.8. Nordics
- 3.9. Rest of Europe
-
4. Middle East & Africa
- 4.1. Turkey
- 4.2. Israel
- 4.3. GCC
- 4.4. North Africa
- 4.5. South Africa
- 4.6. Rest of Middle East & Africa
-
5. Asia Pacific
- 5.1. China
- 5.2. India
- 5.3. Japan
- 5.4. South Korea
- 5.5. ASEAN
- 5.6. Oceania
- 5.7. Rest of Asia Pacific
Medical Powered Air Purifying Respirators Regional Market Share
Geographic Coverage of Medical Powered Air Purifying Respirators
Medical Powered Air Purifying Respirators REPORT HIGHLIGHTS
| Aspects | Details |
|---|---|
| Study Period | 2020-2034 |
| Base Year | 2025 |
| Estimated Year | 2026 |
| Forecast Period | 2026-2034 |
| Historical Period | 2020-2025 |
| Growth Rate | CAGR of XXX% from 2020-2034 |
| Segmentation |
|
Table of Contents
- 1. Introduction
- 1.1. Research Scope
- 1.2. Market Segmentation
- 1.3. Research Methodology
- 1.4. Definitions and Assumptions
- 2. Executive Summary
- 2.1. Introduction
- 3. Market Dynamics
- 3.1. Introduction
- 3.2. Market Drivers
- 3.3. Market Restrains
- 3.4. Market Trends
- 4. Market Factor Analysis
- 4.1. Porters Five Forces
- 4.2. Supply/Value Chain
- 4.3. PESTEL analysis
- 4.4. Market Entropy
- 4.5. Patent/Trademark Analysis
- 5. Global Medical Powered Air Purifying Respirators Analysis, Insights and Forecast, 2020-2032
- 5.1. Market Analysis, Insights and Forecast - by Application
- 5.1.1. Industrial
- 5.1.2. Pharmaceutical Industry
- 5.1.3. Others
- 5.2. Market Analysis, Insights and Forecast - by Type
- 5.2.1. Half Face Mask
- 5.2.2. Full Face Mask
- 5.3. Market Analysis, Insights and Forecast - by Region
- 5.3.1. North America
- 5.3.2. South America
- 5.3.3. Europe
- 5.3.4. Middle East & Africa
- 5.3.5. Asia Pacific
- 5.1. Market Analysis, Insights and Forecast - by Application
- 6. North America Medical Powered Air Purifying Respirators Analysis, Insights and Forecast, 2020-2032
- 6.1. Market Analysis, Insights and Forecast - by Application
- 6.1.1. Industrial
- 6.1.2. Pharmaceutical Industry
- 6.1.3. Others
- 6.2. Market Analysis, Insights and Forecast - by Type
- 6.2.1. Half Face Mask
- 6.2.2. Full Face Mask
- 6.1. Market Analysis, Insights and Forecast - by Application
- 7. South America Medical Powered Air Purifying Respirators Analysis, Insights and Forecast, 2020-2032
- 7.1. Market Analysis, Insights and Forecast - by Application
- 7.1.1. Industrial
- 7.1.2. Pharmaceutical Industry
- 7.1.3. Others
- 7.2. Market Analysis, Insights and Forecast - by Type
- 7.2.1. Half Face Mask
- 7.2.2. Full Face Mask
- 7.1. Market Analysis, Insights and Forecast - by Application
- 8. Europe Medical Powered Air Purifying Respirators Analysis, Insights and Forecast, 2020-2032
- 8.1. Market Analysis, Insights and Forecast - by Application
- 8.1.1. Industrial
- 8.1.2. Pharmaceutical Industry
- 8.1.3. Others
- 8.2. Market Analysis, Insights and Forecast - by Type
- 8.2.1. Half Face Mask
- 8.2.2. Full Face Mask
- 8.1. Market Analysis, Insights and Forecast - by Application
- 9. Middle East & Africa Medical Powered Air Purifying Respirators Analysis, Insights and Forecast, 2020-2032
- 9.1. Market Analysis, Insights and Forecast - by Application
- 9.1.1. Industrial
- 9.1.2. Pharmaceutical Industry
- 9.1.3. Others
- 9.2. Market Analysis, Insights and Forecast - by Type
- 9.2.1. Half Face Mask
- 9.2.2. Full Face Mask
- 9.1. Market Analysis, Insights and Forecast - by Application
- 10. Asia Pacific Medical Powered Air Purifying Respirators Analysis, Insights and Forecast, 2020-2032
- 10.1. Market Analysis, Insights and Forecast - by Application
- 10.1.1. Industrial
- 10.1.2. Pharmaceutical Industry
- 10.1.3. Others
- 10.2. Market Analysis, Insights and Forecast - by Type
- 10.2.1. Half Face Mask
- 10.2.2. Full Face Mask
- 10.1. Market Analysis, Insights and Forecast - by Application
- 11. Competitive Analysis
- 11.1. Global Market Share Analysis 2025
- 11.2. Company Profiles
- 11.2.1 3M
- 11.2.1.1. Overview
- 11.2.1.2. Products
- 11.2.1.3. SWOT Analysis
- 11.2.1.4. Recent Developments
- 11.2.1.5. Financials (Based on Availability)
- 11.2.2 Honeywell
- 11.2.2.1. Overview
- 11.2.2.2. Products
- 11.2.2.3. SWOT Analysis
- 11.2.2.4. Recent Developments
- 11.2.2.5. Financials (Based on Availability)
- 11.2.3 MSA Safety
- 11.2.3.1. Overview
- 11.2.3.2. Products
- 11.2.3.3. SWOT Analysis
- 11.2.3.4. Recent Developments
- 11.2.3.5. Financials (Based on Availability)
- 11.2.4 Allegro Industries
- 11.2.4.1. Overview
- 11.2.4.2. Products
- 11.2.4.3. SWOT Analysis
- 11.2.4.4. Recent Developments
- 11.2.4.5. Financials (Based on Availability)
- 11.2.5 Avon Protection
- 11.2.5.1. Overview
- 11.2.5.2. Products
- 11.2.5.3. SWOT Analysis
- 11.2.5.4. Recent Developments
- 11.2.5.5. Financials (Based on Availability)
- 11.2.6 Dräger
- 11.2.6.1. Overview
- 11.2.6.2. Products
- 11.2.6.3. SWOT Analysis
- 11.2.6.4. Recent Developments
- 11.2.6.5. Financials (Based on Availability)
- 11.2.7 Bullard
- 11.2.7.1. Overview
- 11.2.7.2. Products
- 11.2.7.3. SWOT Analysis
- 11.2.7.4. Recent Developments
- 11.2.7.5. Financials (Based on Availability)
- 11.2.8 Dragerwerk
- 11.2.8.1. Overview
- 11.2.8.2. Products
- 11.2.8.3. SWOT Analysis
- 11.2.8.4. Recent Developments
- 11.2.8.5. Financials (Based on Availability)
- 11.2.9 Kimberly-Clark Corporation
- 11.2.9.1. Overview
- 11.2.9.2. Products
- 11.2.9.3. SWOT Analysis
- 11.2.9.4. Recent Developments
- 11.2.9.5. Financials (Based on Availability)
- 11.2.10 Mine Safety Appliances (MSA) Company
- 11.2.10.1. Overview
- 11.2.10.2. Products
- 11.2.10.3. SWOT Analysis
- 11.2.10.4. Recent Developments
- 11.2.10.5. Financials (Based on Availability)
- 11.2.11 Scott Safety
- 11.2.11.1. Overview
- 11.2.11.2. Products
- 11.2.11.3. SWOT Analysis
- 11.2.11.4. Recent Developments
- 11.2.11.5. Financials (Based on Availability)
- 11.2.12 Avon Protection Systems
- 11.2.12.1. Overview
- 11.2.12.2. Products
- 11.2.12.3. SWOT Analysis
- 11.2.12.4. Recent Developments
- 11.2.12.5. Financials (Based on Availability)
- 11.2.13 Miller Electric
- 11.2.13.1. Overview
- 11.2.13.2. Products
- 11.2.13.3. SWOT Analysis
- 11.2.13.4. Recent Developments
- 11.2.13.5. Financials (Based on Availability)
- 11.2.14 ILC Dover
- 11.2.14.1. Overview
- 11.2.14.2. Products
- 11.2.14.3. SWOT Analysis
- 11.2.14.4. Recent Developments
- 11.2.14.5. Financials (Based on Availability)
- 11.2.15 Lincoln
- 11.2.15.1. Overview
- 11.2.15.2. Products
- 11.2.15.3. SWOT Analysis
- 11.2.15.4. Recent Developments
- 11.2.15.5. Financials (Based on Availability)
- 11.2.16 Sundstrom Safety AB
- 11.2.16.1. Overview
- 11.2.16.2. Products
- 11.2.16.3. SWOT Analysis
- 11.2.16.4. Recent Developments
- 11.2.16.5. Financials (Based on Availability)
- 11.2.17 ESAB
- 11.2.17.1. Overview
- 11.2.17.2. Products
- 11.2.17.3. SWOT Analysis
- 11.2.17.4. Recent Developments
- 11.2.17.5. Financials (Based on Availability)
- 11.2.18 Optrel
- 11.2.18.1. Overview
- 11.2.18.2. Products
- 11.2.18.3. SWOT Analysis
- 11.2.18.4. Recent Developments
- 11.2.18.5. Financials (Based on Availability)
- 11.2.19 Bio-Medical Devices International Inc.
- 11.2.19.1. Overview
- 11.2.19.2. Products
- 11.2.19.3. SWOT Analysis
- 11.2.19.4. Recent Developments
- 11.2.19.5. Financials (Based on Availability)
- 11.2.20 Helmet Integrated Systems Ltd.
- 11.2.20.1. Overview
- 11.2.20.2. Products
- 11.2.20.3. SWOT Analysis
- 11.2.20.4. Recent Developments
- 11.2.20.5. Financials (Based on Availability)
- 11.2.21 Tecmen
- 11.2.21.1. Overview
- 11.2.21.2. Products
- 11.2.21.3. SWOT Analysis
- 11.2.21.4. Recent Developments
- 11.2.21.5. Financials (Based on Availability)
- 11.2.22 OTOS
- 11.2.22.1. Overview
- 11.2.22.2. Products
- 11.2.22.3. SWOT Analysis
- 11.2.22.4. Recent Developments
- 11.2.22.5. Financials (Based on Availability)
- 11.2.23 Maxair Systems
- 11.2.23.1. Overview
- 11.2.23.2. Products
- 11.2.23.3. SWOT Analysis
- 11.2.23.4. Recent Developments
- 11.2.23.5. Financials (Based on Availability)
- 11.2.24 RPB Safety
- 11.2.24.1. Overview
- 11.2.24.2. Products
- 11.2.24.3. SWOT Analysis
- 11.2.24.4. Recent Developments
- 11.2.24.5. Financials (Based on Availability)
- 11.2.25 Gentex Corporation
- 11.2.25.1. Overview
- 11.2.25.2. Products
- 11.2.25.3. SWOT Analysis
- 11.2.25.4. Recent Developments
- 11.2.25.5. Financials (Based on Availability)
- 11.2.1 3M
List of Figures
- Figure 1: Global Medical Powered Air Purifying Respirators Revenue Breakdown (million, %) by Region 2025 & 2033
- Figure 2: North America Medical Powered Air Purifying Respirators Revenue (million), by Application 2025 & 2033
- Figure 3: North America Medical Powered Air Purifying Respirators Revenue Share (%), by Application 2025 & 2033
- Figure 4: North America Medical Powered Air Purifying Respirators Revenue (million), by Type 2025 & 2033
- Figure 5: North America Medical Powered Air Purifying Respirators Revenue Share (%), by Type 2025 & 2033
- Figure 6: North America Medical Powered Air Purifying Respirators Revenue (million), by Country 2025 & 2033
- Figure 7: North America Medical Powered Air Purifying Respirators Revenue Share (%), by Country 2025 & 2033
- Figure 8: South America Medical Powered Air Purifying Respirators Revenue (million), by Application 2025 & 2033
- Figure 9: South America Medical Powered Air Purifying Respirators Revenue Share (%), by Application 2025 & 2033
- Figure 10: South America Medical Powered Air Purifying Respirators Revenue (million), by Type 2025 & 2033
- Figure 11: South America Medical Powered Air Purifying Respirators Revenue Share (%), by Type 2025 & 2033
- Figure 12: South America Medical Powered Air Purifying Respirators Revenue (million), by Country 2025 & 2033
- Figure 13: South America Medical Powered Air Purifying Respirators Revenue Share (%), by Country 2025 & 2033
- Figure 14: Europe Medical Powered Air Purifying Respirators Revenue (million), by Application 2025 & 2033
- Figure 15: Europe Medical Powered Air Purifying Respirators Revenue Share (%), by Application 2025 & 2033
- Figure 16: Europe Medical Powered Air Purifying Respirators Revenue (million), by Type 2025 & 2033
- Figure 17: Europe Medical Powered Air Purifying Respirators Revenue Share (%), by Type 2025 & 2033
- Figure 18: Europe Medical Powered Air Purifying Respirators Revenue (million), by Country 2025 & 2033
- Figure 19: Europe Medical Powered Air Purifying Respirators Revenue Share (%), by Country 2025 & 2033
- Figure 20: Middle East & Africa Medical Powered Air Purifying Respirators Revenue (million), by Application 2025 & 2033
- Figure 21: Middle East & Africa Medical Powered Air Purifying Respirators Revenue Share (%), by Application 2025 & 2033
- Figure 22: Middle East & Africa Medical Powered Air Purifying Respirators Revenue (million), by Type 2025 & 2033
- Figure 23: Middle East & Africa Medical Powered Air Purifying Respirators Revenue Share (%), by Type 2025 & 2033
- Figure 24: Middle East & Africa Medical Powered Air Purifying Respirators Revenue (million), by Country 2025 & 2033
- Figure 25: Middle East & Africa Medical Powered Air Purifying Respirators Revenue Share (%), by Country 2025 & 2033
- Figure 26: Asia Pacific Medical Powered Air Purifying Respirators Revenue (million), by Application 2025 & 2033
- Figure 27: Asia Pacific Medical Powered Air Purifying Respirators Revenue Share (%), by Application 2025 & 2033
- Figure 28: Asia Pacific Medical Powered Air Purifying Respirators Revenue (million), by Type 2025 & 2033
- Figure 29: Asia Pacific Medical Powered Air Purifying Respirators Revenue Share (%), by Type 2025 & 2033
- Figure 30: Asia Pacific Medical Powered Air Purifying Respirators Revenue (million), by Country 2025 & 2033
- Figure 31: Asia Pacific Medical Powered Air Purifying Respirators Revenue Share (%), by Country 2025 & 2033
List of Tables
- Table 1: Global Medical Powered Air Purifying Respirators Revenue million Forecast, by Application 2020 & 2033
- Table 2: Global Medical Powered Air Purifying Respirators Revenue million Forecast, by Type 2020 & 2033
- Table 3: Global Medical Powered Air Purifying Respirators Revenue million Forecast, by Region 2020 & 2033
- Table 4: Global Medical Powered Air Purifying Respirators Revenue million Forecast, by Application 2020 & 2033
- Table 5: Global Medical Powered Air Purifying Respirators Revenue million Forecast, by Type 2020 & 2033
- Table 6: Global Medical Powered Air Purifying Respirators Revenue million Forecast, by Country 2020 & 2033
- Table 7: United States Medical Powered Air Purifying Respirators Revenue (million) Forecast, by Application 2020 & 2033
- Table 8: Canada Medical Powered Air Purifying Respirators Revenue (million) Forecast, by Application 2020 & 2033
- Table 9: Mexico Medical Powered Air Purifying Respirators Revenue (million) Forecast, by Application 2020 & 2033
- Table 10: Global Medical Powered Air Purifying Respirators Revenue million Forecast, by Application 2020 & 2033
- Table 11: Global Medical Powered Air Purifying Respirators Revenue million Forecast, by Type 2020 & 2033
- Table 12: Global Medical Powered Air Purifying Respirators Revenue million Forecast, by Country 2020 & 2033
- Table 13: Brazil Medical Powered Air Purifying Respirators Revenue (million) Forecast, by Application 2020 & 2033
- Table 14: Argentina Medical Powered Air Purifying Respirators Revenue (million) Forecast, by Application 2020 & 2033
- Table 15: Rest of South America Medical Powered Air Purifying Respirators Revenue (million) Forecast, by Application 2020 & 2033
- Table 16: Global Medical Powered Air Purifying Respirators Revenue million Forecast, by Application 2020 & 2033
- Table 17: Global Medical Powered Air Purifying Respirators Revenue million Forecast, by Type 2020 & 2033
- Table 18: Global Medical Powered Air Purifying Respirators Revenue million Forecast, by Country 2020 & 2033
- Table 19: United Kingdom Medical Powered Air Purifying Respirators Revenue (million) Forecast, by Application 2020 & 2033
- Table 20: Germany Medical Powered Air Purifying Respirators Revenue (million) Forecast, by Application 2020 & 2033
- Table 21: France Medical Powered Air Purifying Respirators Revenue (million) Forecast, by Application 2020 & 2033
- Table 22: Italy Medical Powered Air Purifying Respirators Revenue (million) Forecast, by Application 2020 & 2033
- Table 23: Spain Medical Powered Air Purifying Respirators Revenue (million) Forecast, by Application 2020 & 2033
- Table 24: Russia Medical Powered Air Purifying Respirators Revenue (million) Forecast, by Application 2020 & 2033
- Table 25: Benelux Medical Powered Air Purifying Respirators Revenue (million) Forecast, by Application 2020 & 2033
- Table 26: Nordics Medical Powered Air Purifying Respirators Revenue (million) Forecast, by Application 2020 & 2033
- Table 27: Rest of Europe Medical Powered Air Purifying Respirators Revenue (million) Forecast, by Application 2020 & 2033
- Table 28: Global Medical Powered Air Purifying Respirators Revenue million Forecast, by Application 2020 & 2033
- Table 29: Global Medical Powered Air Purifying Respirators Revenue million Forecast, by Type 2020 & 2033
- Table 30: Global Medical Powered Air Purifying Respirators Revenue million Forecast, by Country 2020 & 2033
- Table 31: Turkey Medical Powered Air Purifying Respirators Revenue (million) Forecast, by Application 2020 & 2033
- Table 32: Israel Medical Powered Air Purifying Respirators Revenue (million) Forecast, by Application 2020 & 2033
- Table 33: GCC Medical Powered Air Purifying Respirators Revenue (million) Forecast, by Application 2020 & 2033
- Table 34: North Africa Medical Powered Air Purifying Respirators Revenue (million) Forecast, by Application 2020 & 2033
- Table 35: South Africa Medical Powered Air Purifying Respirators Revenue (million) Forecast, by Application 2020 & 2033
- Table 36: Rest of Middle East & Africa Medical Powered Air Purifying Respirators Revenue (million) Forecast, by Application 2020 & 2033
- Table 37: Global Medical Powered Air Purifying Respirators Revenue million Forecast, by Application 2020 & 2033
- Table 38: Global Medical Powered Air Purifying Respirators Revenue million Forecast, by Type 2020 & 2033
- Table 39: Global Medical Powered Air Purifying Respirators Revenue million Forecast, by Country 2020 & 2033
- Table 40: China Medical Powered Air Purifying Respirators Revenue (million) Forecast, by Application 2020 & 2033
- Table 41: India Medical Powered Air Purifying Respirators Revenue (million) Forecast, by Application 2020 & 2033
- Table 42: Japan Medical Powered Air Purifying Respirators Revenue (million) Forecast, by Application 2020 & 2033
- Table 43: South Korea Medical Powered Air Purifying Respirators Revenue (million) Forecast, by Application 2020 & 2033
- Table 44: ASEAN Medical Powered Air Purifying Respirators Revenue (million) Forecast, by Application 2020 & 2033
- Table 45: Oceania Medical Powered Air Purifying Respirators Revenue (million) Forecast, by Application 2020 & 2033
- Table 46: Rest of Asia Pacific Medical Powered Air Purifying Respirators Revenue (million) Forecast, by Application 2020 & 2033
Frequently Asked Questions
1. What is the projected Compound Annual Growth Rate (CAGR) of the Medical Powered Air Purifying Respirators?
The projected CAGR is approximately XXX%.
2. Which companies are prominent players in the Medical Powered Air Purifying Respirators?
Key companies in the market include 3M, Honeywell, MSA Safety, Allegro Industries, Avon Protection, Dräger, Bullard, Dragerwerk, Kimberly-Clark Corporation, Mine Safety Appliances (MSA) Company, Scott Safety, Avon Protection Systems, Miller Electric, ILC Dover, Lincoln, Sundstrom Safety AB, ESAB, Optrel, Bio-Medical Devices International, Inc., Helmet Integrated Systems Ltd., Tecmen, OTOS, Maxair Systems, RPB Safety, Gentex Corporation.
3. What are the main segments of the Medical Powered Air Purifying Respirators?
The market segments include Application, Type.
4. Can you provide details about the market size?
The market size is estimated to be USD XXX million as of 2022.
5. What are some drivers contributing to market growth?
N/A
6. What are the notable trends driving market growth?
N/A
7. Are there any restraints impacting market growth?
N/A
8. Can you provide examples of recent developments in the market?
N/A
9. What pricing options are available for accessing the report?
Pricing options include single-user, multi-user, and enterprise licenses priced at USD 4250.00, USD 6375.00, and USD 8500.00 respectively.
10. Is the market size provided in terms of value or volume?
The market size is provided in terms of value, measured in million.
11. Are there any specific market keywords associated with the report?
Yes, the market keyword associated with the report is "Medical Powered Air Purifying Respirators," which aids in identifying and referencing the specific market segment covered.
12. How do I determine which pricing option suits my needs best?
The pricing options vary based on user requirements and access needs. Individual users may opt for single-user licenses, while businesses requiring broader access may choose multi-user or enterprise licenses for cost-effective access to the report.
13. Are there any additional resources or data provided in the Medical Powered Air Purifying Respirators report?
While the report offers comprehensive insights, it's advisable to review the specific contents or supplementary materials provided to ascertain if additional resources or data are available.
14. How can I stay updated on further developments or reports in the Medical Powered Air Purifying Respirators?
To stay informed about further developments, trends, and reports in the Medical Powered Air Purifying Respirators, consider subscribing to industry newsletters, following relevant companies and organizations, or regularly checking reputable industry news sources and publications.
Methodology
Step 1 - Identification of Relevant Samples Size from Population Database


Step 2 - Approaches for Defining Global Market Size (Value, Volume* & Price*)

Note*: In applicable scenarios
Step 3 - Data Sources
Primary Research
- Web Analytics
- Survey Reports
- Research Institute
- Latest Research Reports
- Opinion Leaders
Secondary Research
- Annual Reports
- White Paper
- Latest Press Release
- Industry Association
- Paid Database
- Investor Presentations

Step 4 - Data Triangulation
Involves using different sources of information in order to increase the validity of a study
These sources are likely to be stakeholders in a program - participants, other researchers, program staff, other community members, and so on.
Then we put all data in single framework & apply various statistical tools to find out the dynamic on the market.
During the analysis stage, feedback from the stakeholder groups would be compared to determine areas of agreement as well as areas of divergence