

Key Insights
The Membrane Water Treatment Chemicals market is poised for significant expansion, driven by escalating global water stress, rigorous environmental mandates, and the widespread adoption of advanced membrane technologies. Projections indicate a market size of $2.4 billion by 2025, with a projected Compound Annual Growth Rate (CAGR) of 6.1% through 2033. This growth trajectory is underpinned by the increasing demand for safe drinking water worldwide, the critical need for industrial water purification, and a heightened awareness of water quality's impact on public health and ecological balance. Innovations in membrane materials and the development of more efficient, cost-effective chemical solutions are accelerating market growth. Key segments, including antiscalants, biocides, and cleaning agents, are experiencing robust demand due to their essential role in optimizing membrane efficiency and extending operational lifespans. A notable trend is the market's pivot towards sustainable and eco-friendly chemical alternatives, spurred by environmental concerns, fostering the development of bio-based and reduced-toxicity options.
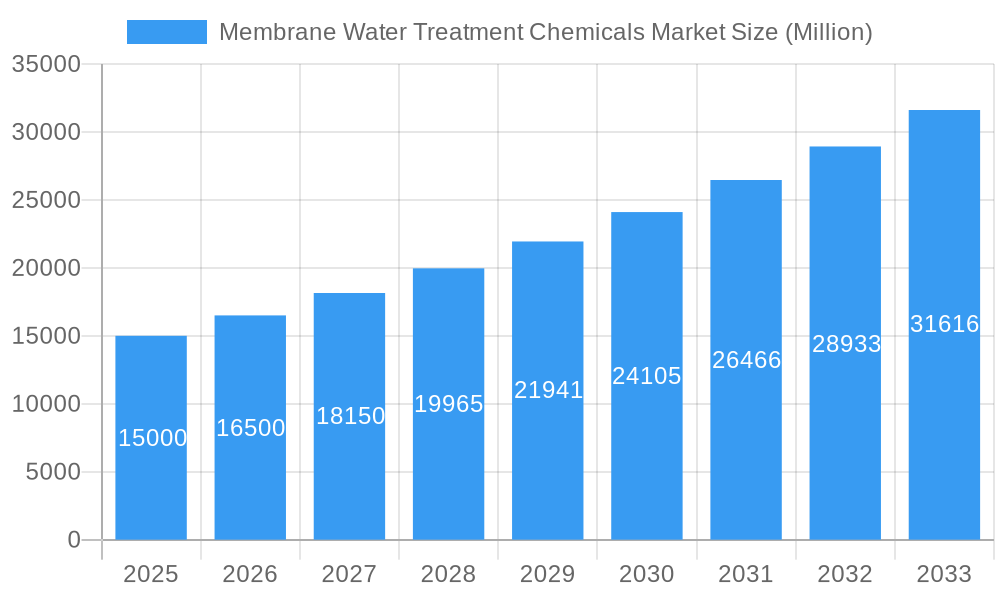
Membrane Water Treatment Chemicals Market Market Size (In Billion)
Geographically, while North America and Europe currently lead market share due to established infrastructure and stringent regulatory frameworks, rapid industrialization and urbanization in Asia-Pacific and emerging economies present substantial future growth opportunities. The competitive arena features established multinational corporations and specialized chemical producers actively pursuing strategic alliances, mergers, acquisitions, and product innovation to enhance market presence and address evolving industry needs. Future market expansion will be shaped by supportive government policies for water conservation, advancements in membrane technology, and the increasing integration of Advanced Oxidation Processes (AOPs) for superior water purification.
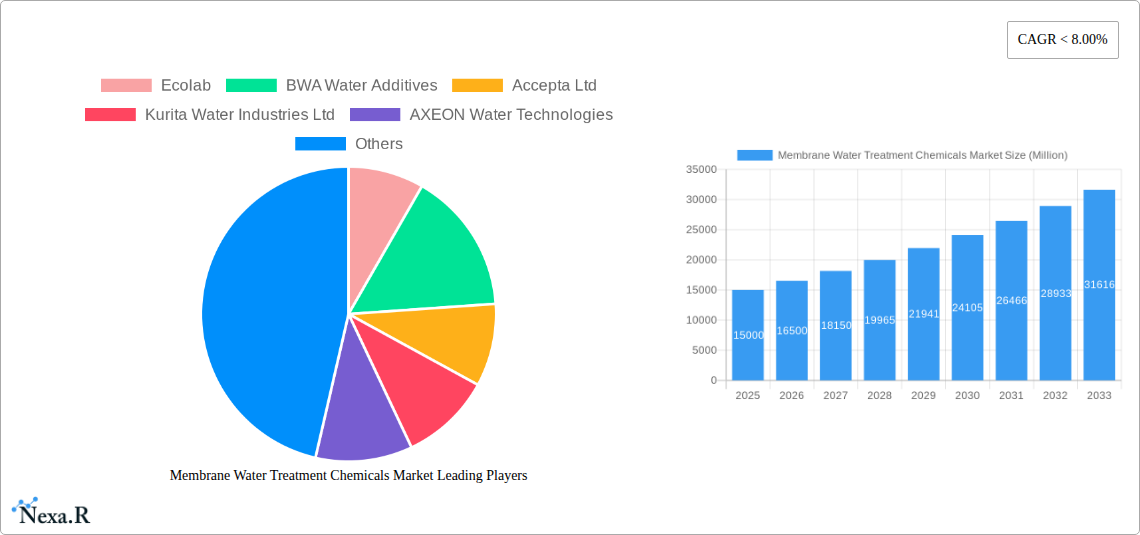
Membrane Water Treatment Chemicals Market Company Market Share
Membrane Water Treatment Chemicals Market: A Comprehensive Report (2019-2033)
This comprehensive report provides an in-depth analysis of the global Membrane Water Treatment Chemicals market, encompassing market dynamics, growth trends, regional insights, competitive landscape, and future outlook. The study period spans from 2019 to 2033, with 2025 serving as the base and estimated year. The report is crucial for industry professionals, investors, and stakeholders seeking a thorough understanding of this vital sector. The parent market is the broader water treatment chemicals market, while the child market focuses specifically on chemicals used in membrane-based water treatment systems. The market size is projected to reach xx Million by 2033.
Membrane Water Treatment Chemicals Market Market Dynamics & Structure
The Membrane Water Treatment Chemicals market is characterized by moderate concentration, with key players holding significant market share. Technological innovation, particularly in advanced oxidation processes and membrane fouling control, is a primary growth driver. Stringent regulatory frameworks concerning water quality and environmental protection further shape market dynamics. Competitive pressures arise from the availability of substitute technologies, like reverse osmosis and ultrafiltration, influencing pricing strategies. End-user demographics, particularly within the municipal and industrial sectors, significantly impact market demand. Mergers and acquisitions (M&A) activities contribute to market consolidation and expansion, with an estimated xx M&A deals recorded between 2019 and 2024, resulting in a market share shift of approximately xx%.
- Market Concentration: Moderately concentrated, with top 5 players holding approximately xx% market share.
- Technological Innovation: Focus on advanced oxidation processes (AOPs), anti-scalants, and biocides drives growth.
- Regulatory Landscape: Stringent environmental regulations drive adoption of advanced treatment technologies.
- Substitute Technologies: Competition from other water treatment methods influences market growth.
- End-user Demographics: Municipal and industrial sectors are key drivers, with growth influenced by population increase and industrial expansion.
- M&A Activity: Consolidation through mergers and acquisitions is a significant trend.
Membrane Water Treatment Chemicals Market Growth Trends & Insights
The Membrane Water Treatment Chemicals market has experienced consistent growth during the historical period (2019-2024), driven by increasing demand for potable water and stringent environmental regulations. The market size expanded from xx Million in 2019 to xx Million in 2024, exhibiting a CAGR of xx%. This growth trajectory is projected to continue, with a forecasted CAGR of xx% during the forecast period (2025-2033), reaching xx Million by 2033. Technological advancements like improved membrane materials and automated chemical dosing systems have significantly influenced adoption rates, while changing consumer behavior towards sustainable water management practices further strengthens market demand. The market penetration rate is estimated at xx% in 2025 and is expected to increase to xx% by 2033.
Dominant Regions, Countries, or Segments in Membrane Water Treatment Chemicals Market
North America currently dominates the Membrane Water Treatment Chemicals market, driven by robust infrastructure investments and stringent water quality standards. Within chemical types, pre-treatment chemicals hold the largest market share (xx%), followed by biological controllers (xx%) and other chemical types (xx%). Among end-user industries, the municipal sector dominates, accounting for approximately xx% of market share, followed by the chemicals (including pulp and paper) and food and beverage processing sectors.
- Key Drivers in North America: Stringent regulations, high infrastructure investment, and increasing industrial activity.
- Municipal Sector Dominance: Large-scale water treatment plants drive significant demand.
- Pre-treatment Chemicals Leadership: Essential for optimal membrane performance.
- Growth Potential in Emerging Markets: Asia-Pacific and the Middle East are showing significant growth potential.
Membrane Water Treatment Chemicals Market Product Landscape
The market showcases a diverse range of products, including pre-treatment chemicals (coagulants, flocculants), biocides (chlorine, ozone), and anti-scalants. Recent innovations focus on environmentally friendly formulations, enhanced efficiency, and improved membrane lifespan. Unique selling propositions center around reduced operational costs, improved water quality, and sustainable practices. Technological advancements are characterized by the development of advanced oxidation processes (AOPs) and intelligent chemical dosing systems for optimized performance.
Key Drivers, Barriers & Challenges in Membrane Water Treatment Chemicals Market
Key Drivers: Increasing water scarcity, stringent environmental regulations, and rising demand for high-quality water in various industries drive market growth. Technological advancements, like AOPs and improved membrane materials, further propel market expansion. Government initiatives promoting water conservation and infrastructure development also contribute significantly.
Key Challenges & Restraints: Fluctuating raw material prices, supply chain disruptions, and stringent regulatory compliance pose challenges. Competitive pressures from alternative water treatment technologies and the high cost of advanced treatment chemicals can also impact market growth. Estimated supply chain disruption costs the industry xx Million annually.
Emerging Opportunities in Membrane Water Treatment Chemicals Market
Emerging opportunities lie in the development of sustainable and eco-friendly chemical formulations, meeting growing environmental concerns. Expansion into untapped markets, particularly in developing economies with increasing water scarcity, presents substantial growth potential. Innovative applications, such as in desalination and wastewater reclamation, offer new avenues for market expansion.
Growth Accelerators in the Membrane Water Treatment Chemicals Market Industry
Technological breakthroughs in AOPs and nanotechnology, leading to more efficient and sustainable chemical formulations, are key growth accelerators. Strategic partnerships between chemical manufacturers and water treatment companies enhance market penetration and innovation. Expansion into new geographic markets, driven by increasing water scarcity and infrastructure development, is another vital growth catalyst.
Key Players Shaping the Membrane Water Treatment Chemicals Market Market
- Ecolab
- BWA Water Additives
- Accepta Ltd
- Kurita Water Industries Ltd
- AXEON Water Technologies
- Evoqua Water Technologies LLC
- BASF SE
- SUEZ
- Kemira
- Chemtrade Logistics Inc
- ChemTreat Inc
- Solenis
- Avista Technologies Inc
- Veolia Water Technologies *List Not Exhaustive
Notable Milestones in Membrane Water Treatment Chemicals Market Sector
- 2021: Ecolab launched a new line of sustainable anti-scalants.
- 2022: Kurita Water Industries acquired a smaller competitor, expanding its market share.
- 2023: Suez introduced an innovative AOP system for improved water treatment efficiency.
- 2024: BASF announced a new partnership to develop environmentally friendly membrane cleaning agents. (Further milestones to be added based on data availability).
In-Depth Membrane Water Treatment Chemicals Market Market Outlook
The Membrane Water Treatment Chemicals market is poised for robust growth over the forecast period, driven by sustained demand from various end-user industries, technological advancements, and supportive government policies. The market is expected to experience considerable expansion into new applications and geographies. Strategic alliances, product innovation, and technological improvements will play crucial roles in shaping the future landscape. The market offers significant opportunities for players focusing on sustainability, efficiency, and cost-effectiveness.
Membrane Water Treatment Chemicals Market Segmentation
-
1. Chemical Type
- 1.1. Pre-treatment
- 1.2. Biological Controllers
- 1.3. Other Chemical Types
-
2. End-user Industry
- 2.1. Food and Beverage Processing
- 2.2. Healthcare
- 2.3. Municipal
- 2.4. Chemicals (Including Pulp and Paper)
- 2.5. Power
- 2.6. Other End-user Industries
Membrane Water Treatment Chemicals Market Segmentation By Geography
-
1. Asia Pacific
- 1.1. China
- 1.2. India
- 1.3. Japan
- 1.4. South Korea
- 1.5. Rest of Asia Pacific
-
2. North America
- 2.1. United States
- 2.2. Canada
- 2.3. Rest of the North America
-
3. Europe
- 3.1. Germany
- 3.2. France
- 3.3. United Kingdom
- 3.4. Italy
- 3.5. Rest of the Europe
-
4. South America
- 4.1. Brazil
- 4.2. Argentina
- 4.3. Rest of South America
- 5. Middle East
-
6. Saudi Arabia
- 6.1. South Africa
- 6.2. Rest of Middle East

Membrane Water Treatment Chemicals Market Regional Market Share
Geographic Coverage of Membrane Water Treatment Chemicals Market
Membrane Water Treatment Chemicals Market REPORT HIGHLIGHTS
| Aspects | Details |
|---|---|
| Study Period | 2020-2034 |
| Base Year | 2025 |
| Estimated Year | 2026 |
| Forecast Period | 2026-2034 |
| Historical Period | 2020-2025 |
| Growth Rate | CAGR of 6.1% from 2020-2034 |
| Segmentation |
|
Table of Contents
- 1. Introduction
- 1.1. Research Scope
- 1.2. Market Segmentation
- 1.3. Research Objective
- 1.4. Definitions and Assumptions
- 2. Executive Summary
- 2.1. Market Snapshot
- 3. Market Dynamics
- 3.1. Market Drivers
- 3.2. Market Restrains
- 3.3. Market Trends
- 3.4. Market Opportunities
- 4. Market Factor Analysis
- 4.1. Porters Five Forces
- 4.1.1. Bargaining Power of Suppliers
- 4.1.2. Bargaining Power of Buyers
- 4.1.3. Threat of New Entrants
- 4.1.4. Threat of Substitutes
- 4.1.5. Competitive Rivalry
- 4.2. PESTEL analysis
- 4.3. BCG Analysis
- 4.3.1. Stars (High Growth, High Market Share)
- 4.3.2. Cash Cows (Low Growth, High Market Share)
- 4.3.3. Question Mark (High Growth, Low Market Share)
- 4.3.4. Dogs (Low Growth, Low Market Share)
- 4.4. Ansoff Matrix Analysis
- 4.5. Supply Chain Analysis
- 4.6. Regulatory Landscape
- 4.7. Current Market Potential and Opportunity Assessment (TAM–SAM–SOM Framework)
- 4.8. NRP Analyst Note
- 4.1. Porters Five Forces
- 5. Market Analysis, Insights and Forecast 2021-2033
- 5.1. Market Analysis, Insights and Forecast - by Chemical Type
- 5.1.1. Pre-treatment
- 5.1.2. Biological Controllers
- 5.1.3. Other Chemical Types
- 5.2. Market Analysis, Insights and Forecast - by End-user Industry
- 5.2.1. Food and Beverage Processing
- 5.2.2. Healthcare
- 5.2.3. Municipal
- 5.2.4. Chemicals (Including Pulp and Paper)
- 5.2.5. Power
- 5.2.6. Other End-user Industries
- 5.3. Market Analysis, Insights and Forecast - by Region
- 5.3.1. Asia Pacific
- 5.3.2. North America
- 5.3.3. Europe
- 5.3.4. South America
- 5.3.5. Middle East
- 5.3.6. Saudi Arabia
- 5.1. Market Analysis, Insights and Forecast - by Chemical Type
- 6. Global Membrane Water Treatment Chemicals Market Analysis, Insights and Forecast, 2021-2033
- 6.1. Market Analysis, Insights and Forecast - by Chemical Type
- 6.1.1. Pre-treatment
- 6.1.2. Biological Controllers
- 6.1.3. Other Chemical Types
- 6.2. Market Analysis, Insights and Forecast - by End-user Industry
- 6.2.1. Food and Beverage Processing
- 6.2.2. Healthcare
- 6.2.3. Municipal
- 6.2.4. Chemicals (Including Pulp and Paper)
- 6.2.5. Power
- 6.2.6. Other End-user Industries
- 6.1. Market Analysis, Insights and Forecast - by Chemical Type
- 7. Asia Pacific Membrane Water Treatment Chemicals Market Analysis, Insights and Forecast, 2020-2032
- 7.1. Market Analysis, Insights and Forecast - by Chemical Type
- 7.1.1. Pre-treatment
- 7.1.2. Biological Controllers
- 7.1.3. Other Chemical Types
- 7.2. Market Analysis, Insights and Forecast - by End-user Industry
- 7.2.1. Food and Beverage Processing
- 7.2.2. Healthcare
- 7.2.3. Municipal
- 7.2.4. Chemicals (Including Pulp and Paper)
- 7.2.5. Power
- 7.2.6. Other End-user Industries
- 7.1. Market Analysis, Insights and Forecast - by Chemical Type
- 8. North America Membrane Water Treatment Chemicals Market Analysis, Insights and Forecast, 2020-2032
- 8.1. Market Analysis, Insights and Forecast - by Chemical Type
- 8.1.1. Pre-treatment
- 8.1.2. Biological Controllers
- 8.1.3. Other Chemical Types
- 8.2. Market Analysis, Insights and Forecast - by End-user Industry
- 8.2.1. Food and Beverage Processing
- 8.2.2. Healthcare
- 8.2.3. Municipal
- 8.2.4. Chemicals (Including Pulp and Paper)
- 8.2.5. Power
- 8.2.6. Other End-user Industries
- 8.1. Market Analysis, Insights and Forecast - by Chemical Type
- 9. Europe Membrane Water Treatment Chemicals Market Analysis, Insights and Forecast, 2020-2032
- 9.1. Market Analysis, Insights and Forecast - by Chemical Type
- 9.1.1. Pre-treatment
- 9.1.2. Biological Controllers
- 9.1.3. Other Chemical Types
- 9.2. Market Analysis, Insights and Forecast - by End-user Industry
- 9.2.1. Food and Beverage Processing
- 9.2.2. Healthcare
- 9.2.3. Municipal
- 9.2.4. Chemicals (Including Pulp and Paper)
- 9.2.5. Power
- 9.2.6. Other End-user Industries
- 9.1. Market Analysis, Insights and Forecast - by Chemical Type
- 10. South America Membrane Water Treatment Chemicals Market Analysis, Insights and Forecast, 2020-2032
- 10.1. Market Analysis, Insights and Forecast - by Chemical Type
- 10.1.1. Pre-treatment
- 10.1.2. Biological Controllers
- 10.1.3. Other Chemical Types
- 10.2. Market Analysis, Insights and Forecast - by End-user Industry
- 10.2.1. Food and Beverage Processing
- 10.2.2. Healthcare
- 10.2.3. Municipal
- 10.2.4. Chemicals (Including Pulp and Paper)
- 10.2.5. Power
- 10.2.6. Other End-user Industries
- 10.1. Market Analysis, Insights and Forecast - by Chemical Type
- 11. Middle East Membrane Water Treatment Chemicals Market Analysis, Insights and Forecast, 2020-2032
- 11.1. Market Analysis, Insights and Forecast - by Chemical Type
- 11.1.1. Pre-treatment
- 11.1.2. Biological Controllers
- 11.1.3. Other Chemical Types
- 11.2. Market Analysis, Insights and Forecast - by End-user Industry
- 11.2.1. Food and Beverage Processing
- 11.2.2. Healthcare
- 11.2.3. Municipal
- 11.2.4. Chemicals (Including Pulp and Paper)
- 11.2.5. Power
- 11.2.6. Other End-user Industries
- 11.1. Market Analysis, Insights and Forecast - by Chemical Type
- 12. Saudi Arabia Membrane Water Treatment Chemicals Market Analysis, Insights and Forecast, 2020-2032
- 12.1. Market Analysis, Insights and Forecast - by Chemical Type
- 12.1.1. Pre-treatment
- 12.1.2. Biological Controllers
- 12.1.3. Other Chemical Types
- 12.2. Market Analysis, Insights and Forecast - by End-user Industry
- 12.2.1. Food and Beverage Processing
- 12.2.2. Healthcare
- 12.2.3. Municipal
- 12.2.4. Chemicals (Including Pulp and Paper)
- 12.2.5. Power
- 12.2.6. Other End-user Industries
- 12.1. Market Analysis, Insights and Forecast - by Chemical Type
- 13. Competitive Analysis
- 13.1. Company Profiles
- 13.1.1 Ecolab
- 13.1.1.1. Company Overview
- 13.1.1.2. Products
- 13.1.1.3. Company Financials
- 13.1.1.4. SWOT Analysis
- 13.1.2 BWA Water Additives
- 13.1.2.1. Company Overview
- 13.1.2.2. Products
- 13.1.2.3. Company Financials
- 13.1.2.4. SWOT Analysis
- 13.1.3 Accepta Ltd
- 13.1.3.1. Company Overview
- 13.1.3.2. Products
- 13.1.3.3. Company Financials
- 13.1.3.4. SWOT Analysis
- 13.1.4 Kurita Water Industries Ltd
- 13.1.4.1. Company Overview
- 13.1.4.2. Products
- 13.1.4.3. Company Financials
- 13.1.4.4. SWOT Analysis
- 13.1.5 AXEON Water Technologies
- 13.1.5.1. Company Overview
- 13.1.5.2. Products
- 13.1.5.3. Company Financials
- 13.1.5.4. SWOT Analysis
- 13.1.6 Evoqua Water Technologies LLC
- 13.1.6.1. Company Overview
- 13.1.6.2. Products
- 13.1.6.3. Company Financials
- 13.1.6.4. SWOT Analysis
- 13.1.7 BASF SE
- 13.1.7.1. Company Overview
- 13.1.7.2. Products
- 13.1.7.3. Company Financials
- 13.1.7.4. SWOT Analysis
- 13.1.8 SUEZ
- 13.1.8.1. Company Overview
- 13.1.8.2. Products
- 13.1.8.3. Company Financials
- 13.1.8.4. SWOT Analysis
- 13.1.9 Kemira
- 13.1.9.1. Company Overview
- 13.1.9.2. Products
- 13.1.9.3. Company Financials
- 13.1.9.4. SWOT Analysis
- 13.1.10 Chemtrade Logistics Inc
- 13.1.10.1. Company Overview
- 13.1.10.2. Products
- 13.1.10.3. Company Financials
- 13.1.10.4. SWOT Analysis
- 13.1.11 ChemTreat Inc
- 13.1.11.1. Company Overview
- 13.1.11.2. Products
- 13.1.11.3. Company Financials
- 13.1.11.4. SWOT Analysis
- 13.1.12 Solenis
- 13.1.12.1. Company Overview
- 13.1.12.2. Products
- 13.1.12.3. Company Financials
- 13.1.12.4. SWOT Analysis
- 13.1.13 Avista Technologies Inc
- 13.1.13.1. Company Overview
- 13.1.13.2. Products
- 13.1.13.3. Company Financials
- 13.1.13.4. SWOT Analysis
- 13.1.14 Veolia Water Technologies*List Not Exhaustive
- 13.1.14.1. Company Overview
- 13.1.14.2. Products
- 13.1.14.3. Company Financials
- 13.1.14.4. SWOT Analysis
- 13.1.1 Ecolab
- 13.2. Market Entropy
- 13.2.1 Company's Key Areas Served
- 13.2.2 Recent Developments
- 13.3. Company Market Share Analysis 2025
- 13.3.1 Top 5 Companies Market Share Analysis
- 13.3.2 Top 3 Companies Market Share Analysis
- 13.4. List of Potential Customers
- 14. Research Methodology
List of Figures
- Figure 1: Global Membrane Water Treatment Chemicals Market Revenue Breakdown (billion, %) by Region 2025 & 2033
- Figure 2: Asia Pacific Membrane Water Treatment Chemicals Market Revenue (billion), by Chemical Type 2025 & 2033
- Figure 3: Asia Pacific Membrane Water Treatment Chemicals Market Revenue Share (%), by Chemical Type 2025 & 2033
- Figure 4: Asia Pacific Membrane Water Treatment Chemicals Market Revenue (billion), by End-user Industry 2025 & 2033
- Figure 5: Asia Pacific Membrane Water Treatment Chemicals Market Revenue Share (%), by End-user Industry 2025 & 2033
- Figure 6: Asia Pacific Membrane Water Treatment Chemicals Market Revenue (billion), by Country 2025 & 2033
- Figure 7: Asia Pacific Membrane Water Treatment Chemicals Market Revenue Share (%), by Country 2025 & 2033
- Figure 8: North America Membrane Water Treatment Chemicals Market Revenue (billion), by Chemical Type 2025 & 2033
- Figure 9: North America Membrane Water Treatment Chemicals Market Revenue Share (%), by Chemical Type 2025 & 2033
- Figure 10: North America Membrane Water Treatment Chemicals Market Revenue (billion), by End-user Industry 2025 & 2033
- Figure 11: North America Membrane Water Treatment Chemicals Market Revenue Share (%), by End-user Industry 2025 & 2033
- Figure 12: North America Membrane Water Treatment Chemicals Market Revenue (billion), by Country 2025 & 2033
- Figure 13: North America Membrane Water Treatment Chemicals Market Revenue Share (%), by Country 2025 & 2033
- Figure 14: Europe Membrane Water Treatment Chemicals Market Revenue (billion), by Chemical Type 2025 & 2033
- Figure 15: Europe Membrane Water Treatment Chemicals Market Revenue Share (%), by Chemical Type 2025 & 2033
- Figure 16: Europe Membrane Water Treatment Chemicals Market Revenue (billion), by End-user Industry 2025 & 2033
- Figure 17: Europe Membrane Water Treatment Chemicals Market Revenue Share (%), by End-user Industry 2025 & 2033
- Figure 18: Europe Membrane Water Treatment Chemicals Market Revenue (billion), by Country 2025 & 2033
- Figure 19: Europe Membrane Water Treatment Chemicals Market Revenue Share (%), by Country 2025 & 2033
- Figure 20: South America Membrane Water Treatment Chemicals Market Revenue (billion), by Chemical Type 2025 & 2033
- Figure 21: South America Membrane Water Treatment Chemicals Market Revenue Share (%), by Chemical Type 2025 & 2033
- Figure 22: South America Membrane Water Treatment Chemicals Market Revenue (billion), by End-user Industry 2025 & 2033
- Figure 23: South America Membrane Water Treatment Chemicals Market Revenue Share (%), by End-user Industry 2025 & 2033
- Figure 24: South America Membrane Water Treatment Chemicals Market Revenue (billion), by Country 2025 & 2033
- Figure 25: South America Membrane Water Treatment Chemicals Market Revenue Share (%), by Country 2025 & 2033
- Figure 26: Middle East Membrane Water Treatment Chemicals Market Revenue (billion), by Chemical Type 2025 & 2033
- Figure 27: Middle East Membrane Water Treatment Chemicals Market Revenue Share (%), by Chemical Type 2025 & 2033
- Figure 28: Middle East Membrane Water Treatment Chemicals Market Revenue (billion), by End-user Industry 2025 & 2033
- Figure 29: Middle East Membrane Water Treatment Chemicals Market Revenue Share (%), by End-user Industry 2025 & 2033
- Figure 30: Middle East Membrane Water Treatment Chemicals Market Revenue (billion), by Country 2025 & 2033
- Figure 31: Middle East Membrane Water Treatment Chemicals Market Revenue Share (%), by Country 2025 & 2033
- Figure 32: Saudi Arabia Membrane Water Treatment Chemicals Market Revenue (billion), by Chemical Type 2025 & 2033
- Figure 33: Saudi Arabia Membrane Water Treatment Chemicals Market Revenue Share (%), by Chemical Type 2025 & 2033
- Figure 34: Saudi Arabia Membrane Water Treatment Chemicals Market Revenue (billion), by End-user Industry 2025 & 2033
- Figure 35: Saudi Arabia Membrane Water Treatment Chemicals Market Revenue Share (%), by End-user Industry 2025 & 2033
- Figure 36: Saudi Arabia Membrane Water Treatment Chemicals Market Revenue (billion), by Country 2025 & 2033
- Figure 37: Saudi Arabia Membrane Water Treatment Chemicals Market Revenue Share (%), by Country 2025 & 2033
List of Tables
- Table 1: Global Membrane Water Treatment Chemicals Market Revenue billion Forecast, by Chemical Type 2020 & 2033
- Table 2: Global Membrane Water Treatment Chemicals Market Revenue billion Forecast, by End-user Industry 2020 & 2033
- Table 3: Global Membrane Water Treatment Chemicals Market Revenue billion Forecast, by Region 2020 & 2033
- Table 4: Global Membrane Water Treatment Chemicals Market Revenue billion Forecast, by Chemical Type 2020 & 2033
- Table 5: Global Membrane Water Treatment Chemicals Market Revenue billion Forecast, by End-user Industry 2020 & 2033
- Table 6: Global Membrane Water Treatment Chemicals Market Revenue billion Forecast, by Country 2020 & 2033
- Table 7: China Membrane Water Treatment Chemicals Market Revenue (billion) Forecast, by Application 2020 & 2033
- Table 8: India Membrane Water Treatment Chemicals Market Revenue (billion) Forecast, by Application 2020 & 2033
- Table 9: Japan Membrane Water Treatment Chemicals Market Revenue (billion) Forecast, by Application 2020 & 2033
- Table 10: South Korea Membrane Water Treatment Chemicals Market Revenue (billion) Forecast, by Application 2020 & 2033
- Table 11: Rest of Asia Pacific Membrane Water Treatment Chemicals Market Revenue (billion) Forecast, by Application 2020 & 2033
- Table 12: Global Membrane Water Treatment Chemicals Market Revenue billion Forecast, by Chemical Type 2020 & 2033
- Table 13: Global Membrane Water Treatment Chemicals Market Revenue billion Forecast, by End-user Industry 2020 & 2033
- Table 14: Global Membrane Water Treatment Chemicals Market Revenue billion Forecast, by Country 2020 & 2033
- Table 15: United States Membrane Water Treatment Chemicals Market Revenue (billion) Forecast, by Application 2020 & 2033
- Table 16: Canada Membrane Water Treatment Chemicals Market Revenue (billion) Forecast, by Application 2020 & 2033
- Table 17: Rest of the North America Membrane Water Treatment Chemicals Market Revenue (billion) Forecast, by Application 2020 & 2033
- Table 18: Global Membrane Water Treatment Chemicals Market Revenue billion Forecast, by Chemical Type 2020 & 2033
- Table 19: Global Membrane Water Treatment Chemicals Market Revenue billion Forecast, by End-user Industry 2020 & 2033
- Table 20: Global Membrane Water Treatment Chemicals Market Revenue billion Forecast, by Country 2020 & 2033
- Table 21: Germany Membrane Water Treatment Chemicals Market Revenue (billion) Forecast, by Application 2020 & 2033
- Table 22: France Membrane Water Treatment Chemicals Market Revenue (billion) Forecast, by Application 2020 & 2033
- Table 23: United Kingdom Membrane Water Treatment Chemicals Market Revenue (billion) Forecast, by Application 2020 & 2033
- Table 24: Italy Membrane Water Treatment Chemicals Market Revenue (billion) Forecast, by Application 2020 & 2033
- Table 25: Rest of the Europe Membrane Water Treatment Chemicals Market Revenue (billion) Forecast, by Application 2020 & 2033
- Table 26: Global Membrane Water Treatment Chemicals Market Revenue billion Forecast, by Chemical Type 2020 & 2033
- Table 27: Global Membrane Water Treatment Chemicals Market Revenue billion Forecast, by End-user Industry 2020 & 2033
- Table 28: Global Membrane Water Treatment Chemicals Market Revenue billion Forecast, by Country 2020 & 2033
- Table 29: Brazil Membrane Water Treatment Chemicals Market Revenue (billion) Forecast, by Application 2020 & 2033
- Table 30: Argentina Membrane Water Treatment Chemicals Market Revenue (billion) Forecast, by Application 2020 & 2033
- Table 31: Rest of South America Membrane Water Treatment Chemicals Market Revenue (billion) Forecast, by Application 2020 & 2033
- Table 32: Global Membrane Water Treatment Chemicals Market Revenue billion Forecast, by Chemical Type 2020 & 2033
- Table 33: Global Membrane Water Treatment Chemicals Market Revenue billion Forecast, by End-user Industry 2020 & 2033
- Table 34: Global Membrane Water Treatment Chemicals Market Revenue billion Forecast, by Country 2020 & 2033
- Table 35: Global Membrane Water Treatment Chemicals Market Revenue billion Forecast, by Chemical Type 2020 & 2033
- Table 36: Global Membrane Water Treatment Chemicals Market Revenue billion Forecast, by End-user Industry 2020 & 2033
- Table 37: Global Membrane Water Treatment Chemicals Market Revenue billion Forecast, by Country 2020 & 2033
- Table 38: South Africa Membrane Water Treatment Chemicals Market Revenue (billion) Forecast, by Application 2020 & 2033
- Table 39: Rest of Middle East Membrane Water Treatment Chemicals Market Revenue (billion) Forecast, by Application 2020 & 2033
Frequently Asked Questions
1. What is the projected Compound Annual Growth Rate (CAGR) of the Membrane Water Treatment Chemicals Market?
The projected CAGR is approximately 6.1%.
2. Which companies are prominent players in the Membrane Water Treatment Chemicals Market?
Key companies in the market include Ecolab, BWA Water Additives, Accepta Ltd, Kurita Water Industries Ltd, AXEON Water Technologies, Evoqua Water Technologies LLC, BASF SE, SUEZ, Kemira, Chemtrade Logistics Inc, ChemTreat Inc, Solenis, Avista Technologies Inc, Veolia Water Technologies*List Not Exhaustive.
3. What are the main segments of the Membrane Water Treatment Chemicals Market?
The market segments include Chemical Type, End-user Industry.
4. Can you provide details about the market size?
The market size is estimated to be USD 2.4 billion as of 2022.
5. What are some drivers contributing to market growth?
; Emergence of Smart Water Grid and Related Solutions; Stringent Regulations to Control Produced and Wastewater Disposal; Increasing Demand from the Municipal and Manufacturing Sector.
6. What are the notable trends driving market growth?
Pre-treatment chemicals to dominate the Market.
7. Are there any restraints impacting market growth?
; Low Adoption in Developing Countries; Other Restraints.
8. Can you provide examples of recent developments in the market?
N/A
9. What pricing options are available for accessing the report?
Pricing options include single-user, multi-user, and enterprise licenses priced at USD 4750, USD 5250, and USD 8750 respectively.
10. Is the market size provided in terms of value or volume?
The market size is provided in terms of value, measured in billion.
11. Are there any specific market keywords associated with the report?
Yes, the market keyword associated with the report is "Membrane Water Treatment Chemicals Market," which aids in identifying and referencing the specific market segment covered.
12. How do I determine which pricing option suits my needs best?
The pricing options vary based on user requirements and access needs. Individual users may opt for single-user licenses, while businesses requiring broader access may choose multi-user or enterprise licenses for cost-effective access to the report.
13. Are there any additional resources or data provided in the Membrane Water Treatment Chemicals Market report?
While the report offers comprehensive insights, it's advisable to review the specific contents or supplementary materials provided to ascertain if additional resources or data are available.
14. How can I stay updated on further developments or reports in the Membrane Water Treatment Chemicals Market?
To stay informed about further developments, trends, and reports in the Membrane Water Treatment Chemicals Market, consider subscribing to industry newsletters, following relevant companies and organizations, or regularly checking reputable industry news sources and publications.
Methodology
Step 1 - Identification of Relevant Samples Size from Population Database


Step 2 - Approaches for Defining Global Market Size (Value, Volume* & Price*)

Note*: In applicable scenarios
Step 3 - Data Sources
Primary Research
- Web Analytics
- Survey Reports
- Research Institute
- Latest Research Reports
- Opinion Leaders
Secondary Research
- Annual Reports
- White Paper
- Latest Press Release
- Industry Association
- Paid Database
- Investor Presentations

Step 4 - Data Triangulation
Involves using different sources of information in order to increase the validity of a study
These sources are likely to be stakeholders in a program - participants, other researchers, program staff, other community members, and so on.
Then we put all data in single framework & apply various statistical tools to find out the dynamic on the market.
During the analysis stage, feedback from the stakeholder groups would be compared to determine areas of agreement as well as areas of divergence