

Key Insights
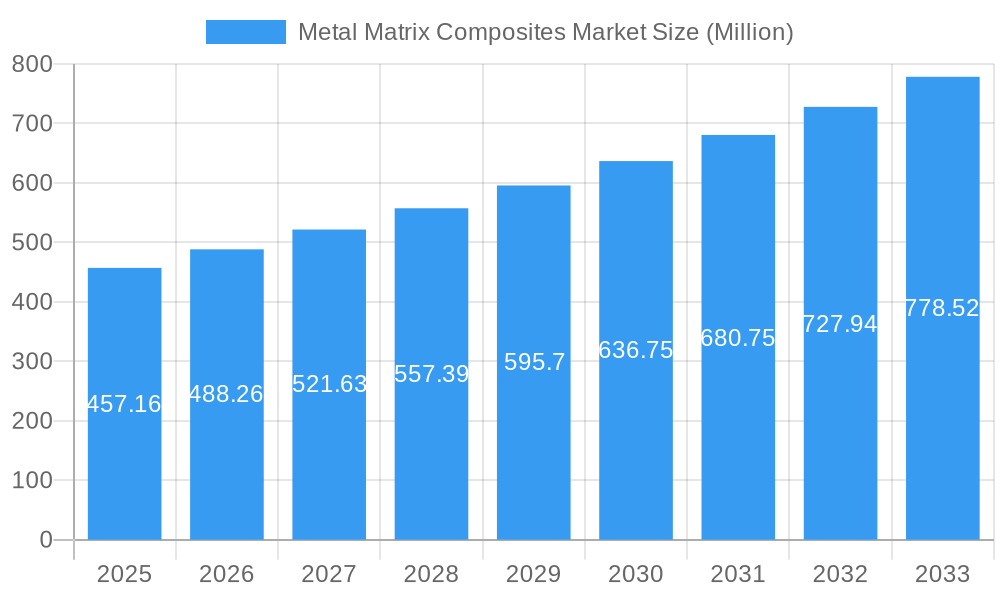
The Metal Matrix Composites (MMC) market is poised for robust growth, projected to reach \$457.16 million in 2025 and exhibiting a Compound Annual Growth Rate (CAGR) of 6.49% from 2025 to 2033. This expansion is driven by several key factors. The increasing demand for lightweight yet high-strength materials across diverse industries like aerospace, automotive, and electronics is a significant catalyst. Advancements in manufacturing processes, leading to improved material properties and cost-effectiveness, further fuel market growth. The rising adoption of MMCs in high-performance applications, such as aircraft components and electric vehicle parts, is another major driver. Furthermore, ongoing research and development efforts focused on enhancing the performance characteristics of MMCs, including thermal conductivity, fatigue resistance, and corrosion resistance, are expected to contribute to market expansion throughout the forecast period.
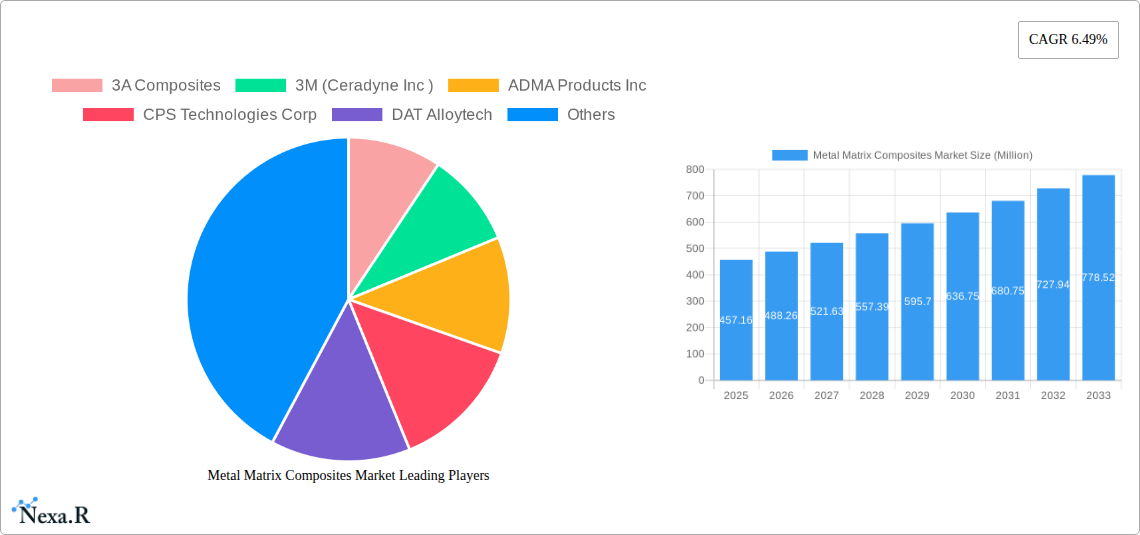
Metal Matrix Composites Market Market Size (In Million)
Despite the positive outlook, certain challenges restrain market growth. The relatively high cost of MMCs compared to traditional materials can limit widespread adoption, particularly in price-sensitive sectors. Additionally, complexities in manufacturing and processing MMCs, which often require specialized equipment and expertise, pose a hurdle. However, continuous innovation and economies of scale are expected to gradually mitigate these constraints. The market is segmented by material type (e.g., aluminum, magnesium, titanium), application (aerospace, automotive, etc.), and region. Key players like 3A Composites, 3M, and others are actively investing in R&D and strategic partnerships to strengthen their market positions and cater to the growing demand for advanced MMC solutions. The competitive landscape is characterized by both established players and emerging companies vying for market share through product innovation and geographic expansion.
Metal Matrix Composites Market Company Market Share
Metal Matrix Composites Market Report: A Comprehensive Analysis (2019-2033)
This comprehensive report provides an in-depth analysis of the Metal Matrix Composites (MMC) market, encompassing its parent market (advanced materials) and child markets (aerospace, automotive, etc.), offering valuable insights for industry professionals, investors, and strategic decision-makers. The study period covers 2019-2033, with 2025 as the base and estimated year. The report projects a market size of xx Million by 2033.
Metal Matrix Composites Market Dynamics & Structure
This section analyzes the competitive landscape, technological advancements, regulatory influences, and market trends within the Metal Matrix Composites market. The market is characterized by a moderately concentrated structure, with key players holding significant market share. However, the emergence of innovative materials and technologies is fostering competition.
- Market Concentration: The top 5 players account for approximately xx% of the global market share in 2025 (Estimated).
- Technological Innovation: Ongoing R&D in areas like ceramic matrix composites and functionally graded materials are driving market growth. Innovation barriers include high R&D costs and complex manufacturing processes.
- Regulatory Landscape: Government regulations concerning material safety and environmental impact influence material selection and manufacturing processes.
- Competitive Substitutes: Polymer matrix composites and other advanced materials pose competitive pressure, demanding continuous innovation in MMC technology.
- End-User Demographics: The primary end-users are the aerospace, automotive, and energy sectors, driving demand for lightweight, high-strength materials.
- M&A Activity: The MMC market has witnessed a moderate level of mergers and acquisitions, with xx major deals recorded between 2019 and 2024. Examples include the acquisition of Mi-Tech Tungsten Metals by Plansee Group in 2022, highlighting strategic expansion efforts.
Metal Matrix Composites Market Growth Trends & Insights
The Metal Matrix Composites market experienced significant growth between 2019 and 2024, driven by increasing demand from various industries. This trend is expected to continue, with a projected Compound Annual Growth Rate (CAGR) of xx% during the forecast period (2025-2033). Market penetration is expected to increase from xx% in 2025 to xx% in 2033. Technological advancements, such as the development of advanced manufacturing techniques like additive manufacturing, are further accelerating market growth. Consumer behavior shifts towards lightweight and high-performance products fuel this demand.
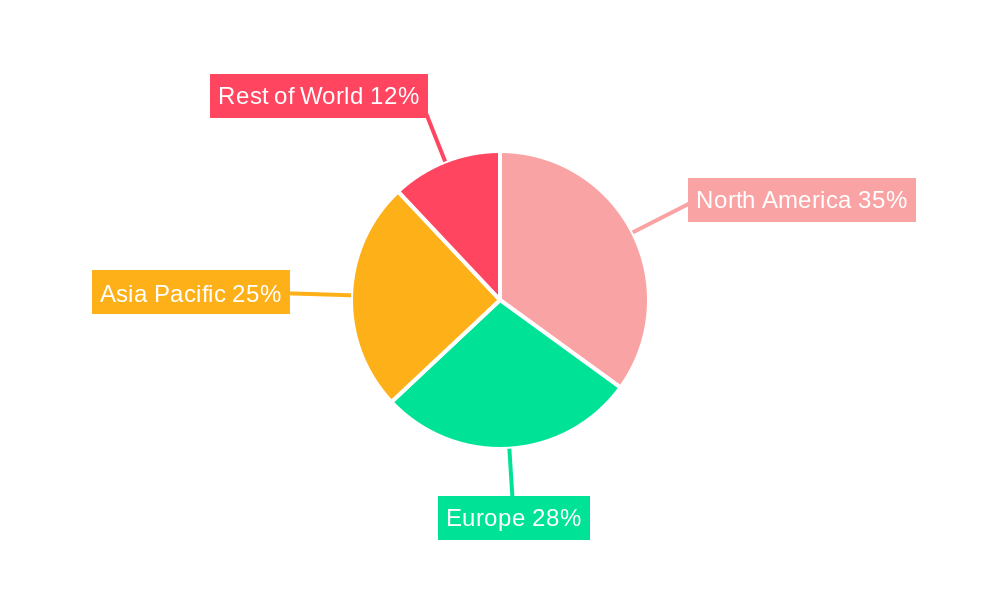
Dominant Regions, Countries, or Segments in Metal Matrix Composites Market
North America currently holds the largest market share, driven by significant investments in aerospace and defense industries. However, Asia Pacific is projected to witness the fastest growth rate over the forecast period due to rapid industrialization and increasing infrastructure development.
- North America: Strong aerospace and defense industries coupled with favorable government policies contribute to its dominance.
- Europe: Mature markets with a focus on sustainable manufacturing and lightweighting initiatives.
- Asia Pacific: Rapid industrialization and infrastructural development fuel high growth potential.
- Rest of the World: Emerging markets with significant growth opportunities driven by increasing adoption across diverse sectors.
Metal Matrix Composites Market Product Landscape
The Metal Matrix Composites market offers a diverse range of products, including aluminum matrix composites (AMCs), titanium matrix composites (TMCs), and others. Ongoing research focuses on enhancing mechanical properties, improving wear resistance, and expanding applications. The unique selling propositions include high strength-to-weight ratio, improved thermal conductivity, and superior fatigue resistance compared to conventional materials. Advancements like tailored microstructures and advanced surface treatments contribute to product differentiation and enhanced performance.
Key Drivers, Barriers & Challenges in Metal Matrix Composites Market
Key Drivers:
- Growing demand from the aerospace and automotive industries for lightweight materials.
- Increasing adoption in energy sector applications (wind turbines, etc.).
- Technological advancements in manufacturing processes.
Challenges & Restraints:
- High manufacturing costs compared to conventional materials.
- Complex production processes requiring specialized expertise and equipment.
- Supply chain disruptions impacting raw material availability and costs.
Emerging Opportunities in Metal Matrix Composites Market
- Untapped potential in emerging markets like India and Southeast Asia.
- Novel applications in biomedical and electronics industries.
- Development of sustainable and recyclable MMCs to address environmental concerns.
Growth Accelerators in the Metal Matrix Composites Market Industry
Strategic partnerships and collaborations among MMC manufacturers, research institutions, and end-users are driving innovation and accelerating market growth. Technological advancements, including the application of AI and machine learning in material design and manufacturing, unlock further opportunities. Market expansion strategies focusing on emerging economies and application diversification are also contributing significantly to market expansion.
Key Players Shaping the Metal Matrix Composites Market Market
- 3A Composites
- 3M (Ceradyne Inc)
- ADMA Products Inc
- CPS Technologies Corp
- DAT Alloytech
- Denka Company Limited
- GKN Sinter Metals Engineering GmbH
- Hitachi Metals Ltd
- Materion Corporation
- MTC Powder Solutions AB
- Plansee Group
- Sumitomo Electric Industries Ltd
- Thermal Transfer Composites LLC
- TISICS Ltd
- List Not Exhaustive
Notable Milestones in Metal Matrix Composites Market Sector
- January 2022: Plansee Group acquired Mi-Tech Tungsten Metals, expanding its North American market position.
- March 2021: Alvant and 3M formed a strategic partnership to advance metal matrix composite technology.
In-Depth Metal Matrix Composites Market Market Outlook
The future of the Metal Matrix Composites market is promising, driven by sustained demand from key industries and technological advancements. Strategic investments in R&D, expansion into new markets, and development of sustainable materials will shape the industry's trajectory. The market's long-term growth potential is substantial, presenting attractive opportunities for businesses willing to embrace innovation and adapt to evolving market dynamics.
Metal Matrix Composites Market Segmentation
-
1. Type
- 1.1. Nickel
- 1.2. Aluminium
- 1.3. Refractory
- 1.4. Other Types
-
2. Fillers
- 2.1. Silicon Carbide
- 2.2. Aluminum Oxide
- 2.3. Titanium Carbide
- 2.4. Other Fillers
-
3. End-user Industry
- 3.1. Automotive and Locomotive
- 3.2. Electrical and Electronics
- 3.3. Aerospace and Defense
- 3.4. Industrial
- 3.5. Other End-user Industries
Metal Matrix Composites Market Segmentation By Geography
-
1. Asia Pacific
- 1.1. China
- 1.2. India
- 1.3. Japan
- 1.4. South Korea
- 1.5. Rest of Asia Pacific
-
2. North America
- 2.1. United States
- 2.2. Canada
- 2.3. Mexico
-
3. Europe
- 3.1. Germany
- 3.2. United Kingdom
- 3.3. Italy
- 3.4. France
- 3.5. Spain
- 3.6. Rest of Europe
-
4. South America
- 4.1. Brazil
- 4.2. Argentina
- 4.3. Rest of South America
-
5. Middle East and Africa
- 5.1. Saudi Arabia
- 5.2. South Africa
- 5.3. Rest of Middle East and Africa
Metal Matrix Composites Market Regional Market Share
Geographic Coverage of Metal Matrix Composites Market
Metal Matrix Composites Market REPORT HIGHLIGHTS
| Aspects | Details |
|---|---|
| Study Period | 2020-2034 |
| Base Year | 2025 |
| Estimated Year | 2026 |
| Forecast Period | 2026-2034 |
| Historical Period | 2020-2025 |
| Growth Rate | CAGR of 6.49% from 2020-2034 |
| Segmentation |
|
Table of Contents
- 1. Introduction
- 1.1. Research Scope
- 1.2. Market Segmentation
- 1.3. Research Methodology
- 1.4. Definitions and Assumptions
- 2. Executive Summary
- 2.1. Introduction
- 3. Market Dynamics
- 3.1. Introduction
- 3.2. Market Drivers
- 3.2.1. Increasing Demand for Lightweight Materials in Aerospace and Defense Industry; Superior Properties of Metal Matrix Composites over Metals
- 3.3. Market Restrains
- 3.3.1. Increasing Demand for Lightweight Materials in Aerospace and Defense Industry; Superior Properties of Metal Matrix Composites over Metals
- 3.4. Market Trends
- 3.4.1. Electrical and Electronics Segment to Register Fastest Growth
- 4. Market Factor Analysis
- 4.1. Porters Five Forces
- 4.2. Supply/Value Chain
- 4.3. PESTEL analysis
- 4.4. Market Entropy
- 4.5. Patent/Trademark Analysis
- 5. Global Metal Matrix Composites Market Analysis, Insights and Forecast, 2020-2032
- 5.1. Market Analysis, Insights and Forecast - by Type
- 5.1.1. Nickel
- 5.1.2. Aluminium
- 5.1.3. Refractory
- 5.1.4. Other Types
- 5.2. Market Analysis, Insights and Forecast - by Fillers
- 5.2.1. Silicon Carbide
- 5.2.2. Aluminum Oxide
- 5.2.3. Titanium Carbide
- 5.2.4. Other Fillers
- 5.3. Market Analysis, Insights and Forecast - by End-user Industry
- 5.3.1. Automotive and Locomotive
- 5.3.2. Electrical and Electronics
- 5.3.3. Aerospace and Defense
- 5.3.4. Industrial
- 5.3.5. Other End-user Industries
- 5.4. Market Analysis, Insights and Forecast - by Region
- 5.4.1. Asia Pacific
- 5.4.2. North America
- 5.4.3. Europe
- 5.4.4. South America
- 5.4.5. Middle East and Africa
- 5.1. Market Analysis, Insights and Forecast - by Type
- 6. Asia Pacific Metal Matrix Composites Market Analysis, Insights and Forecast, 2020-2032
- 6.1. Market Analysis, Insights and Forecast - by Type
- 6.1.1. Nickel
- 6.1.2. Aluminium
- 6.1.3. Refractory
- 6.1.4. Other Types
- 6.2. Market Analysis, Insights and Forecast - by Fillers
- 6.2.1. Silicon Carbide
- 6.2.2. Aluminum Oxide
- 6.2.3. Titanium Carbide
- 6.2.4. Other Fillers
- 6.3. Market Analysis, Insights and Forecast - by End-user Industry
- 6.3.1. Automotive and Locomotive
- 6.3.2. Electrical and Electronics
- 6.3.3. Aerospace and Defense
- 6.3.4. Industrial
- 6.3.5. Other End-user Industries
- 6.1. Market Analysis, Insights and Forecast - by Type
- 7. North America Metal Matrix Composites Market Analysis, Insights and Forecast, 2020-2032
- 7.1. Market Analysis, Insights and Forecast - by Type
- 7.1.1. Nickel
- 7.1.2. Aluminium
- 7.1.3. Refractory
- 7.1.4. Other Types
- 7.2. Market Analysis, Insights and Forecast - by Fillers
- 7.2.1. Silicon Carbide
- 7.2.2. Aluminum Oxide
- 7.2.3. Titanium Carbide
- 7.2.4. Other Fillers
- 7.3. Market Analysis, Insights and Forecast - by End-user Industry
- 7.3.1. Automotive and Locomotive
- 7.3.2. Electrical and Electronics
- 7.3.3. Aerospace and Defense
- 7.3.4. Industrial
- 7.3.5. Other End-user Industries
- 7.1. Market Analysis, Insights and Forecast - by Type
- 8. Europe Metal Matrix Composites Market Analysis, Insights and Forecast, 2020-2032
- 8.1. Market Analysis, Insights and Forecast - by Type
- 8.1.1. Nickel
- 8.1.2. Aluminium
- 8.1.3. Refractory
- 8.1.4. Other Types
- 8.2. Market Analysis, Insights and Forecast - by Fillers
- 8.2.1. Silicon Carbide
- 8.2.2. Aluminum Oxide
- 8.2.3. Titanium Carbide
- 8.2.4. Other Fillers
- 8.3. Market Analysis, Insights and Forecast - by End-user Industry
- 8.3.1. Automotive and Locomotive
- 8.3.2. Electrical and Electronics
- 8.3.3. Aerospace and Defense
- 8.3.4. Industrial
- 8.3.5. Other End-user Industries
- 8.1. Market Analysis, Insights and Forecast - by Type
- 9. South America Metal Matrix Composites Market Analysis, Insights and Forecast, 2020-2032
- 9.1. Market Analysis, Insights and Forecast - by Type
- 9.1.1. Nickel
- 9.1.2. Aluminium
- 9.1.3. Refractory
- 9.1.4. Other Types
- 9.2. Market Analysis, Insights and Forecast - by Fillers
- 9.2.1. Silicon Carbide
- 9.2.2. Aluminum Oxide
- 9.2.3. Titanium Carbide
- 9.2.4. Other Fillers
- 9.3. Market Analysis, Insights and Forecast - by End-user Industry
- 9.3.1. Automotive and Locomotive
- 9.3.2. Electrical and Electronics
- 9.3.3. Aerospace and Defense
- 9.3.4. Industrial
- 9.3.5. Other End-user Industries
- 9.1. Market Analysis, Insights and Forecast - by Type
- 10. Middle East and Africa Metal Matrix Composites Market Analysis, Insights and Forecast, 2020-2032
- 10.1. Market Analysis, Insights and Forecast - by Type
- 10.1.1. Nickel
- 10.1.2. Aluminium
- 10.1.3. Refractory
- 10.1.4. Other Types
- 10.2. Market Analysis, Insights and Forecast - by Fillers
- 10.2.1. Silicon Carbide
- 10.2.2. Aluminum Oxide
- 10.2.3. Titanium Carbide
- 10.2.4. Other Fillers
- 10.3. Market Analysis, Insights and Forecast - by End-user Industry
- 10.3.1. Automotive and Locomotive
- 10.3.2. Electrical and Electronics
- 10.3.3. Aerospace and Defense
- 10.3.4. Industrial
- 10.3.5. Other End-user Industries
- 10.1. Market Analysis, Insights and Forecast - by Type
- 11. Competitive Analysis
- 11.1. Global Market Share Analysis 2025
- 11.2. Company Profiles
- 11.2.1 3A Composites
- 11.2.1.1. Overview
- 11.2.1.2. Products
- 11.2.1.3. SWOT Analysis
- 11.2.1.4. Recent Developments
- 11.2.1.5. Financials (Based on Availability)
- 11.2.2 3M (Ceradyne Inc )
- 11.2.2.1. Overview
- 11.2.2.2. Products
- 11.2.2.3. SWOT Analysis
- 11.2.2.4. Recent Developments
- 11.2.2.5. Financials (Based on Availability)
- 11.2.3 ADMA Products Inc
- 11.2.3.1. Overview
- 11.2.3.2. Products
- 11.2.3.3. SWOT Analysis
- 11.2.3.4. Recent Developments
- 11.2.3.5. Financials (Based on Availability)
- 11.2.4 CPS Technologies Corp
- 11.2.4.1. Overview
- 11.2.4.2. Products
- 11.2.4.3. SWOT Analysis
- 11.2.4.4. Recent Developments
- 11.2.4.5. Financials (Based on Availability)
- 11.2.5 DAT Alloytech
- 11.2.5.1. Overview
- 11.2.5.2. Products
- 11.2.5.3. SWOT Analysis
- 11.2.5.4. Recent Developments
- 11.2.5.5. Financials (Based on Availability)
- 11.2.6 Denka Company Limited
- 11.2.6.1. Overview
- 11.2.6.2. Products
- 11.2.6.3. SWOT Analysis
- 11.2.6.4. Recent Developments
- 11.2.6.5. Financials (Based on Availability)
- 11.2.7 GKN Sinter Metals Engineering GmbH
- 11.2.7.1. Overview
- 11.2.7.2. Products
- 11.2.7.3. SWOT Analysis
- 11.2.7.4. Recent Developments
- 11.2.7.5. Financials (Based on Availability)
- 11.2.8 Hitachi Metals Ltd
- 11.2.8.1. Overview
- 11.2.8.2. Products
- 11.2.8.3. SWOT Analysis
- 11.2.8.4. Recent Developments
- 11.2.8.5. Financials (Based on Availability)
- 11.2.9 Materion Corporation
- 11.2.9.1. Overview
- 11.2.9.2. Products
- 11.2.9.3. SWOT Analysis
- 11.2.9.4. Recent Developments
- 11.2.9.5. Financials (Based on Availability)
- 11.2.10 MTC Powder Solutions AB
- 11.2.10.1. Overview
- 11.2.10.2. Products
- 11.2.10.3. SWOT Analysis
- 11.2.10.4. Recent Developments
- 11.2.10.5. Financials (Based on Availability)
- 11.2.11 Plansee Group
- 11.2.11.1. Overview
- 11.2.11.2. Products
- 11.2.11.3. SWOT Analysis
- 11.2.11.4. Recent Developments
- 11.2.11.5. Financials (Based on Availability)
- 11.2.12 Sumitomo Electric Industries Ltd
- 11.2.12.1. Overview
- 11.2.12.2. Products
- 11.2.12.3. SWOT Analysis
- 11.2.12.4. Recent Developments
- 11.2.12.5. Financials (Based on Availability)
- 11.2.13 Thermal Transfer Composites LLC
- 11.2.13.1. Overview
- 11.2.13.2. Products
- 11.2.13.3. SWOT Analysis
- 11.2.13.4. Recent Developments
- 11.2.13.5. Financials (Based on Availability)
- 11.2.14 TISICS Ltd*List Not Exhaustive
- 11.2.14.1. Overview
- 11.2.14.2. Products
- 11.2.14.3. SWOT Analysis
- 11.2.14.4. Recent Developments
- 11.2.14.5. Financials (Based on Availability)
- 11.2.1 3A Composites
List of Figures
- Figure 1: Global Metal Matrix Composites Market Revenue Breakdown (Million, %) by Region 2025 & 2033
- Figure 2: Global Metal Matrix Composites Market Volume Breakdown (Million, %) by Region 2025 & 2033
- Figure 3: Asia Pacific Metal Matrix Composites Market Revenue (Million), by Type 2025 & 2033
- Figure 4: Asia Pacific Metal Matrix Composites Market Volume (Million), by Type 2025 & 2033
- Figure 5: Asia Pacific Metal Matrix Composites Market Revenue Share (%), by Type 2025 & 2033
- Figure 6: Asia Pacific Metal Matrix Composites Market Volume Share (%), by Type 2025 & 2033
- Figure 7: Asia Pacific Metal Matrix Composites Market Revenue (Million), by Fillers 2025 & 2033
- Figure 8: Asia Pacific Metal Matrix Composites Market Volume (Million), by Fillers 2025 & 2033
- Figure 9: Asia Pacific Metal Matrix Composites Market Revenue Share (%), by Fillers 2025 & 2033
- Figure 10: Asia Pacific Metal Matrix Composites Market Volume Share (%), by Fillers 2025 & 2033
- Figure 11: Asia Pacific Metal Matrix Composites Market Revenue (Million), by End-user Industry 2025 & 2033
- Figure 12: Asia Pacific Metal Matrix Composites Market Volume (Million), by End-user Industry 2025 & 2033
- Figure 13: Asia Pacific Metal Matrix Composites Market Revenue Share (%), by End-user Industry 2025 & 2033
- Figure 14: Asia Pacific Metal Matrix Composites Market Volume Share (%), by End-user Industry 2025 & 2033
- Figure 15: Asia Pacific Metal Matrix Composites Market Revenue (Million), by Country 2025 & 2033
- Figure 16: Asia Pacific Metal Matrix Composites Market Volume (Million), by Country 2025 & 2033
- Figure 17: Asia Pacific Metal Matrix Composites Market Revenue Share (%), by Country 2025 & 2033
- Figure 18: Asia Pacific Metal Matrix Composites Market Volume Share (%), by Country 2025 & 2033
- Figure 19: North America Metal Matrix Composites Market Revenue (Million), by Type 2025 & 2033
- Figure 20: North America Metal Matrix Composites Market Volume (Million), by Type 2025 & 2033
- Figure 21: North America Metal Matrix Composites Market Revenue Share (%), by Type 2025 & 2033
- Figure 22: North America Metal Matrix Composites Market Volume Share (%), by Type 2025 & 2033
- Figure 23: North America Metal Matrix Composites Market Revenue (Million), by Fillers 2025 & 2033
- Figure 24: North America Metal Matrix Composites Market Volume (Million), by Fillers 2025 & 2033
- Figure 25: North America Metal Matrix Composites Market Revenue Share (%), by Fillers 2025 & 2033
- Figure 26: North America Metal Matrix Composites Market Volume Share (%), by Fillers 2025 & 2033
- Figure 27: North America Metal Matrix Composites Market Revenue (Million), by End-user Industry 2025 & 2033
- Figure 28: North America Metal Matrix Composites Market Volume (Million), by End-user Industry 2025 & 2033
- Figure 29: North America Metal Matrix Composites Market Revenue Share (%), by End-user Industry 2025 & 2033
- Figure 30: North America Metal Matrix Composites Market Volume Share (%), by End-user Industry 2025 & 2033
- Figure 31: North America Metal Matrix Composites Market Revenue (Million), by Country 2025 & 2033
- Figure 32: North America Metal Matrix Composites Market Volume (Million), by Country 2025 & 2033
- Figure 33: North America Metal Matrix Composites Market Revenue Share (%), by Country 2025 & 2033
- Figure 34: North America Metal Matrix Composites Market Volume Share (%), by Country 2025 & 2033
- Figure 35: Europe Metal Matrix Composites Market Revenue (Million), by Type 2025 & 2033
- Figure 36: Europe Metal Matrix Composites Market Volume (Million), by Type 2025 & 2033
- Figure 37: Europe Metal Matrix Composites Market Revenue Share (%), by Type 2025 & 2033
- Figure 38: Europe Metal Matrix Composites Market Volume Share (%), by Type 2025 & 2033
- Figure 39: Europe Metal Matrix Composites Market Revenue (Million), by Fillers 2025 & 2033
- Figure 40: Europe Metal Matrix Composites Market Volume (Million), by Fillers 2025 & 2033
- Figure 41: Europe Metal Matrix Composites Market Revenue Share (%), by Fillers 2025 & 2033
- Figure 42: Europe Metal Matrix Composites Market Volume Share (%), by Fillers 2025 & 2033
- Figure 43: Europe Metal Matrix Composites Market Revenue (Million), by End-user Industry 2025 & 2033
- Figure 44: Europe Metal Matrix Composites Market Volume (Million), by End-user Industry 2025 & 2033
- Figure 45: Europe Metal Matrix Composites Market Revenue Share (%), by End-user Industry 2025 & 2033
- Figure 46: Europe Metal Matrix Composites Market Volume Share (%), by End-user Industry 2025 & 2033
- Figure 47: Europe Metal Matrix Composites Market Revenue (Million), by Country 2025 & 2033
- Figure 48: Europe Metal Matrix Composites Market Volume (Million), by Country 2025 & 2033
- Figure 49: Europe Metal Matrix Composites Market Revenue Share (%), by Country 2025 & 2033
- Figure 50: Europe Metal Matrix Composites Market Volume Share (%), by Country 2025 & 2033
- Figure 51: South America Metal Matrix Composites Market Revenue (Million), by Type 2025 & 2033
- Figure 52: South America Metal Matrix Composites Market Volume (Million), by Type 2025 & 2033
- Figure 53: South America Metal Matrix Composites Market Revenue Share (%), by Type 2025 & 2033
- Figure 54: South America Metal Matrix Composites Market Volume Share (%), by Type 2025 & 2033
- Figure 55: South America Metal Matrix Composites Market Revenue (Million), by Fillers 2025 & 2033
- Figure 56: South America Metal Matrix Composites Market Volume (Million), by Fillers 2025 & 2033
- Figure 57: South America Metal Matrix Composites Market Revenue Share (%), by Fillers 2025 & 2033
- Figure 58: South America Metal Matrix Composites Market Volume Share (%), by Fillers 2025 & 2033
- Figure 59: South America Metal Matrix Composites Market Revenue (Million), by End-user Industry 2025 & 2033
- Figure 60: South America Metal Matrix Composites Market Volume (Million), by End-user Industry 2025 & 2033
- Figure 61: South America Metal Matrix Composites Market Revenue Share (%), by End-user Industry 2025 & 2033
- Figure 62: South America Metal Matrix Composites Market Volume Share (%), by End-user Industry 2025 & 2033
- Figure 63: South America Metal Matrix Composites Market Revenue (Million), by Country 2025 & 2033
- Figure 64: South America Metal Matrix Composites Market Volume (Million), by Country 2025 & 2033
- Figure 65: South America Metal Matrix Composites Market Revenue Share (%), by Country 2025 & 2033
- Figure 66: South America Metal Matrix Composites Market Volume Share (%), by Country 2025 & 2033
- Figure 67: Middle East and Africa Metal Matrix Composites Market Revenue (Million), by Type 2025 & 2033
- Figure 68: Middle East and Africa Metal Matrix Composites Market Volume (Million), by Type 2025 & 2033
- Figure 69: Middle East and Africa Metal Matrix Composites Market Revenue Share (%), by Type 2025 & 2033
- Figure 70: Middle East and Africa Metal Matrix Composites Market Volume Share (%), by Type 2025 & 2033
- Figure 71: Middle East and Africa Metal Matrix Composites Market Revenue (Million), by Fillers 2025 & 2033
- Figure 72: Middle East and Africa Metal Matrix Composites Market Volume (Million), by Fillers 2025 & 2033
- Figure 73: Middle East and Africa Metal Matrix Composites Market Revenue Share (%), by Fillers 2025 & 2033
- Figure 74: Middle East and Africa Metal Matrix Composites Market Volume Share (%), by Fillers 2025 & 2033
- Figure 75: Middle East and Africa Metal Matrix Composites Market Revenue (Million), by End-user Industry 2025 & 2033
- Figure 76: Middle East and Africa Metal Matrix Composites Market Volume (Million), by End-user Industry 2025 & 2033
- Figure 77: Middle East and Africa Metal Matrix Composites Market Revenue Share (%), by End-user Industry 2025 & 2033
- Figure 78: Middle East and Africa Metal Matrix Composites Market Volume Share (%), by End-user Industry 2025 & 2033
- Figure 79: Middle East and Africa Metal Matrix Composites Market Revenue (Million), by Country 2025 & 2033
- Figure 80: Middle East and Africa Metal Matrix Composites Market Volume (Million), by Country 2025 & 2033
- Figure 81: Middle East and Africa Metal Matrix Composites Market Revenue Share (%), by Country 2025 & 2033
- Figure 82: Middle East and Africa Metal Matrix Composites Market Volume Share (%), by Country 2025 & 2033
List of Tables
- Table 1: Global Metal Matrix Composites Market Revenue Million Forecast, by Type 2020 & 2033
- Table 2: Global Metal Matrix Composites Market Volume Million Forecast, by Type 2020 & 2033
- Table 3: Global Metal Matrix Composites Market Revenue Million Forecast, by Fillers 2020 & 2033
- Table 4: Global Metal Matrix Composites Market Volume Million Forecast, by Fillers 2020 & 2033
- Table 5: Global Metal Matrix Composites Market Revenue Million Forecast, by End-user Industry 2020 & 2033
- Table 6: Global Metal Matrix Composites Market Volume Million Forecast, by End-user Industry 2020 & 2033
- Table 7: Global Metal Matrix Composites Market Revenue Million Forecast, by Region 2020 & 2033
- Table 8: Global Metal Matrix Composites Market Volume Million Forecast, by Region 2020 & 2033
- Table 9: Global Metal Matrix Composites Market Revenue Million Forecast, by Type 2020 & 2033
- Table 10: Global Metal Matrix Composites Market Volume Million Forecast, by Type 2020 & 2033
- Table 11: Global Metal Matrix Composites Market Revenue Million Forecast, by Fillers 2020 & 2033
- Table 12: Global Metal Matrix Composites Market Volume Million Forecast, by Fillers 2020 & 2033
- Table 13: Global Metal Matrix Composites Market Revenue Million Forecast, by End-user Industry 2020 & 2033
- Table 14: Global Metal Matrix Composites Market Volume Million Forecast, by End-user Industry 2020 & 2033
- Table 15: Global Metal Matrix Composites Market Revenue Million Forecast, by Country 2020 & 2033
- Table 16: Global Metal Matrix Composites Market Volume Million Forecast, by Country 2020 & 2033
- Table 17: China Metal Matrix Composites Market Revenue (Million) Forecast, by Application 2020 & 2033
- Table 18: China Metal Matrix Composites Market Volume (Million) Forecast, by Application 2020 & 2033
- Table 19: India Metal Matrix Composites Market Revenue (Million) Forecast, by Application 2020 & 2033
- Table 20: India Metal Matrix Composites Market Volume (Million) Forecast, by Application 2020 & 2033
- Table 21: Japan Metal Matrix Composites Market Revenue (Million) Forecast, by Application 2020 & 2033
- Table 22: Japan Metal Matrix Composites Market Volume (Million) Forecast, by Application 2020 & 2033
- Table 23: South Korea Metal Matrix Composites Market Revenue (Million) Forecast, by Application 2020 & 2033
- Table 24: South Korea Metal Matrix Composites Market Volume (Million) Forecast, by Application 2020 & 2033
- Table 25: Rest of Asia Pacific Metal Matrix Composites Market Revenue (Million) Forecast, by Application 2020 & 2033
- Table 26: Rest of Asia Pacific Metal Matrix Composites Market Volume (Million) Forecast, by Application 2020 & 2033
- Table 27: Global Metal Matrix Composites Market Revenue Million Forecast, by Type 2020 & 2033
- Table 28: Global Metal Matrix Composites Market Volume Million Forecast, by Type 2020 & 2033
- Table 29: Global Metal Matrix Composites Market Revenue Million Forecast, by Fillers 2020 & 2033
- Table 30: Global Metal Matrix Composites Market Volume Million Forecast, by Fillers 2020 & 2033
- Table 31: Global Metal Matrix Composites Market Revenue Million Forecast, by End-user Industry 2020 & 2033
- Table 32: Global Metal Matrix Composites Market Volume Million Forecast, by End-user Industry 2020 & 2033
- Table 33: Global Metal Matrix Composites Market Revenue Million Forecast, by Country 2020 & 2033
- Table 34: Global Metal Matrix Composites Market Volume Million Forecast, by Country 2020 & 2033
- Table 35: United States Metal Matrix Composites Market Revenue (Million) Forecast, by Application 2020 & 2033
- Table 36: United States Metal Matrix Composites Market Volume (Million) Forecast, by Application 2020 & 2033
- Table 37: Canada Metal Matrix Composites Market Revenue (Million) Forecast, by Application 2020 & 2033
- Table 38: Canada Metal Matrix Composites Market Volume (Million) Forecast, by Application 2020 & 2033
- Table 39: Mexico Metal Matrix Composites Market Revenue (Million) Forecast, by Application 2020 & 2033
- Table 40: Mexico Metal Matrix Composites Market Volume (Million) Forecast, by Application 2020 & 2033
- Table 41: Global Metal Matrix Composites Market Revenue Million Forecast, by Type 2020 & 2033
- Table 42: Global Metal Matrix Composites Market Volume Million Forecast, by Type 2020 & 2033
- Table 43: Global Metal Matrix Composites Market Revenue Million Forecast, by Fillers 2020 & 2033
- Table 44: Global Metal Matrix Composites Market Volume Million Forecast, by Fillers 2020 & 2033
- Table 45: Global Metal Matrix Composites Market Revenue Million Forecast, by End-user Industry 2020 & 2033
- Table 46: Global Metal Matrix Composites Market Volume Million Forecast, by End-user Industry 2020 & 2033
- Table 47: Global Metal Matrix Composites Market Revenue Million Forecast, by Country 2020 & 2033
- Table 48: Global Metal Matrix Composites Market Volume Million Forecast, by Country 2020 & 2033
- Table 49: Germany Metal Matrix Composites Market Revenue (Million) Forecast, by Application 2020 & 2033
- Table 50: Germany Metal Matrix Composites Market Volume (Million) Forecast, by Application 2020 & 2033
- Table 51: United Kingdom Metal Matrix Composites Market Revenue (Million) Forecast, by Application 2020 & 2033
- Table 52: United Kingdom Metal Matrix Composites Market Volume (Million) Forecast, by Application 2020 & 2033
- Table 53: Italy Metal Matrix Composites Market Revenue (Million) Forecast, by Application 2020 & 2033
- Table 54: Italy Metal Matrix Composites Market Volume (Million) Forecast, by Application 2020 & 2033
- Table 55: France Metal Matrix Composites Market Revenue (Million) Forecast, by Application 2020 & 2033
- Table 56: France Metal Matrix Composites Market Volume (Million) Forecast, by Application 2020 & 2033
- Table 57: Spain Metal Matrix Composites Market Revenue (Million) Forecast, by Application 2020 & 2033
- Table 58: Spain Metal Matrix Composites Market Volume (Million) Forecast, by Application 2020 & 2033
- Table 59: Rest of Europe Metal Matrix Composites Market Revenue (Million) Forecast, by Application 2020 & 2033
- Table 60: Rest of Europe Metal Matrix Composites Market Volume (Million) Forecast, by Application 2020 & 2033
- Table 61: Global Metal Matrix Composites Market Revenue Million Forecast, by Type 2020 & 2033
- Table 62: Global Metal Matrix Composites Market Volume Million Forecast, by Type 2020 & 2033
- Table 63: Global Metal Matrix Composites Market Revenue Million Forecast, by Fillers 2020 & 2033
- Table 64: Global Metal Matrix Composites Market Volume Million Forecast, by Fillers 2020 & 2033
- Table 65: Global Metal Matrix Composites Market Revenue Million Forecast, by End-user Industry 2020 & 2033
- Table 66: Global Metal Matrix Composites Market Volume Million Forecast, by End-user Industry 2020 & 2033
- Table 67: Global Metal Matrix Composites Market Revenue Million Forecast, by Country 2020 & 2033
- Table 68: Global Metal Matrix Composites Market Volume Million Forecast, by Country 2020 & 2033
- Table 69: Brazil Metal Matrix Composites Market Revenue (Million) Forecast, by Application 2020 & 2033
- Table 70: Brazil Metal Matrix Composites Market Volume (Million) Forecast, by Application 2020 & 2033
- Table 71: Argentina Metal Matrix Composites Market Revenue (Million) Forecast, by Application 2020 & 2033
- Table 72: Argentina Metal Matrix Composites Market Volume (Million) Forecast, by Application 2020 & 2033
- Table 73: Rest of South America Metal Matrix Composites Market Revenue (Million) Forecast, by Application 2020 & 2033
- Table 74: Rest of South America Metal Matrix Composites Market Volume (Million) Forecast, by Application 2020 & 2033
- Table 75: Global Metal Matrix Composites Market Revenue Million Forecast, by Type 2020 & 2033
- Table 76: Global Metal Matrix Composites Market Volume Million Forecast, by Type 2020 & 2033
- Table 77: Global Metal Matrix Composites Market Revenue Million Forecast, by Fillers 2020 & 2033
- Table 78: Global Metal Matrix Composites Market Volume Million Forecast, by Fillers 2020 & 2033
- Table 79: Global Metal Matrix Composites Market Revenue Million Forecast, by End-user Industry 2020 & 2033
- Table 80: Global Metal Matrix Composites Market Volume Million Forecast, by End-user Industry 2020 & 2033
- Table 81: Global Metal Matrix Composites Market Revenue Million Forecast, by Country 2020 & 2033
- Table 82: Global Metal Matrix Composites Market Volume Million Forecast, by Country 2020 & 2033
- Table 83: Saudi Arabia Metal Matrix Composites Market Revenue (Million) Forecast, by Application 2020 & 2033
- Table 84: Saudi Arabia Metal Matrix Composites Market Volume (Million) Forecast, by Application 2020 & 2033
- Table 85: South Africa Metal Matrix Composites Market Revenue (Million) Forecast, by Application 2020 & 2033
- Table 86: South Africa Metal Matrix Composites Market Volume (Million) Forecast, by Application 2020 & 2033
- Table 87: Rest of Middle East and Africa Metal Matrix Composites Market Revenue (Million) Forecast, by Application 2020 & 2033
- Table 88: Rest of Middle East and Africa Metal Matrix Composites Market Volume (Million) Forecast, by Application 2020 & 2033
Frequently Asked Questions
1. What is the projected Compound Annual Growth Rate (CAGR) of the Metal Matrix Composites Market?
The projected CAGR is approximately 6.49%.
2. Which companies are prominent players in the Metal Matrix Composites Market?
Key companies in the market include 3A Composites, 3M (Ceradyne Inc ), ADMA Products Inc, CPS Technologies Corp, DAT Alloytech, Denka Company Limited, GKN Sinter Metals Engineering GmbH, Hitachi Metals Ltd, Materion Corporation, MTC Powder Solutions AB, Plansee Group, Sumitomo Electric Industries Ltd, Thermal Transfer Composites LLC, TISICS Ltd*List Not Exhaustive.
3. What are the main segments of the Metal Matrix Composites Market?
The market segments include Type, Fillers, End-user Industry.
4. Can you provide details about the market size?
The market size is estimated to be USD 457.16 Million as of 2022.
5. What are some drivers contributing to market growth?
Increasing Demand for Lightweight Materials in Aerospace and Defense Industry; Superior Properties of Metal Matrix Composites over Metals.
6. What are the notable trends driving market growth?
Electrical and Electronics Segment to Register Fastest Growth.
7. Are there any restraints impacting market growth?
Increasing Demand for Lightweight Materials in Aerospace and Defense Industry; Superior Properties of Metal Matrix Composites over Metals.
8. Can you provide examples of recent developments in the market?
In January 2022, Plansee Group signed a definitive agreement to acquire Mi-Tech Tungsten Metals. The acquisition will help Plansee Group expand its market position for tungsten products in North America.
9. What pricing options are available for accessing the report?
Pricing options include single-user, multi-user, and enterprise licenses priced at USD 4750, USD 5250, and USD 8750 respectively.
10. Is the market size provided in terms of value or volume?
The market size is provided in terms of value, measured in Million and volume, measured in Million.
11. Are there any specific market keywords associated with the report?
Yes, the market keyword associated with the report is "Metal Matrix Composites Market," which aids in identifying and referencing the specific market segment covered.
12. How do I determine which pricing option suits my needs best?
The pricing options vary based on user requirements and access needs. Individual users may opt for single-user licenses, while businesses requiring broader access may choose multi-user or enterprise licenses for cost-effective access to the report.
13. Are there any additional resources or data provided in the Metal Matrix Composites Market report?
While the report offers comprehensive insights, it's advisable to review the specific contents or supplementary materials provided to ascertain if additional resources or data are available.
14. How can I stay updated on further developments or reports in the Metal Matrix Composites Market?
To stay informed about further developments, trends, and reports in the Metal Matrix Composites Market, consider subscribing to industry newsletters, following relevant companies and organizations, or regularly checking reputable industry news sources and publications.
Methodology
Step 1 - Identification of Relevant Samples Size from Population Database


Step 2 - Approaches for Defining Global Market Size (Value, Volume* & Price*)

Note*: In applicable scenarios
Step 3 - Data Sources
Primary Research
- Web Analytics
- Survey Reports
- Research Institute
- Latest Research Reports
- Opinion Leaders
Secondary Research
- Annual Reports
- White Paper
- Latest Press Release
- Industry Association
- Paid Database
- Investor Presentations

Step 4 - Data Triangulation
Involves using different sources of information in order to increase the validity of a study
These sources are likely to be stakeholders in a program - participants, other researchers, program staff, other community members, and so on.
Then we put all data in single framework & apply various statistical tools to find out the dynamic on the market.
During the analysis stage, feedback from the stakeholder groups would be compared to determine areas of agreement as well as areas of divergence