

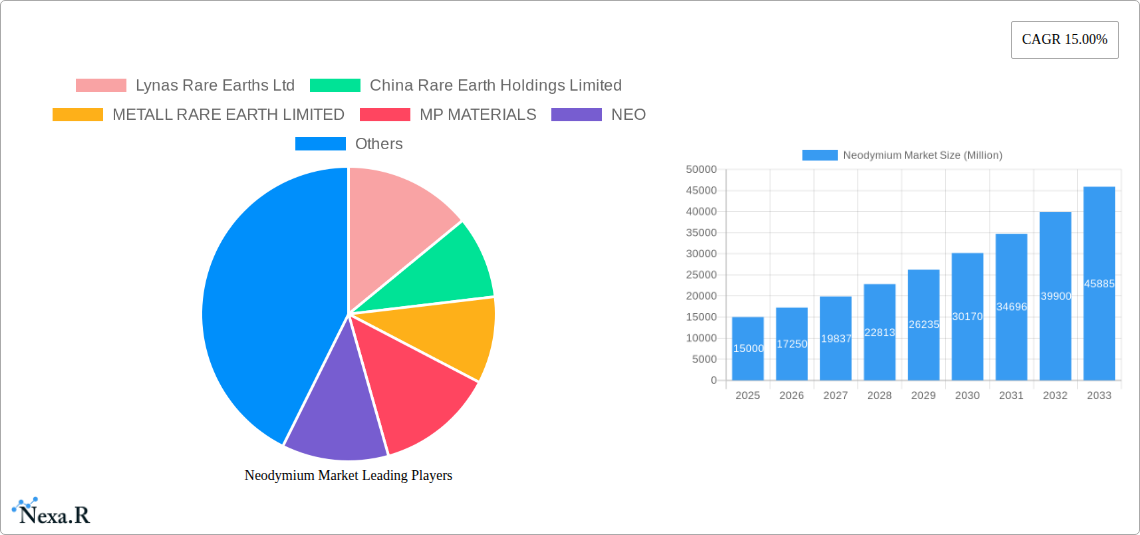
Key Insights
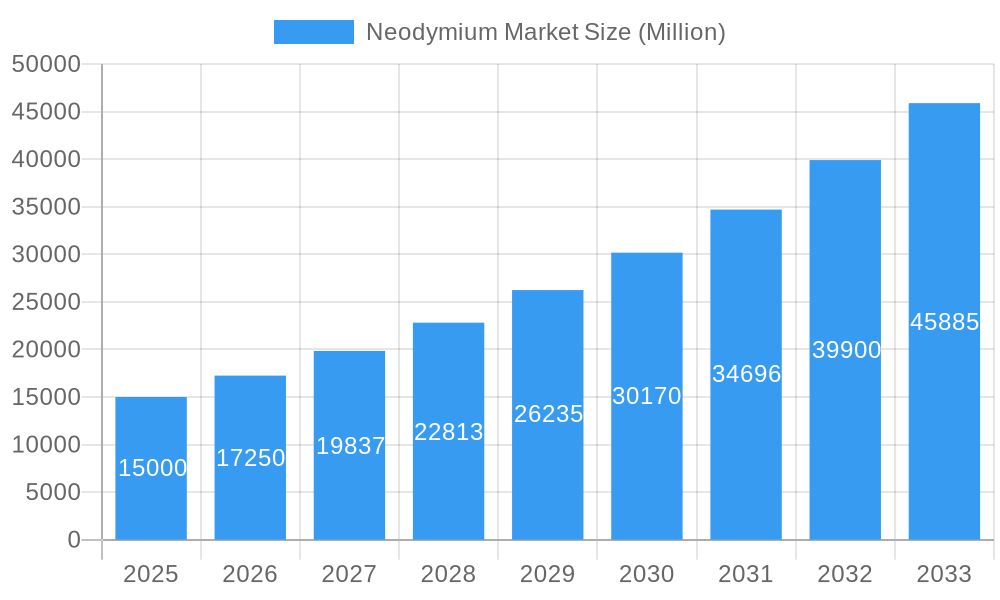
The Neodymium market is poised for substantial growth, projected to reach a significant valuation by 2033. Driven by an impressive CAGR of 15.00%, this expansion is primarily fueled by the escalating demand from critical applications such as high-performance magnets, essential catalysts, and advanced glass and ceramics. The automotive sector is a dominant consumer, with the burgeoning electric vehicle (EV) market necessitating powerful neodymium magnets for electric motors. Similarly, the electrical and electronics industry, from consumer gadgets to sophisticated industrial equipment, relies heavily on these magnets for miniaturization and enhanced efficiency. The burgeoning wind energy sector, with its increasing deployment of large-scale wind turbines requiring powerful permanent magnets, represents another substantial growth engine. Emerging applications in defense and medical technologies further bolster the market's upward trajectory.
Neodymium Market Market Size (In Billion)
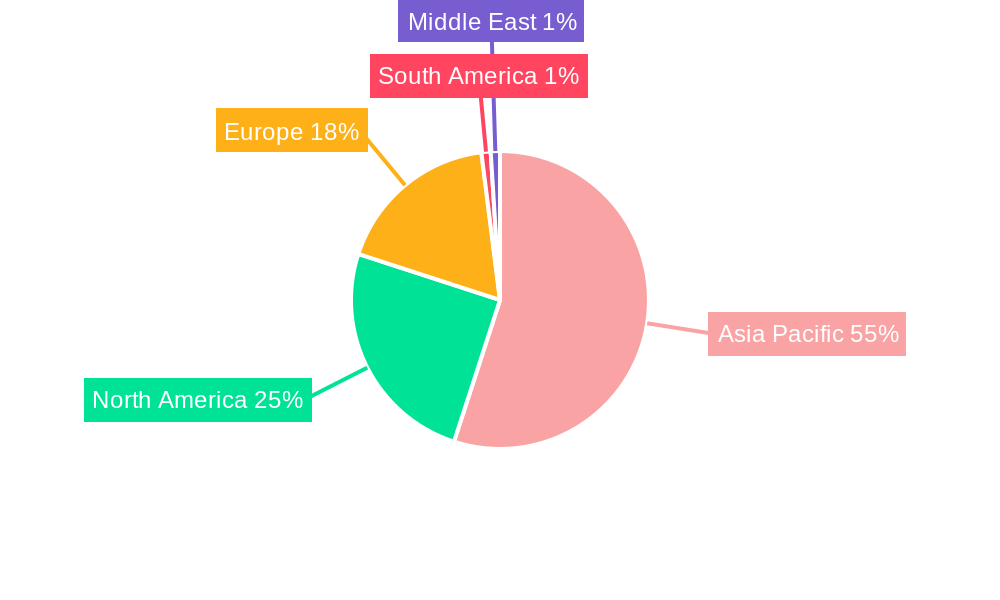
Despite the robust growth, the market faces certain restraints. The geopolitical concentration of rare earth mining and processing, particularly in China, presents supply chain vulnerabilities and price volatility concerns. Stringent environmental regulations associated with rare earth extraction and processing also contribute to operational complexities and increased costs. Furthermore, the development and adoption of alternative materials or recycling technologies could, in the long term, pose a challenge. However, the inherent superior magnetic properties of neodymium, coupled with ongoing technological advancements and strategic efforts to diversify supply chains, are expected to outweigh these challenges, ensuring continued market expansion throughout the forecast period. The Asia Pacific region, led by China's dominant role in production and consumption, is expected to remain the largest market, with North America and Europe showing significant growth driven by their respective green energy initiatives and advanced manufacturing sectors.
Neodymium Market Company Market Share
Unlock critical insights into the dynamic Neodymium Market with this in-depth analysis. This report navigates the evolving landscape of rare earth magnets, catalysts, and advanced materials, crucial for automotive, electronics, and wind energy sectors. Discover market size, growth trajectories, regional dominance, and key player strategies for the period 2019–2033, with a base year of 2025.
Neodymium Market Dynamics & Structure
The global neodymium market is characterized by a moderate to high market concentration, heavily influenced by a few key producers and evolving geopolitical landscapes. Technological innovation, particularly in magnet manufacturing and rare earth processing, serves as a significant driver, fostering the development of higher-performance and more efficient neodymium-based products. Regulatory frameworks, including environmental protection laws and critical mineral policies, are increasingly shaping production and trade. Competitive product substitutes, while present in certain niche applications, are generally outmatched by the unique magnetic properties of neodymium. End-user demographics are shifting towards sustainable technologies and electrification, directly impacting demand from the automotive and wind energy sectors. Mergers and acquisitions (M&A) trends are notable as companies seek to secure critical rare earth supplies and vertically integrate their operations.
- Market Concentration: Dominated by a few major players with significant mining and processing capabilities.
- Technological Innovation: Continuous advancements in rare earth magnet technology, electric vehicle (EV) motor efficiency, and renewable energy components.
- Regulatory Frameworks: Increasing scrutiny on environmental impact of mining, trade policies, and critical mineral security initiatives.
- Competitive Substitutes: Limited viable alternatives for high-performance permanent magnets, though research into alternative materials is ongoing.
- End-User Demographics: Growing demand from sustainability-focused industries and consumer electronics.
- M&A Trends: Strategic acquisitions aimed at securing long-term supply chains and expanding market reach.
Neodymium Market Growth Trends & Insights
The neodymium market is poised for substantial growth, driven by the accelerating global transition towards electric mobility and renewable energy infrastructure. The market size evolution is projected to be robust, fueled by increasing adoption rates of permanent magnet synchronous motors (PMSMs) in electric vehicles and the expanding deployment of wind turbines. Technological disruptions, such as advancements in magnet recycling and the development of rare earth-free alternatives, will play a crucial role in shaping the market's trajectory, while also presenting opportunities for innovation. Consumer behavior shifts towards environmentally conscious products and energy efficiency are further cementing demand for neodymium-containing applications. The CAGR is estimated to be in the range of 7.5% - 9.5% for the forecast period. Market penetration in emerging economies is expected to rise significantly as these regions invest heavily in green technologies. Insights from historical data (2019–2024) reveal a steady upward trend, which is projected to accelerate in the coming years.
The increasing demand for high-performance electric vehicle motors is a paramount growth driver. As governments worldwide implement stricter emissions standards and offer incentives for EV adoption, the need for powerful and lightweight permanent magnets, predominantly made with neodymium, will surge. This trend is expected to account for approximately 60% of the total neodymium demand by 2033. Furthermore, the burgeoning wind energy sector, a cornerstone of global decarbonization efforts, relies heavily on large direct-drive wind turbines that utilize neodymium-iron-boron (NdFeB) magnets to generate electricity efficiently. The expansion of offshore and onshore wind farms will therefore contribute significantly to market expansion.
Beyond these dominant sectors, other applications like catalysts for petroleum refining, polishing agents for glass and ceramics, and specialized alloys in defense and aerospace industries are also exhibiting steady growth. The increasing focus on supply chain diversification and the development of non-Chinese rare earth sources are creating new market dynamics and opportunities for regional players. Innovations in magnet manufacturing, such as reducing the percentage of neodymium required without compromising performance, are also contributing to market evolution. Understanding these interconnected trends is crucial for stakeholders seeking to capitalize on the immense potential of the neodymium market.
Dominant Regions, Countries, or Segments in Neodymium Market
The Application Segment of Magnets unequivocally dominates the neodymium market, driven by its indispensable role in the production of high-performance permanent magnets, particularly neodymium-iron-boron (NdFeB) magnets. This segment is expected to consistently hold over 80% of the market share throughout the forecast period. The End-User Industry of Automotive is the primary engine of this dominance, propelled by the rapid global adoption of electric vehicles (EVs). The increasing demand for powerful, lightweight, and efficient electric motors in EVs directly translates into an insatiable appetite for NdFeB magnets. The Electrical and Electronics industry also represents a significant and growing demand center, encompassing applications such as hard disk drives, speakers, and various consumer electronics.
Geographically, Asia-Pacific is the leading region in the neodymium market, largely due to China's dominant position in both mining and processing of rare earth elements, including neodymium. However, there is a growing strategic imperative and significant investment in diversifying rare earth supply chains outside of China.
Dominant Application Segment: Magnets
- Market Share: Exceeds 80% of the total neodymium market.
- Key Driver: Essential for Neodymium-Iron-Boron (NdFeB) magnets, the strongest permanent magnets available.
- Technological Advancements: Continuous innovation in magnet density and performance for EVs and wind turbines.
- Growth Potential: High, directly tied to the electrification of transportation and renewable energy expansion.
Dominant End-User Industry: Automotive
- Market Share: The largest consumer of neodymium magnets.
- Key Driver: Proliferation of Electric Vehicles (EVs) and their high-torque electric motors.
- Growth Potential: Exponential growth projected due to global EV adoption targets and stricter emission regulations.
- Sub-segment Impact: Demand for magnets in EV motors, regenerative braking systems, and power steering.
Leading Region: Asia-Pacific
- Market Dominance: Driven by China's established rare earth supply chain.
- Emerging Trends: Increasing investments in rare earth processing and magnet manufacturing in countries like Japan, South Korea, and Australia to reduce dependency.
- Growth Factors: Strong manufacturing base for electronics, automotive, and renewable energy components.
Other Significant Segments:
- End-User Industry: Wind Energy: Crucial for direct-drive wind turbines, contributing significantly to renewable energy goals. Growth is directly correlated with global wind power installation targets.
- Application: Catalysts: Used in petroleum refining and other chemical processes. Demand is influenced by global energy consumption and industrial output.
- Application: Glass and Ceramics: Used for coloring and UV filtering. Demand is relatively stable but growing with specialized applications in optics and advanced materials.
Neodymium Market Product Landscape
The neodymium market product landscape is primarily defined by neodymium-iron-boron (NdFeB) magnets, which represent the pinnacle of permanent magnet technology due to their exceptional magnetic strength and coercivity. These magnets are crucial for miniaturization and enhanced performance across various applications, from electric vehicle motors to wind turbine generators. Innovations focus on increasing energy product density, improving temperature stability, and reducing the reliance on heavy rare earth elements like dysprosium and terbium for higher-performance grades. Other key products include neodymium oxide, a critical precursor for magnet production, and various neodymium alloys used in specialized applications, exhibiting unique optical and magnetic properties.
Key Drivers, Barriers & Challenges in Neodymium Market
Key Drivers:
- Global Electrification Push: The rapid adoption of electric vehicles (EVs) and expansion of renewable energy (wind and solar) are the primary growth engines, directly increasing demand for neodymium magnets.
- Technological Advancements: Continuous innovation in magnet technology, leading to more efficient and powerful magnets, drives demand for higher grades of neodymium.
- Government Support & Policy: Incentives for EVs, renewable energy deployment, and strategic critical mineral policies worldwide are accelerating market growth.
- Miniaturization Trends: The demand for smaller, lighter, and more powerful electronic devices fuels the use of NdFeB magnets.
Barriers & Challenges:
- Supply Chain Concentration & Geopolitics: Over-reliance on a few major producing countries creates supply chain vulnerabilities and geopolitical risks.
- Environmental Concerns: The extraction and processing of rare earth elements can be environmentally intensive, leading to stricter regulations and higher operational costs.
- Price Volatility: Fluctuations in the prices of rare earth elements, influenced by supply-demand dynamics and speculation, pose challenges for end-users in long-term planning.
- Recycling Infrastructure: The current infrastructure for rare earth magnet recycling is nascent, limiting the recovery of valuable materials and increasing reliance on primary extraction.
- Substitution Efforts: Ongoing research into rare earth-free magnet alternatives presents a potential long-term challenge to neodymium demand, though widespread commercial viability remains distant for high-performance applications.
Emerging Opportunities in Neodymium Market
Emerging opportunities in the neodymium market lie in the development of sustainable and diversified supply chains. Investments in rare earth mining and processing outside of dominant regions, particularly in North America and Australia, are creating new avenues for market participants. The growing emphasis on rare earth magnet recycling presents a significant opportunity to recover valuable neodymium and reduce reliance on primary extraction, thereby mitigating environmental impacts and supply chain risks. Furthermore, advancements in additive manufacturing (3D printing) of magnets could unlock new design possibilities and on-demand production capabilities. The increasing demand for specialized magnets in advanced robotics, medical devices, and next-generation aerospace technologies also offers promising avenues for market expansion.
Growth Accelerators in the Neodymium Market Industry
The long-term growth of the neodymium market will be significantly accelerated by breakthroughs in rare earth extraction and separation technologies, making production more efficient and environmentally friendly. Strategic partnerships and joint ventures between rare earth producers and end-users, especially in the automotive and renewable energy sectors, will solidify supply chains and foster collaborative innovation. Market expansion strategies focused on developing nascent EV markets and regions with high renewable energy potential will create sustained demand. Furthermore, the successful implementation of robust rare earth magnet recycling programs will not only address supply concerns but also drive a circular economy, becoming a critical growth accelerator.
Key Players Shaping the Neodymium Market Market
- Lynas Rare Earths Ltd
- China Rare Earth Holdings Limited
- METALL RARE EARTH LIMITED
- MP MATERIALS
- NEO
- Australian Strategic Materials Ltd
- HEFA Rare Earth Canada Co Ltd
- Arafura Resources
- Peak Rare Earths
- Rainbow Rare Earths Limited
Notable Milestones in Neodymium Market Sector
- February 2023: MP Materials and Sumitomo Corporation entered into an agreement to diversify and strengthen rare earth supplies in Japan. Under the agreement, Sumitomo Corporation becomes the exclusive distributor of neodymium and praseodymium (NdPr) oxide produced by MP Materials.
- November 2022: Arafura Resources Limited signed a supply deal with South Korea's Hyundai Motor Co. and its unit Kia Corp. to supply up to 1,500 metric tons of neodymium-praseodymium (NdPr) oxide per year. Under the agreement, the company will supply contract quantities of NdPr oxide over seven years.
- August 2022: Australia's Lynas Rare Earths Ltd. expanded capacity at its Western Australia-based Mt Weld mine, which has deposits of neodymium (Nd) and praseodymium (Pr). The company anticipated expansion work to begin by early 2023, with full operation planned for 2024.
- July 2022: Arafura Resources Limited and GE Renewable Energy signed a non-binding memorandum of understanding (MoU) to jointly cooperate in the establishment of a sustainable supply chain for neodymium and praseodymium (NdPr), which is central to the energy transition.
In-Depth Neodymium Market Market Outlook
The future outlook for the neodymium market remains exceptionally strong, driven by the unwavering global commitment to decarbonization and technological advancement. Growth accelerators such as increased government backing for green technologies, continuous innovation in energy storage and generation, and the expanding global adoption of electric vehicles and renewable energy sources will fuel sustained demand. Strategic opportunities lie in the establishment of resilient and diversified supply chains, alongside the maturation of rare earth magnet recycling technologies, which will shape a more sustainable and secure market. Investors and industry participants can anticipate significant opportunities arising from the ongoing transition to a low-carbon economy, underscoring the strategic importance of neodymium in the coming decades.
Neodymium Market Segmentation
-
1. Application
- 1.1. Magnets
- 1.2. Catalysts
- 1.3. Glass and Ceramics
- 1.4. Other Applications
-
2. End-User Industry
- 2.1. Automotive
- 2.2. Electrical and Electronics
- 2.3. Wind Energy
- 2.4. Other End-user Industries
Neodymium Market Segmentation By Geography
-
1. Asia Pacific
- 1.1. China
- 1.2. India
- 1.3. Japan
- 1.4. South Korea
- 1.5. Rest of Asia Pacific
-
2. North America
- 2.1. United States
- 2.2. Canada
- 2.3. Mexico
-
3. Europe
- 3.1. Germany
- 3.2. United Kingdom
- 3.3. Italy
- 3.4. France
- 3.5. Rest of Europe
-
4. South America
- 4.1. Brazil
- 4.2. Argentina
- 4.3. Rest of South America
- 5. Middle East
-
6. Saudi Arabia
- 6.1. South Africa
- 6.2. Rest of Middle East
Neodymium Market Regional Market Share
Geographic Coverage of Neodymium Market
Neodymium Market REPORT HIGHLIGHTS
| Aspects | Details |
|---|---|
| Study Period | 2020-2034 |
| Base Year | 2025 |
| Estimated Year | 2026 |
| Forecast Period | 2026-2034 |
| Historical Period | 2020-2025 |
| Growth Rate | CAGR of 6.7% from 2020-2034 |
| Segmentation |
|
Table of Contents
- 1. Introduction
- 1.1. Research Scope
- 1.2. Market Segmentation
- 1.3. Research Objective
- 1.4. Definitions and Assumptions
- 2. Executive Summary
- 2.1. Market Snapshot
- 3. Market Dynamics
- 3.1. Market Drivers
- 3.2. Market Restrains
- 3.3. Market Trends
- 3.4. Market Opportunities
- 4. Market Factor Analysis
- 4.1. Porters Five Forces
- 4.1.1. Bargaining Power of Suppliers
- 4.1.2. Bargaining Power of Buyers
- 4.1.3. Threat of New Entrants
- 4.1.4. Threat of Substitutes
- 4.1.5. Competitive Rivalry
- 4.2. PESTEL analysis
- 4.3. BCG Analysis
- 4.3.1. Stars (High Growth, High Market Share)
- 4.3.2. Cash Cows (Low Growth, High Market Share)
- 4.3.3. Question Mark (High Growth, Low Market Share)
- 4.3.4. Dogs (Low Growth, Low Market Share)
- 4.4. Ansoff Matrix Analysis
- 4.5. Supply Chain Analysis
- 4.6. Regulatory Landscape
- 4.7. Current Market Potential and Opportunity Assessment (TAM–SAM–SOM Framework)
- 4.8. NRP Analyst Note
- 4.1. Porters Five Forces
- 5. Market Analysis, Insights and Forecast 2021-2033
- 5.1. Market Analysis, Insights and Forecast - by Application
- 5.1.1. Magnets
- 5.1.2. Catalysts
- 5.1.3. Glass and Ceramics
- 5.1.4. Other Applications
- 5.2. Market Analysis, Insights and Forecast - by End-User Industry
- 5.2.1. Automotive
- 5.2.2. Electrical and Electronics
- 5.2.3. Wind Energy
- 5.2.4. Other End-user Industries
- 5.3. Market Analysis, Insights and Forecast - by Region
- 5.3.1. Asia Pacific
- 5.3.2. North America
- 5.3.3. Europe
- 5.3.4. South America
- 5.3.5. Middle East
- 5.3.6. Saudi Arabia
- 5.1. Market Analysis, Insights and Forecast - by Application
- 6. Global Neodymium Market Analysis, Insights and Forecast, 2021-2033
- 6.1. Market Analysis, Insights and Forecast - by Application
- 6.1.1. Magnets
- 6.1.2. Catalysts
- 6.1.3. Glass and Ceramics
- 6.1.4. Other Applications
- 6.2. Market Analysis, Insights and Forecast - by End-User Industry
- 6.2.1. Automotive
- 6.2.2. Electrical and Electronics
- 6.2.3. Wind Energy
- 6.2.4. Other End-user Industries
- 6.1. Market Analysis, Insights and Forecast - by Application
- 7. Asia Pacific Neodymium Market Analysis, Insights and Forecast, 2020-2032
- 7.1. Market Analysis, Insights and Forecast - by Application
- 7.1.1. Magnets
- 7.1.2. Catalysts
- 7.1.3. Glass and Ceramics
- 7.1.4. Other Applications
- 7.2. Market Analysis, Insights and Forecast - by End-User Industry
- 7.2.1. Automotive
- 7.2.2. Electrical and Electronics
- 7.2.3. Wind Energy
- 7.2.4. Other End-user Industries
- 7.1. Market Analysis, Insights and Forecast - by Application
- 8. North America Neodymium Market Analysis, Insights and Forecast, 2020-2032
- 8.1. Market Analysis, Insights and Forecast - by Application
- 8.1.1. Magnets
- 8.1.2. Catalysts
- 8.1.3. Glass and Ceramics
- 8.1.4. Other Applications
- 8.2. Market Analysis, Insights and Forecast - by End-User Industry
- 8.2.1. Automotive
- 8.2.2. Electrical and Electronics
- 8.2.3. Wind Energy
- 8.2.4. Other End-user Industries
- 8.1. Market Analysis, Insights and Forecast - by Application
- 9. Europe Neodymium Market Analysis, Insights and Forecast, 2020-2032
- 9.1. Market Analysis, Insights and Forecast - by Application
- 9.1.1. Magnets
- 9.1.2. Catalysts
- 9.1.3. Glass and Ceramics
- 9.1.4. Other Applications
- 9.2. Market Analysis, Insights and Forecast - by End-User Industry
- 9.2.1. Automotive
- 9.2.2. Electrical and Electronics
- 9.2.3. Wind Energy
- 9.2.4. Other End-user Industries
- 9.1. Market Analysis, Insights and Forecast - by Application
- 10. South America Neodymium Market Analysis, Insights and Forecast, 2020-2032
- 10.1. Market Analysis, Insights and Forecast - by Application
- 10.1.1. Magnets
- 10.1.2. Catalysts
- 10.1.3. Glass and Ceramics
- 10.1.4. Other Applications
- 10.2. Market Analysis, Insights and Forecast - by End-User Industry
- 10.2.1. Automotive
- 10.2.2. Electrical and Electronics
- 10.2.3. Wind Energy
- 10.2.4. Other End-user Industries
- 10.1. Market Analysis, Insights and Forecast - by Application
- 11. Middle East Neodymium Market Analysis, Insights and Forecast, 2020-2032
- 11.1. Market Analysis, Insights and Forecast - by Application
- 11.1.1. Magnets
- 11.1.2. Catalysts
- 11.1.3. Glass and Ceramics
- 11.1.4. Other Applications
- 11.2. Market Analysis, Insights and Forecast - by End-User Industry
- 11.2.1. Automotive
- 11.2.2. Electrical and Electronics
- 11.2.3. Wind Energy
- 11.2.4. Other End-user Industries
- 11.1. Market Analysis, Insights and Forecast - by Application
- 12. Saudi Arabia Neodymium Market Analysis, Insights and Forecast, 2020-2032
- 12.1. Market Analysis, Insights and Forecast - by Application
- 12.1.1. Magnets
- 12.1.2. Catalysts
- 12.1.3. Glass and Ceramics
- 12.1.4. Other Applications
- 12.2. Market Analysis, Insights and Forecast - by End-User Industry
- 12.2.1. Automotive
- 12.2.2. Electrical and Electronics
- 12.2.3. Wind Energy
- 12.2.4. Other End-user Industries
- 12.1. Market Analysis, Insights and Forecast - by Application
- 13. Competitive Analysis
- 13.1. Company Profiles
- 13.1.1 Lynas Rare Earths Ltd
- 13.1.1.1. Company Overview
- 13.1.1.2. Products
- 13.1.1.3. Company Financials
- 13.1.1.4. SWOT Analysis
- 13.1.2 China Rare Earth Holdings Limited
- 13.1.2.1. Company Overview
- 13.1.2.2. Products
- 13.1.2.3. Company Financials
- 13.1.2.4. SWOT Analysis
- 13.1.3 METALL RARE EARTH LIMITED
- 13.1.3.1. Company Overview
- 13.1.3.2. Products
- 13.1.3.3. Company Financials
- 13.1.3.4. SWOT Analysis
- 13.1.4 MP MATERIALS
- 13.1.4.1. Company Overview
- 13.1.4.2. Products
- 13.1.4.3. Company Financials
- 13.1.4.4. SWOT Analysis
- 13.1.5 NEO
- 13.1.5.1. Company Overview
- 13.1.5.2. Products
- 13.1.5.3. Company Financials
- 13.1.5.4. SWOT Analysis
- 13.1.6 Australian Strategic Materials Ltd
- 13.1.6.1. Company Overview
- 13.1.6.2. Products
- 13.1.6.3. Company Financials
- 13.1.6.4. SWOT Analysis
- 13.1.7 HEFA Rare Earth Canada Co Ltd
- 13.1.7.1. Company Overview
- 13.1.7.2. Products
- 13.1.7.3. Company Financials
- 13.1.7.4. SWOT Analysis
- 13.1.8 Arafura Resources
- 13.1.8.1. Company Overview
- 13.1.8.2. Products
- 13.1.8.3. Company Financials
- 13.1.8.4. SWOT Analysis
- 13.1.9 Peak Rare Earths
- 13.1.9.1. Company Overview
- 13.1.9.2. Products
- 13.1.9.3. Company Financials
- 13.1.9.4. SWOT Analysis
- 13.1.10 Rainbow Rare Earths Limited
- 13.1.10.1. Company Overview
- 13.1.10.2. Products
- 13.1.10.3. Company Financials
- 13.1.10.4. SWOT Analysis
- 13.1.1 Lynas Rare Earths Ltd
- 13.2. Market Entropy
- 13.2.1 Company's Key Areas Served
- 13.2.2 Recent Developments
- 13.3. Company Market Share Analysis 2025
- 13.3.1 Top 5 Companies Market Share Analysis
- 13.3.2 Top 3 Companies Market Share Analysis
- 13.4. List of Potential Customers
- 14. Research Methodology
List of Figures
- Figure 1: Global Neodymium Market Revenue Breakdown (billion, %) by Region 2025 & 2033
- Figure 2: Global Neodymium Market Volume Breakdown (K Tons, %) by Region 2025 & 2033
- Figure 3: Asia Pacific Neodymium Market Revenue (billion), by Application 2025 & 2033
- Figure 4: Asia Pacific Neodymium Market Volume (K Tons), by Application 2025 & 2033
- Figure 5: Asia Pacific Neodymium Market Revenue Share (%), by Application 2025 & 2033
- Figure 6: Asia Pacific Neodymium Market Volume Share (%), by Application 2025 & 2033
- Figure 7: Asia Pacific Neodymium Market Revenue (billion), by End-User Industry 2025 & 2033
- Figure 8: Asia Pacific Neodymium Market Volume (K Tons), by End-User Industry 2025 & 2033
- Figure 9: Asia Pacific Neodymium Market Revenue Share (%), by End-User Industry 2025 & 2033
- Figure 10: Asia Pacific Neodymium Market Volume Share (%), by End-User Industry 2025 & 2033
- Figure 11: Asia Pacific Neodymium Market Revenue (billion), by Country 2025 & 2033
- Figure 12: Asia Pacific Neodymium Market Volume (K Tons), by Country 2025 & 2033
- Figure 13: Asia Pacific Neodymium Market Revenue Share (%), by Country 2025 & 2033
- Figure 14: Asia Pacific Neodymium Market Volume Share (%), by Country 2025 & 2033
- Figure 15: North America Neodymium Market Revenue (billion), by Application 2025 & 2033
- Figure 16: North America Neodymium Market Volume (K Tons), by Application 2025 & 2033
- Figure 17: North America Neodymium Market Revenue Share (%), by Application 2025 & 2033
- Figure 18: North America Neodymium Market Volume Share (%), by Application 2025 & 2033
- Figure 19: North America Neodymium Market Revenue (billion), by End-User Industry 2025 & 2033
- Figure 20: North America Neodymium Market Volume (K Tons), by End-User Industry 2025 & 2033
- Figure 21: North America Neodymium Market Revenue Share (%), by End-User Industry 2025 & 2033
- Figure 22: North America Neodymium Market Volume Share (%), by End-User Industry 2025 & 2033
- Figure 23: North America Neodymium Market Revenue (billion), by Country 2025 & 2033
- Figure 24: North America Neodymium Market Volume (K Tons), by Country 2025 & 2033
- Figure 25: North America Neodymium Market Revenue Share (%), by Country 2025 & 2033
- Figure 26: North America Neodymium Market Volume Share (%), by Country 2025 & 2033
- Figure 27: Europe Neodymium Market Revenue (billion), by Application 2025 & 2033
- Figure 28: Europe Neodymium Market Volume (K Tons), by Application 2025 & 2033
- Figure 29: Europe Neodymium Market Revenue Share (%), by Application 2025 & 2033
- Figure 30: Europe Neodymium Market Volume Share (%), by Application 2025 & 2033
- Figure 31: Europe Neodymium Market Revenue (billion), by End-User Industry 2025 & 2033
- Figure 32: Europe Neodymium Market Volume (K Tons), by End-User Industry 2025 & 2033
- Figure 33: Europe Neodymium Market Revenue Share (%), by End-User Industry 2025 & 2033
- Figure 34: Europe Neodymium Market Volume Share (%), by End-User Industry 2025 & 2033
- Figure 35: Europe Neodymium Market Revenue (billion), by Country 2025 & 2033
- Figure 36: Europe Neodymium Market Volume (K Tons), by Country 2025 & 2033
- Figure 37: Europe Neodymium Market Revenue Share (%), by Country 2025 & 2033
- Figure 38: Europe Neodymium Market Volume Share (%), by Country 2025 & 2033
- Figure 39: South America Neodymium Market Revenue (billion), by Application 2025 & 2033
- Figure 40: South America Neodymium Market Volume (K Tons), by Application 2025 & 2033
- Figure 41: South America Neodymium Market Revenue Share (%), by Application 2025 & 2033
- Figure 42: South America Neodymium Market Volume Share (%), by Application 2025 & 2033
- Figure 43: South America Neodymium Market Revenue (billion), by End-User Industry 2025 & 2033
- Figure 44: South America Neodymium Market Volume (K Tons), by End-User Industry 2025 & 2033
- Figure 45: South America Neodymium Market Revenue Share (%), by End-User Industry 2025 & 2033
- Figure 46: South America Neodymium Market Volume Share (%), by End-User Industry 2025 & 2033
- Figure 47: South America Neodymium Market Revenue (billion), by Country 2025 & 2033
- Figure 48: South America Neodymium Market Volume (K Tons), by Country 2025 & 2033
- Figure 49: South America Neodymium Market Revenue Share (%), by Country 2025 & 2033
- Figure 50: South America Neodymium Market Volume Share (%), by Country 2025 & 2033
- Figure 51: Middle East Neodymium Market Revenue (billion), by Application 2025 & 2033
- Figure 52: Middle East Neodymium Market Volume (K Tons), by Application 2025 & 2033
- Figure 53: Middle East Neodymium Market Revenue Share (%), by Application 2025 & 2033
- Figure 54: Middle East Neodymium Market Volume Share (%), by Application 2025 & 2033
- Figure 55: Middle East Neodymium Market Revenue (billion), by End-User Industry 2025 & 2033
- Figure 56: Middle East Neodymium Market Volume (K Tons), by End-User Industry 2025 & 2033
- Figure 57: Middle East Neodymium Market Revenue Share (%), by End-User Industry 2025 & 2033
- Figure 58: Middle East Neodymium Market Volume Share (%), by End-User Industry 2025 & 2033
- Figure 59: Middle East Neodymium Market Revenue (billion), by Country 2025 & 2033
- Figure 60: Middle East Neodymium Market Volume (K Tons), by Country 2025 & 2033
- Figure 61: Middle East Neodymium Market Revenue Share (%), by Country 2025 & 2033
- Figure 62: Middle East Neodymium Market Volume Share (%), by Country 2025 & 2033
- Figure 63: Saudi Arabia Neodymium Market Revenue (billion), by Application 2025 & 2033
- Figure 64: Saudi Arabia Neodymium Market Volume (K Tons), by Application 2025 & 2033
- Figure 65: Saudi Arabia Neodymium Market Revenue Share (%), by Application 2025 & 2033
- Figure 66: Saudi Arabia Neodymium Market Volume Share (%), by Application 2025 & 2033
- Figure 67: Saudi Arabia Neodymium Market Revenue (billion), by End-User Industry 2025 & 2033
- Figure 68: Saudi Arabia Neodymium Market Volume (K Tons), by End-User Industry 2025 & 2033
- Figure 69: Saudi Arabia Neodymium Market Revenue Share (%), by End-User Industry 2025 & 2033
- Figure 70: Saudi Arabia Neodymium Market Volume Share (%), by End-User Industry 2025 & 2033
- Figure 71: Saudi Arabia Neodymium Market Revenue (billion), by Country 2025 & 2033
- Figure 72: Saudi Arabia Neodymium Market Volume (K Tons), by Country 2025 & 2033
- Figure 73: Saudi Arabia Neodymium Market Revenue Share (%), by Country 2025 & 2033
- Figure 74: Saudi Arabia Neodymium Market Volume Share (%), by Country 2025 & 2033
List of Tables
- Table 1: Global Neodymium Market Revenue billion Forecast, by Application 2020 & 2033
- Table 2: Global Neodymium Market Volume K Tons Forecast, by Application 2020 & 2033
- Table 3: Global Neodymium Market Revenue billion Forecast, by End-User Industry 2020 & 2033
- Table 4: Global Neodymium Market Volume K Tons Forecast, by End-User Industry 2020 & 2033
- Table 5: Global Neodymium Market Revenue billion Forecast, by Region 2020 & 2033
- Table 6: Global Neodymium Market Volume K Tons Forecast, by Region 2020 & 2033
- Table 7: Global Neodymium Market Revenue billion Forecast, by Application 2020 & 2033
- Table 8: Global Neodymium Market Volume K Tons Forecast, by Application 2020 & 2033
- Table 9: Global Neodymium Market Revenue billion Forecast, by End-User Industry 2020 & 2033
- Table 10: Global Neodymium Market Volume K Tons Forecast, by End-User Industry 2020 & 2033
- Table 11: Global Neodymium Market Revenue billion Forecast, by Country 2020 & 2033
- Table 12: Global Neodymium Market Volume K Tons Forecast, by Country 2020 & 2033
- Table 13: China Neodymium Market Revenue (billion) Forecast, by Application 2020 & 2033
- Table 14: China Neodymium Market Volume (K Tons) Forecast, by Application 2020 & 2033
- Table 15: India Neodymium Market Revenue (billion) Forecast, by Application 2020 & 2033
- Table 16: India Neodymium Market Volume (K Tons) Forecast, by Application 2020 & 2033
- Table 17: Japan Neodymium Market Revenue (billion) Forecast, by Application 2020 & 2033
- Table 18: Japan Neodymium Market Volume (K Tons) Forecast, by Application 2020 & 2033
- Table 19: South Korea Neodymium Market Revenue (billion) Forecast, by Application 2020 & 2033
- Table 20: South Korea Neodymium Market Volume (K Tons) Forecast, by Application 2020 & 2033
- Table 21: Rest of Asia Pacific Neodymium Market Revenue (billion) Forecast, by Application 2020 & 2033
- Table 22: Rest of Asia Pacific Neodymium Market Volume (K Tons) Forecast, by Application 2020 & 2033
- Table 23: Global Neodymium Market Revenue billion Forecast, by Application 2020 & 2033
- Table 24: Global Neodymium Market Volume K Tons Forecast, by Application 2020 & 2033
- Table 25: Global Neodymium Market Revenue billion Forecast, by End-User Industry 2020 & 2033
- Table 26: Global Neodymium Market Volume K Tons Forecast, by End-User Industry 2020 & 2033
- Table 27: Global Neodymium Market Revenue billion Forecast, by Country 2020 & 2033
- Table 28: Global Neodymium Market Volume K Tons Forecast, by Country 2020 & 2033
- Table 29: United States Neodymium Market Revenue (billion) Forecast, by Application 2020 & 2033
- Table 30: United States Neodymium Market Volume (K Tons) Forecast, by Application 2020 & 2033
- Table 31: Canada Neodymium Market Revenue (billion) Forecast, by Application 2020 & 2033
- Table 32: Canada Neodymium Market Volume (K Tons) Forecast, by Application 2020 & 2033
- Table 33: Mexico Neodymium Market Revenue (billion) Forecast, by Application 2020 & 2033
- Table 34: Mexico Neodymium Market Volume (K Tons) Forecast, by Application 2020 & 2033
- Table 35: Global Neodymium Market Revenue billion Forecast, by Application 2020 & 2033
- Table 36: Global Neodymium Market Volume K Tons Forecast, by Application 2020 & 2033
- Table 37: Global Neodymium Market Revenue billion Forecast, by End-User Industry 2020 & 2033
- Table 38: Global Neodymium Market Volume K Tons Forecast, by End-User Industry 2020 & 2033
- Table 39: Global Neodymium Market Revenue billion Forecast, by Country 2020 & 2033
- Table 40: Global Neodymium Market Volume K Tons Forecast, by Country 2020 & 2033
- Table 41: Germany Neodymium Market Revenue (billion) Forecast, by Application 2020 & 2033
- Table 42: Germany Neodymium Market Volume (K Tons) Forecast, by Application 2020 & 2033
- Table 43: United Kingdom Neodymium Market Revenue (billion) Forecast, by Application 2020 & 2033
- Table 44: United Kingdom Neodymium Market Volume (K Tons) Forecast, by Application 2020 & 2033
- Table 45: Italy Neodymium Market Revenue (billion) Forecast, by Application 2020 & 2033
- Table 46: Italy Neodymium Market Volume (K Tons) Forecast, by Application 2020 & 2033
- Table 47: France Neodymium Market Revenue (billion) Forecast, by Application 2020 & 2033
- Table 48: France Neodymium Market Volume (K Tons) Forecast, by Application 2020 & 2033
- Table 49: Rest of Europe Neodymium Market Revenue (billion) Forecast, by Application 2020 & 2033
- Table 50: Rest of Europe Neodymium Market Volume (K Tons) Forecast, by Application 2020 & 2033
- Table 51: Global Neodymium Market Revenue billion Forecast, by Application 2020 & 2033
- Table 52: Global Neodymium Market Volume K Tons Forecast, by Application 2020 & 2033
- Table 53: Global Neodymium Market Revenue billion Forecast, by End-User Industry 2020 & 2033
- Table 54: Global Neodymium Market Volume K Tons Forecast, by End-User Industry 2020 & 2033
- Table 55: Global Neodymium Market Revenue billion Forecast, by Country 2020 & 2033
- Table 56: Global Neodymium Market Volume K Tons Forecast, by Country 2020 & 2033
- Table 57: Brazil Neodymium Market Revenue (billion) Forecast, by Application 2020 & 2033
- Table 58: Brazil Neodymium Market Volume (K Tons) Forecast, by Application 2020 & 2033
- Table 59: Argentina Neodymium Market Revenue (billion) Forecast, by Application 2020 & 2033
- Table 60: Argentina Neodymium Market Volume (K Tons) Forecast, by Application 2020 & 2033
- Table 61: Rest of South America Neodymium Market Revenue (billion) Forecast, by Application 2020 & 2033
- Table 62: Rest of South America Neodymium Market Volume (K Tons) Forecast, by Application 2020 & 2033
- Table 63: Global Neodymium Market Revenue billion Forecast, by Application 2020 & 2033
- Table 64: Global Neodymium Market Volume K Tons Forecast, by Application 2020 & 2033
- Table 65: Global Neodymium Market Revenue billion Forecast, by End-User Industry 2020 & 2033
- Table 66: Global Neodymium Market Volume K Tons Forecast, by End-User Industry 2020 & 2033
- Table 67: Global Neodymium Market Revenue billion Forecast, by Country 2020 & 2033
- Table 68: Global Neodymium Market Volume K Tons Forecast, by Country 2020 & 2033
- Table 69: Global Neodymium Market Revenue billion Forecast, by Application 2020 & 2033
- Table 70: Global Neodymium Market Volume K Tons Forecast, by Application 2020 & 2033
- Table 71: Global Neodymium Market Revenue billion Forecast, by End-User Industry 2020 & 2033
- Table 72: Global Neodymium Market Volume K Tons Forecast, by End-User Industry 2020 & 2033
- Table 73: Global Neodymium Market Revenue billion Forecast, by Country 2020 & 2033
- Table 74: Global Neodymium Market Volume K Tons Forecast, by Country 2020 & 2033
- Table 75: South Africa Neodymium Market Revenue (billion) Forecast, by Application 2020 & 2033
- Table 76: South Africa Neodymium Market Volume (K Tons) Forecast, by Application 2020 & 2033
- Table 77: Rest of Middle East Neodymium Market Revenue (billion) Forecast, by Application 2020 & 2033
- Table 78: Rest of Middle East Neodymium Market Volume (K Tons) Forecast, by Application 2020 & 2033
Frequently Asked Questions
1. What is the projected Compound Annual Growth Rate (CAGR) of the Neodymium Market?
The projected CAGR is approximately 6.7%.
2. Which companies are prominent players in the Neodymium Market?
Key companies in the market include Lynas Rare Earths Ltd, China Rare Earth Holdings Limited, METALL RARE EARTH LIMITED, MP MATERIALS, NEO, Australian Strategic Materials Ltd, HEFA Rare Earth Canada Co Ltd, Arafura Resources, Peak Rare Earths, Rainbow Rare Earths Limited.
3. What are the main segments of the Neodymium Market?
The market segments include Application, End-User Industry.
4. Can you provide details about the market size?
The market size is estimated to be USD 5.28 billion as of 2022.
5. What are some drivers contributing to market growth?
Rising Demand for Neodymium Magnets from Wind Energy and Electric Vehicle Industries; Other Drivers.
6. What are the notable trends driving market growth?
Automotive Segment to Dominate the Market.
7. Are there any restraints impacting market growth?
Availability of Less-Expensive Substitutes; Other Restraints.
8. Can you provide examples of recent developments in the market?
February 2023: MP Materials and Sumitomo Corporation entered into an agreement to diversify and strengthen rare earth supplies in Japan. Under the agreement, Sumitomo Corporation becomes the exclusive distributor of neodymium and praseodymium (NdPr) oxide produced by MP Materials.
9. What pricing options are available for accessing the report?
Pricing options include single-user, multi-user, and enterprise licenses priced at USD 4750, USD 5250, and USD 8750 respectively.
10. Is the market size provided in terms of value or volume?
The market size is provided in terms of value, measured in billion and volume, measured in K Tons.
11. Are there any specific market keywords associated with the report?
Yes, the market keyword associated with the report is "Neodymium Market," which aids in identifying and referencing the specific market segment covered.
12. How do I determine which pricing option suits my needs best?
The pricing options vary based on user requirements and access needs. Individual users may opt for single-user licenses, while businesses requiring broader access may choose multi-user or enterprise licenses for cost-effective access to the report.
13. Are there any additional resources or data provided in the Neodymium Market report?
While the report offers comprehensive insights, it's advisable to review the specific contents or supplementary materials provided to ascertain if additional resources or data are available.
14. How can I stay updated on further developments or reports in the Neodymium Market?
To stay informed about further developments, trends, and reports in the Neodymium Market, consider subscribing to industry newsletters, following relevant companies and organizations, or regularly checking reputable industry news sources and publications.
Methodology
Step 1 - Identification of Relevant Samples Size from Population Database


Step 2 - Approaches for Defining Global Market Size (Value, Volume* & Price*)

Note*: In applicable scenarios
Step 3 - Data Sources
Primary Research
- Web Analytics
- Survey Reports
- Research Institute
- Latest Research Reports
- Opinion Leaders
Secondary Research
- Annual Reports
- White Paper
- Latest Press Release
- Industry Association
- Paid Database
- Investor Presentations

Step 4 - Data Triangulation
Involves using different sources of information in order to increase the validity of a study
These sources are likely to be stakeholders in a program - participants, other researchers, program staff, other community members, and so on.
Then we put all data in single framework & apply various statistical tools to find out the dynamic on the market.
During the analysis stage, feedback from the stakeholder groups would be compared to determine areas of agreement as well as areas of divergence