

Key Insights
The Non-Halogenated Flame Retardants (NHFR) market is exhibiting significant expansion, propelled by escalating demand for safer, eco-friendly alternatives to conventional halogenated flame retardants. The market is projected to reach $10.59 billion by 2025, with a projected Compound Annual Growth Rate (CAGR) of 12.02% through 2033. This growth trajectory is driven by increasingly stringent environmental regulations aimed at mitigating the ecological impact of hazardous substances and heightened awareness of health risks associated with halogenated compounds. Key growth catalysts include the widespread adoption of NHFRs across various industries, such as electronics, construction, automotive, and textiles, underscoring their growing utility in rapidly expanding sectors like electric vehicles and renewable energy infrastructure. The inorganic segment currently holds a substantial market share due to its established applications and cost-effectiveness. However, the organic segment is anticipated to experience considerable growth owing to the development of innovative, high-performance materials. Among flame retardant types, phosphorus-based solutions lead the market due to their superior performance. Nonetheless, nitrogen-based and other segment categories are expected to demonstrate rapid expansion, fueled by technological advancements and broadening application scope.
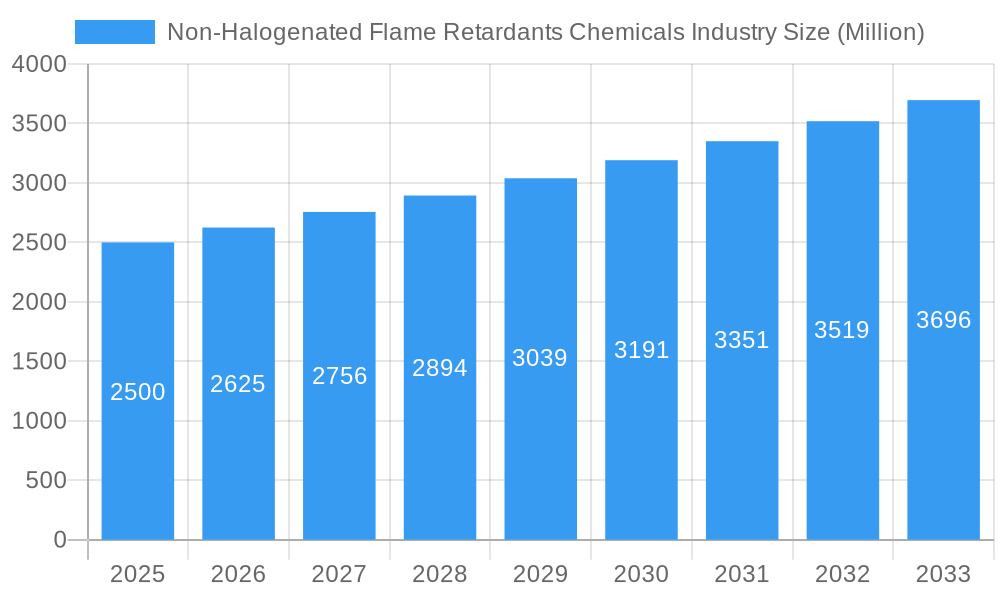
Non-Halogenated Flame Retardants Chemicals Industry Market Size (In Billion)
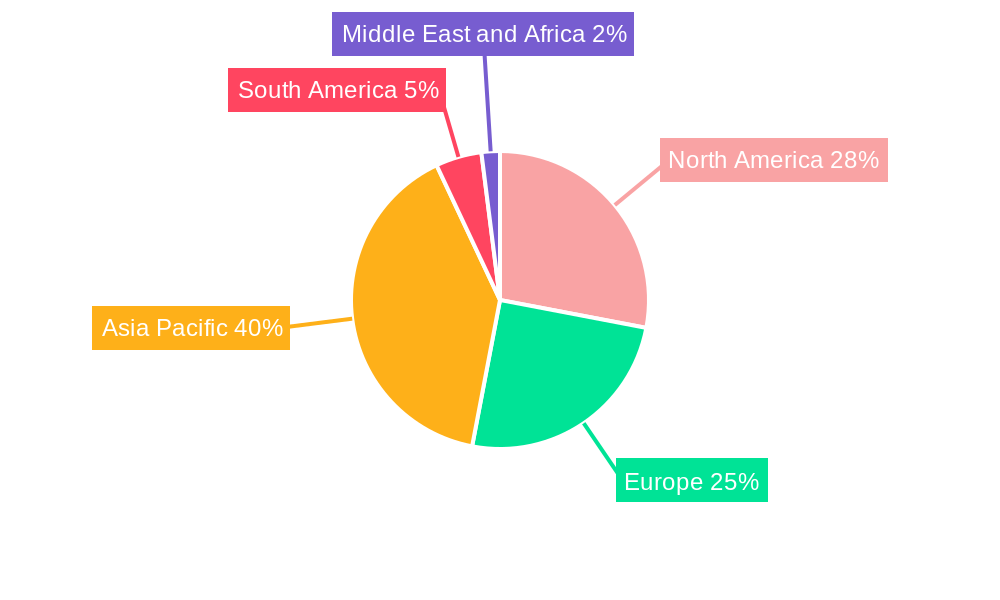
Geographic expansion presents substantial growth prospects, with the Asia-Pacific region anticipated to lead the market, driven by rapid industrialization and significant infrastructure investments. North America and Europe will also contribute robustly, primarily due to stringent environmental mandates and the embrace of sustainable practices. The competitive landscape is highly dynamic, featuring established chemical conglomerates and specialized manufacturers actively pursuing market share. Innovation in material science and strategic collaborations will be pivotal in defining the future competitive environment. Continued growth will depend on advancements in material science, leading to the development of more effective and sustainable NHFR solutions, alongside supportive governmental regulations promoting the transition away from halogenated alternatives.
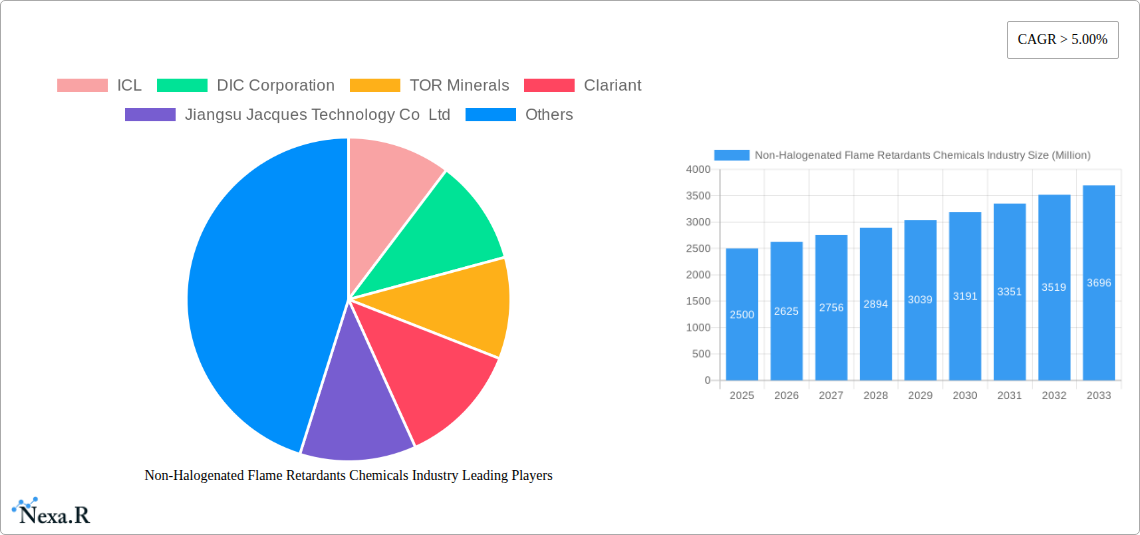
Non-Halogenated Flame Retardants Chemicals Industry Company Market Share
Non-Halogenated Flame Retardants Chemicals Market Report: 2019-2033
This comprehensive report provides a detailed analysis of the Non-Halogenated Flame Retardants Chemicals industry, encompassing market dynamics, growth trends, regional landscapes, and key players. The study period covers 2019-2033, with 2025 as the base and estimated year. This report is crucial for industry professionals, investors, and strategic decision-makers seeking a thorough understanding of this rapidly evolving market. The market value is projected to reach xx Million by 2033.
Non-Halogenated Flame Retardants Chemicals Industry Market Dynamics & Structure
This section delves into the intricate structure of the Non-Halogenated Flame Retardants Chemicals market, analyzing market concentration, technological advancements, regulatory landscapes, competitive dynamics, and end-user demographics. We examine the impact of mergers and acquisitions (M&A) activities on market consolidation and assess the intensity of competition among key players.
- Market Concentration: The market exhibits a moderately concentrated structure, with the top five players holding approximately xx% of the global market share in 2025.
- Technological Innovation: Ongoing R&D efforts focus on enhancing flame retardant efficacy, reducing environmental impact, and expanding applications across diverse end-user industries. Innovation barriers include high R&D costs and stringent regulatory approvals.
- Regulatory Frameworks: Stringent environmental regulations, particularly concerning halogenated flame retardants, are driving the adoption of non-halogenated alternatives. Regional variations in regulatory stringency impact market growth.
- Competitive Product Substitutes: Competition exists from other fire-resistant materials and alternative flame-retardant technologies. The intensity of substitution varies across different end-use sectors.
- End-User Demographics: The Electrical & Electronics, Building & Construction, and Transportation sectors represent significant end-user segments, driving substantial demand for non-halogenated flame retardants. Shifts in construction practices and technological advancements in electronics influence consumption patterns.
- M&A Trends: The industry has witnessed a moderate level of M&A activity in recent years, with xx deals recorded between 2019 and 2024, primarily aimed at expanding product portfolios and geographical reach. This activity is expected to continue, albeit at a similar pace.
Non-Halogenated Flame Retardants Chemicals Industry Growth Trends & Insights
This section provides a detailed analysis of the market size evolution, adoption rates across various end-use sectors, and the influence of technological disruptions on market growth. We project a Compound Annual Growth Rate (CAGR) of xx% during the forecast period (2025-2033). Market penetration varies significantly across different geographical regions and end-use sectors. Consumer preference for eco-friendly materials and enhanced safety standards are key factors driving market growth. The shift towards sustainable building practices and advancements in electric vehicles are major catalysts. Detailed analysis of consumer behavior shifts and their impact on market dynamics is included.
Dominant Regions, Countries, or Segments in Non-Halogenated Flame Retardants Chemicals Industry
This section identifies the leading regions, countries, and segments within the Non-Halogenated Flame Retardants Chemicals market, analyzing their market share and growth potential.
By Type:
- Inorganic: This segment holds a xx% market share in 2025 and is projected to witness significant growth owing to its superior thermal stability and cost-effectiveness.
- Organic: This segment accounts for xx% of the market in 2025, driven by advancements in performance and increasing demand from the electronics industry.
- Boron Compounds: The phosphorus segment leads with a xx% share, while Nitrogen holds xx%, and other types constitute the remaining xx%.
- Phosphorus: This segment enjoys strong demand due to its wide applicability and relative cost-effectiveness.
- Nitrogen: The nitrogen segment witnesses moderate growth due to its specific applications in certain end-use sectors.
By End-User Industry:
- Electrical and Electronics: This segment is the largest end-use sector, driven by stringent safety standards and the growing adoption of electronics.
- Buildings and Construction: This sector presents significant growth opportunities, particularly in developing economies with robust infrastructure development.
- Transportation: The increasing demand for electric vehicles and stringent safety regulations in the automotive industry are boosting market growth in this sector.
- Textiles and Furniture: This sector displays a steady market growth, driven by rising consumer awareness of fire safety.
Non-Halogenated Flame Retardants Chemicals Industry Product Landscape
The non-halogenated flame retardant chemicals market showcases a diverse product landscape, featuring both inorganic and organic compounds. Innovations focus on enhancing flame retardancy efficiency, improving processability, and reducing environmental impact. Key performance metrics include flame retardancy rating, thermal stability, and chemical resistance. Unique selling propositions include superior performance, eco-friendly attributes, and compatibility with diverse materials. Technological advancements are continually improving product performance and expanding application possibilities.
Key Drivers, Barriers & Challenges in Non-Halogenated Flame Retardants Chemicals Industry
Key Drivers:
Stringent regulations banning halogenated flame retardants, increasing awareness of fire safety, and growth in end-use sectors such as electronics, construction, and transportation are major drivers. Government initiatives promoting sustainable materials and technological advancements in flame retardant chemistry also contribute significantly.
Challenges & Restraints:
High raw material costs, stringent regulatory compliance requirements, and intense competition among established players pose significant challenges. Supply chain disruptions and fluctuations in raw material prices also impact market dynamics.
Emerging Opportunities in Non-Halogenated Flame Retardants Chemicals Industry
Untapped markets in developing economies, particularly in Asia and Latin America, present significant opportunities. The rising demand for flame retardants in renewable energy applications, such as wind turbines and solar panels, also offers substantial growth prospects. The development of novel flame retardants with enhanced performance and reduced environmental impact continues to be a key area of focus. Innovation in specific application areas like high-temperature applications remains a key opportunity.
Growth Accelerators in the Non-Halogenated Flame Retardants Chemicals Industry
Technological advancements, strategic partnerships, and market expansion into new geographical regions will play a crucial role in accelerating long-term growth. The development of innovative flame retardant formulations tailored to specific applications will be a key driver of market expansion.
Key Players Shaping the Non-Halogenated Flame Retardants Chemicals Market
- ICL
- DIC Corporation
- TOR Minerals
- Clariant
- Jiangsu Jacques Technology Co Ltd
- MPI Chemie BV
- Italmatch Chemicals SpA
- LANXESS
- Nippon Carbide Industries Co Inc (Sanwa Chemical Industry Co Ltd)
- BASF SE
- Rin Kagaku Kogyo Co Ltd
- Shandong Brother Sci & Tech Co Ltd
- Nabaltec AG
- Thor
- Eti Maden
- Apexical Inc
- NYACOL Nano Technologies Inc
- Huber Engineered Materials
- Daihachi Chemical Industry Co Ltd
Notable Milestones in Non-Halogenated Flame Retardants Chemicals Industry Sector
- 2020: ICL launched a new line of phosphorus-based flame retardants with enhanced performance.
- 2021: A significant merger occurred between two key players, resulting in expanded market share.
- 2022: New regulations regarding flame retardant usage came into effect in several key markets.
- 2023: A leading company announced a new R&D initiative to develop sustainable flame retardant solutions. (Further milestones would be added based on actual data.)
In-Depth Non-Halogenated Flame Retardants Chemicals Industry Market Outlook
The Non-Halogenated Flame Retardants Chemicals market is poised for robust growth driven by a combination of regulatory pressures, technological advancements, and increasing demand across diverse end-use sectors. Strategic partnerships, focused R&D efforts, and expansion into high-growth regions present significant opportunities for industry players. The future potential is promising, with significant market expansion anticipated in the coming years.
Non-Halogenated Flame Retardants Chemicals Industry Segmentation
-
1. Type
-
1.1. Inorganic
- 1.1.1. Aluminum Hydroxide
- 1.1.2. Magnesium Hydroxide
- 1.1.3. Boron Compounds
- 1.2. Phosphorus
- 1.3. Nitrogen
- 1.4. Other Types
-
1.1. Inorganic
-
2. End-user Industry
- 2.1. Electrical and Electronics
- 2.2. Buildings and Construction
- 2.3. Transportation
- 2.4. Textiles and Furniture
Non-Halogenated Flame Retardants Chemicals Industry Segmentation By Geography
-
1. Asia Pacific
- 1.1. China
- 1.2. India
- 1.3. Japan
- 1.4. South Korea
- 1.5. Rest of Asia Pacific
-
2. North America
- 2.1. United States
- 2.2. Canada
- 2.3. Mexico
-
3. Europe
- 3.1. Germany
- 3.2. United Kingdom
- 3.3. Italy
- 3.4. France
- 3.5. Rest of Europe
-
4. South America
- 4.1. Brazil
- 4.2. Argentina
- 4.3. Rest of South America
-
5. Middle East and Africa
- 5.1. Saudi Arabia
- 5.2. South Africa
- 5.3. Rest of Middle East and Africa
Non-Halogenated Flame Retardants Chemicals Industry Regional Market Share
Geographic Coverage of Non-Halogenated Flame Retardants Chemicals Industry
Non-Halogenated Flame Retardants Chemicals Industry REPORT HIGHLIGHTS
| Aspects | Details |
|---|---|
| Study Period | 2020-2034 |
| Base Year | 2025 |
| Estimated Year | 2026 |
| Forecast Period | 2026-2034 |
| Historical Period | 2020-2025 |
| Growth Rate | CAGR of 12.02% from 2020-2034 |
| Segmentation |
|
Table of Contents
- 1. Introduction
- 1.1. Research Scope
- 1.2. Market Segmentation
- 1.3. Research Objective
- 1.4. Definitions and Assumptions
- 2. Executive Summary
- 2.1. Market Snapshot
- 3. Market Dynamics
- 3.1. Market Drivers
- 3.2. Market Restrains
- 3.3. Market Trends
- 3.4. Market Opportunities
- 4. Market Factor Analysis
- 4.1. Porters Five Forces
- 4.1.1. Bargaining Power of Suppliers
- 4.1.2. Bargaining Power of Buyers
- 4.1.3. Threat of New Entrants
- 4.1.4. Threat of Substitutes
- 4.1.5. Competitive Rivalry
- 4.2. PESTEL analysis
- 4.3. BCG Analysis
- 4.3.1. Stars (High Growth, High Market Share)
- 4.3.2. Cash Cows (Low Growth, High Market Share)
- 4.3.3. Question Mark (High Growth, Low Market Share)
- 4.3.4. Dogs (Low Growth, Low Market Share)
- 4.4. Ansoff Matrix Analysis
- 4.5. Supply Chain Analysis
- 4.6. Regulatory Landscape
- 4.7. Current Market Potential and Opportunity Assessment (TAM–SAM–SOM Framework)
- 4.8. NRP Analyst Note
- 4.1. Porters Five Forces
- 5. Market Analysis, Insights and Forecast 2021-2033
- 5.1. Market Analysis, Insights and Forecast - by Type
- 5.1.1. Inorganic
- 5.1.1.1. Aluminum Hydroxide
- 5.1.1.2. Magnesium Hydroxide
- 5.1.1.3. Boron Compounds
- 5.1.2. Phosphorus
- 5.1.3. Nitrogen
- 5.1.4. Other Types
- 5.1.1. Inorganic
- 5.2. Market Analysis, Insights and Forecast - by End-user Industry
- 5.2.1. Electrical and Electronics
- 5.2.2. Buildings and Construction
- 5.2.3. Transportation
- 5.2.4. Textiles and Furniture
- 5.3. Market Analysis, Insights and Forecast - by Region
- 5.3.1. Asia Pacific
- 5.3.2. North America
- 5.3.3. Europe
- 5.3.4. South America
- 5.3.5. Middle East and Africa
- 5.1. Market Analysis, Insights and Forecast - by Type
- 6. Global Non-Halogenated Flame Retardants Chemicals Industry Analysis, Insights and Forecast, 2021-2033
- 6.1. Market Analysis, Insights and Forecast - by Type
- 6.1.1. Inorganic
- 6.1.1.1. Aluminum Hydroxide
- 6.1.1.2. Magnesium Hydroxide
- 6.1.1.3. Boron Compounds
- 6.1.2. Phosphorus
- 6.1.3. Nitrogen
- 6.1.4. Other Types
- 6.1.1. Inorganic
- 6.2. Market Analysis, Insights and Forecast - by End-user Industry
- 6.2.1. Electrical and Electronics
- 6.2.2. Buildings and Construction
- 6.2.3. Transportation
- 6.2.4. Textiles and Furniture
- 6.1. Market Analysis, Insights and Forecast - by Type
- 7. Asia Pacific Non-Halogenated Flame Retardants Chemicals Industry Analysis, Insights and Forecast, 2020-2032
- 7.1. Market Analysis, Insights and Forecast - by Type
- 7.1.1. Inorganic
- 7.1.1.1. Aluminum Hydroxide
- 7.1.1.2. Magnesium Hydroxide
- 7.1.1.3. Boron Compounds
- 7.1.2. Phosphorus
- 7.1.3. Nitrogen
- 7.1.4. Other Types
- 7.1.1. Inorganic
- 7.2. Market Analysis, Insights and Forecast - by End-user Industry
- 7.2.1. Electrical and Electronics
- 7.2.2. Buildings and Construction
- 7.2.3. Transportation
- 7.2.4. Textiles and Furniture
- 7.1. Market Analysis, Insights and Forecast - by Type
- 8. North America Non-Halogenated Flame Retardants Chemicals Industry Analysis, Insights and Forecast, 2020-2032
- 8.1. Market Analysis, Insights and Forecast - by Type
- 8.1.1. Inorganic
- 8.1.1.1. Aluminum Hydroxide
- 8.1.1.2. Magnesium Hydroxide
- 8.1.1.3. Boron Compounds
- 8.1.2. Phosphorus
- 8.1.3. Nitrogen
- 8.1.4. Other Types
- 8.1.1. Inorganic
- 8.2. Market Analysis, Insights and Forecast - by End-user Industry
- 8.2.1. Electrical and Electronics
- 8.2.2. Buildings and Construction
- 8.2.3. Transportation
- 8.2.4. Textiles and Furniture
- 8.1. Market Analysis, Insights and Forecast - by Type
- 9. Europe Non-Halogenated Flame Retardants Chemicals Industry Analysis, Insights and Forecast, 2020-2032
- 9.1. Market Analysis, Insights and Forecast - by Type
- 9.1.1. Inorganic
- 9.1.1.1. Aluminum Hydroxide
- 9.1.1.2. Magnesium Hydroxide
- 9.1.1.3. Boron Compounds
- 9.1.2. Phosphorus
- 9.1.3. Nitrogen
- 9.1.4. Other Types
- 9.1.1. Inorganic
- 9.2. Market Analysis, Insights and Forecast - by End-user Industry
- 9.2.1. Electrical and Electronics
- 9.2.2. Buildings and Construction
- 9.2.3. Transportation
- 9.2.4. Textiles and Furniture
- 9.1. Market Analysis, Insights and Forecast - by Type
- 10. South America Non-Halogenated Flame Retardants Chemicals Industry Analysis, Insights and Forecast, 2020-2032
- 10.1. Market Analysis, Insights and Forecast - by Type
- 10.1.1. Inorganic
- 10.1.1.1. Aluminum Hydroxide
- 10.1.1.2. Magnesium Hydroxide
- 10.1.1.3. Boron Compounds
- 10.1.2. Phosphorus
- 10.1.3. Nitrogen
- 10.1.4. Other Types
- 10.1.1. Inorganic
- 10.2. Market Analysis, Insights and Forecast - by End-user Industry
- 10.2.1. Electrical and Electronics
- 10.2.2. Buildings and Construction
- 10.2.3. Transportation
- 10.2.4. Textiles and Furniture
- 10.1. Market Analysis, Insights and Forecast - by Type
- 11. Middle East and Africa Non-Halogenated Flame Retardants Chemicals Industry Analysis, Insights and Forecast, 2020-2032
- 11.1. Market Analysis, Insights and Forecast - by Type
- 11.1.1. Inorganic
- 11.1.1.1. Aluminum Hydroxide
- 11.1.1.2. Magnesium Hydroxide
- 11.1.1.3. Boron Compounds
- 11.1.2. Phosphorus
- 11.1.3. Nitrogen
- 11.1.4. Other Types
- 11.1.1. Inorganic
- 11.2. Market Analysis, Insights and Forecast - by End-user Industry
- 11.2.1. Electrical and Electronics
- 11.2.2. Buildings and Construction
- 11.2.3. Transportation
- 11.2.4. Textiles and Furniture
- 11.1. Market Analysis, Insights and Forecast - by Type
- 12. Competitive Analysis
- 12.1. Company Profiles
- 12.1.1 ICL
- 12.1.1.1. Company Overview
- 12.1.1.2. Products
- 12.1.1.3. Company Financials
- 12.1.1.4. SWOT Analysis
- 12.1.2 DIC Corporation
- 12.1.2.1. Company Overview
- 12.1.2.2. Products
- 12.1.2.3. Company Financials
- 12.1.2.4. SWOT Analysis
- 12.1.3 TOR Minerals
- 12.1.3.1. Company Overview
- 12.1.3.2. Products
- 12.1.3.3. Company Financials
- 12.1.3.4. SWOT Analysis
- 12.1.4 Clariant
- 12.1.4.1. Company Overview
- 12.1.4.2. Products
- 12.1.4.3. Company Financials
- 12.1.4.4. SWOT Analysis
- 12.1.5 Jiangsu Jacques Technology Co Ltd
- 12.1.5.1. Company Overview
- 12.1.5.2. Products
- 12.1.5.3. Company Financials
- 12.1.5.4. SWOT Analysis
- 12.1.6 MPI Chemie BV
- 12.1.6.1. Company Overview
- 12.1.6.2. Products
- 12.1.6.3. Company Financials
- 12.1.6.4. SWOT Analysis
- 12.1.7 Italmatch Chemicals SpA
- 12.1.7.1. Company Overview
- 12.1.7.2. Products
- 12.1.7.3. Company Financials
- 12.1.7.4. SWOT Analysis
- 12.1.8 LANXESS
- 12.1.8.1. Company Overview
- 12.1.8.2. Products
- 12.1.8.3. Company Financials
- 12.1.8.4. SWOT Analysis
- 12.1.9 Nippon Carbide Indestries Co Inc (Sanwa Chemical Industry Co Ltd)
- 12.1.9.1. Company Overview
- 12.1.9.2. Products
- 12.1.9.3. Company Financials
- 12.1.9.4. SWOT Analysis
- 12.1.10 BASF SE
- 12.1.10.1. Company Overview
- 12.1.10.2. Products
- 12.1.10.3. Company Financials
- 12.1.10.4. SWOT Analysis
- 12.1.11 Rin Kagaku Kogyo Co Ltd
- 12.1.11.1. Company Overview
- 12.1.11.2. Products
- 12.1.11.3. Company Financials
- 12.1.11.4. SWOT Analysis
- 12.1.12 Shandong Brother Sci &Tech Co Ltd
- 12.1.12.1. Company Overview
- 12.1.12.2. Products
- 12.1.12.3. Company Financials
- 12.1.12.4. SWOT Analysis
- 12.1.13 Nabaltec AG
- 12.1.13.1. Company Overview
- 12.1.13.2. Products
- 12.1.13.3. Company Financials
- 12.1.13.4. SWOT Analysis
- 12.1.14 Thor
- 12.1.14.1. Company Overview
- 12.1.14.2. Products
- 12.1.14.3. Company Financials
- 12.1.14.4. SWOT Analysis
- 12.1.15 Eti Maden
- 12.1.15.1. Company Overview
- 12.1.15.2. Products
- 12.1.15.3. Company Financials
- 12.1.15.4. SWOT Analysis
- 12.1.16 Apexical Inc
- 12.1.16.1. Company Overview
- 12.1.16.2. Products
- 12.1.16.3. Company Financials
- 12.1.16.4. SWOT Analysis
- 12.1.17 NYACOL Nano Technologies Inc
- 12.1.17.1. Company Overview
- 12.1.17.2. Products
- 12.1.17.3. Company Financials
- 12.1.17.4. SWOT Analysis
- 12.1.18 Huber Engineered Materials
- 12.1.18.1. Company Overview
- 12.1.18.2. Products
- 12.1.18.3. Company Financials
- 12.1.18.4. SWOT Analysis
- 12.1.19 Daihachi Chemical Industry Co Ltd
- 12.1.19.1. Company Overview
- 12.1.19.2. Products
- 12.1.19.3. Company Financials
- 12.1.19.4. SWOT Analysis
- 12.1.1 ICL
- 12.2. Market Entropy
- 12.2.1 Company's Key Areas Served
- 12.2.2 Recent Developments
- 12.3. Company Market Share Analysis 2025
- 12.3.1 Top 5 Companies Market Share Analysis
- 12.3.2 Top 3 Companies Market Share Analysis
- 12.4. List of Potential Customers
- 13. Research Methodology
List of Figures
- Figure 1: Global Non-Halogenated Flame Retardants Chemicals Industry Revenue Breakdown (billion, %) by Region 2025 & 2033
- Figure 2: Global Non-Halogenated Flame Retardants Chemicals Industry Volume Breakdown (K Tons, %) by Region 2025 & 2033
- Figure 3: Asia Pacific Non-Halogenated Flame Retardants Chemicals Industry Revenue (billion), by Type 2025 & 2033
- Figure 4: Asia Pacific Non-Halogenated Flame Retardants Chemicals Industry Volume (K Tons), by Type 2025 & 2033
- Figure 5: Asia Pacific Non-Halogenated Flame Retardants Chemicals Industry Revenue Share (%), by Type 2025 & 2033
- Figure 6: Asia Pacific Non-Halogenated Flame Retardants Chemicals Industry Volume Share (%), by Type 2025 & 2033
- Figure 7: Asia Pacific Non-Halogenated Flame Retardants Chemicals Industry Revenue (billion), by End-user Industry 2025 & 2033
- Figure 8: Asia Pacific Non-Halogenated Flame Retardants Chemicals Industry Volume (K Tons), by End-user Industry 2025 & 2033
- Figure 9: Asia Pacific Non-Halogenated Flame Retardants Chemicals Industry Revenue Share (%), by End-user Industry 2025 & 2033
- Figure 10: Asia Pacific Non-Halogenated Flame Retardants Chemicals Industry Volume Share (%), by End-user Industry 2025 & 2033
- Figure 11: Asia Pacific Non-Halogenated Flame Retardants Chemicals Industry Revenue (billion), by Country 2025 & 2033
- Figure 12: Asia Pacific Non-Halogenated Flame Retardants Chemicals Industry Volume (K Tons), by Country 2025 & 2033
- Figure 13: Asia Pacific Non-Halogenated Flame Retardants Chemicals Industry Revenue Share (%), by Country 2025 & 2033
- Figure 14: Asia Pacific Non-Halogenated Flame Retardants Chemicals Industry Volume Share (%), by Country 2025 & 2033
- Figure 15: North America Non-Halogenated Flame Retardants Chemicals Industry Revenue (billion), by Type 2025 & 2033
- Figure 16: North America Non-Halogenated Flame Retardants Chemicals Industry Volume (K Tons), by Type 2025 & 2033
- Figure 17: North America Non-Halogenated Flame Retardants Chemicals Industry Revenue Share (%), by Type 2025 & 2033
- Figure 18: North America Non-Halogenated Flame Retardants Chemicals Industry Volume Share (%), by Type 2025 & 2033
- Figure 19: North America Non-Halogenated Flame Retardants Chemicals Industry Revenue (billion), by End-user Industry 2025 & 2033
- Figure 20: North America Non-Halogenated Flame Retardants Chemicals Industry Volume (K Tons), by End-user Industry 2025 & 2033
- Figure 21: North America Non-Halogenated Flame Retardants Chemicals Industry Revenue Share (%), by End-user Industry 2025 & 2033
- Figure 22: North America Non-Halogenated Flame Retardants Chemicals Industry Volume Share (%), by End-user Industry 2025 & 2033
- Figure 23: North America Non-Halogenated Flame Retardants Chemicals Industry Revenue (billion), by Country 2025 & 2033
- Figure 24: North America Non-Halogenated Flame Retardants Chemicals Industry Volume (K Tons), by Country 2025 & 2033
- Figure 25: North America Non-Halogenated Flame Retardants Chemicals Industry Revenue Share (%), by Country 2025 & 2033
- Figure 26: North America Non-Halogenated Flame Retardants Chemicals Industry Volume Share (%), by Country 2025 & 2033
- Figure 27: Europe Non-Halogenated Flame Retardants Chemicals Industry Revenue (billion), by Type 2025 & 2033
- Figure 28: Europe Non-Halogenated Flame Retardants Chemicals Industry Volume (K Tons), by Type 2025 & 2033
- Figure 29: Europe Non-Halogenated Flame Retardants Chemicals Industry Revenue Share (%), by Type 2025 & 2033
- Figure 30: Europe Non-Halogenated Flame Retardants Chemicals Industry Volume Share (%), by Type 2025 & 2033
- Figure 31: Europe Non-Halogenated Flame Retardants Chemicals Industry Revenue (billion), by End-user Industry 2025 & 2033
- Figure 32: Europe Non-Halogenated Flame Retardants Chemicals Industry Volume (K Tons), by End-user Industry 2025 & 2033
- Figure 33: Europe Non-Halogenated Flame Retardants Chemicals Industry Revenue Share (%), by End-user Industry 2025 & 2033
- Figure 34: Europe Non-Halogenated Flame Retardants Chemicals Industry Volume Share (%), by End-user Industry 2025 & 2033
- Figure 35: Europe Non-Halogenated Flame Retardants Chemicals Industry Revenue (billion), by Country 2025 & 2033
- Figure 36: Europe Non-Halogenated Flame Retardants Chemicals Industry Volume (K Tons), by Country 2025 & 2033
- Figure 37: Europe Non-Halogenated Flame Retardants Chemicals Industry Revenue Share (%), by Country 2025 & 2033
- Figure 38: Europe Non-Halogenated Flame Retardants Chemicals Industry Volume Share (%), by Country 2025 & 2033
- Figure 39: South America Non-Halogenated Flame Retardants Chemicals Industry Revenue (billion), by Type 2025 & 2033
- Figure 40: South America Non-Halogenated Flame Retardants Chemicals Industry Volume (K Tons), by Type 2025 & 2033
- Figure 41: South America Non-Halogenated Flame Retardants Chemicals Industry Revenue Share (%), by Type 2025 & 2033
- Figure 42: South America Non-Halogenated Flame Retardants Chemicals Industry Volume Share (%), by Type 2025 & 2033
- Figure 43: South America Non-Halogenated Flame Retardants Chemicals Industry Revenue (billion), by End-user Industry 2025 & 2033
- Figure 44: South America Non-Halogenated Flame Retardants Chemicals Industry Volume (K Tons), by End-user Industry 2025 & 2033
- Figure 45: South America Non-Halogenated Flame Retardants Chemicals Industry Revenue Share (%), by End-user Industry 2025 & 2033
- Figure 46: South America Non-Halogenated Flame Retardants Chemicals Industry Volume Share (%), by End-user Industry 2025 & 2033
- Figure 47: South America Non-Halogenated Flame Retardants Chemicals Industry Revenue (billion), by Country 2025 & 2033
- Figure 48: South America Non-Halogenated Flame Retardants Chemicals Industry Volume (K Tons), by Country 2025 & 2033
- Figure 49: South America Non-Halogenated Flame Retardants Chemicals Industry Revenue Share (%), by Country 2025 & 2033
- Figure 50: South America Non-Halogenated Flame Retardants Chemicals Industry Volume Share (%), by Country 2025 & 2033
- Figure 51: Middle East and Africa Non-Halogenated Flame Retardants Chemicals Industry Revenue (billion), by Type 2025 & 2033
- Figure 52: Middle East and Africa Non-Halogenated Flame Retardants Chemicals Industry Volume (K Tons), by Type 2025 & 2033
- Figure 53: Middle East and Africa Non-Halogenated Flame Retardants Chemicals Industry Revenue Share (%), by Type 2025 & 2033
- Figure 54: Middle East and Africa Non-Halogenated Flame Retardants Chemicals Industry Volume Share (%), by Type 2025 & 2033
- Figure 55: Middle East and Africa Non-Halogenated Flame Retardants Chemicals Industry Revenue (billion), by End-user Industry 2025 & 2033
- Figure 56: Middle East and Africa Non-Halogenated Flame Retardants Chemicals Industry Volume (K Tons), by End-user Industry 2025 & 2033
- Figure 57: Middle East and Africa Non-Halogenated Flame Retardants Chemicals Industry Revenue Share (%), by End-user Industry 2025 & 2033
- Figure 58: Middle East and Africa Non-Halogenated Flame Retardants Chemicals Industry Volume Share (%), by End-user Industry 2025 & 2033
- Figure 59: Middle East and Africa Non-Halogenated Flame Retardants Chemicals Industry Revenue (billion), by Country 2025 & 2033
- Figure 60: Middle East and Africa Non-Halogenated Flame Retardants Chemicals Industry Volume (K Tons), by Country 2025 & 2033
- Figure 61: Middle East and Africa Non-Halogenated Flame Retardants Chemicals Industry Revenue Share (%), by Country 2025 & 2033
- Figure 62: Middle East and Africa Non-Halogenated Flame Retardants Chemicals Industry Volume Share (%), by Country 2025 & 2033
List of Tables
- Table 1: Global Non-Halogenated Flame Retardants Chemicals Industry Revenue billion Forecast, by Type 2020 & 2033
- Table 2: Global Non-Halogenated Flame Retardants Chemicals Industry Volume K Tons Forecast, by Type 2020 & 2033
- Table 3: Global Non-Halogenated Flame Retardants Chemicals Industry Revenue billion Forecast, by End-user Industry 2020 & 2033
- Table 4: Global Non-Halogenated Flame Retardants Chemicals Industry Volume K Tons Forecast, by End-user Industry 2020 & 2033
- Table 5: Global Non-Halogenated Flame Retardants Chemicals Industry Revenue billion Forecast, by Region 2020 & 2033
- Table 6: Global Non-Halogenated Flame Retardants Chemicals Industry Volume K Tons Forecast, by Region 2020 & 2033
- Table 7: Global Non-Halogenated Flame Retardants Chemicals Industry Revenue billion Forecast, by Type 2020 & 2033
- Table 8: Global Non-Halogenated Flame Retardants Chemicals Industry Volume K Tons Forecast, by Type 2020 & 2033
- Table 9: Global Non-Halogenated Flame Retardants Chemicals Industry Revenue billion Forecast, by End-user Industry 2020 & 2033
- Table 10: Global Non-Halogenated Flame Retardants Chemicals Industry Volume K Tons Forecast, by End-user Industry 2020 & 2033
- Table 11: Global Non-Halogenated Flame Retardants Chemicals Industry Revenue billion Forecast, by Country 2020 & 2033
- Table 12: Global Non-Halogenated Flame Retardants Chemicals Industry Volume K Tons Forecast, by Country 2020 & 2033
- Table 13: China Non-Halogenated Flame Retardants Chemicals Industry Revenue (billion) Forecast, by Application 2020 & 2033
- Table 14: China Non-Halogenated Flame Retardants Chemicals Industry Volume (K Tons) Forecast, by Application 2020 & 2033
- Table 15: India Non-Halogenated Flame Retardants Chemicals Industry Revenue (billion) Forecast, by Application 2020 & 2033
- Table 16: India Non-Halogenated Flame Retardants Chemicals Industry Volume (K Tons) Forecast, by Application 2020 & 2033
- Table 17: Japan Non-Halogenated Flame Retardants Chemicals Industry Revenue (billion) Forecast, by Application 2020 & 2033
- Table 18: Japan Non-Halogenated Flame Retardants Chemicals Industry Volume (K Tons) Forecast, by Application 2020 & 2033
- Table 19: South Korea Non-Halogenated Flame Retardants Chemicals Industry Revenue (billion) Forecast, by Application 2020 & 2033
- Table 20: South Korea Non-Halogenated Flame Retardants Chemicals Industry Volume (K Tons) Forecast, by Application 2020 & 2033
- Table 21: Rest of Asia Pacific Non-Halogenated Flame Retardants Chemicals Industry Revenue (billion) Forecast, by Application 2020 & 2033
- Table 22: Rest of Asia Pacific Non-Halogenated Flame Retardants Chemicals Industry Volume (K Tons) Forecast, by Application 2020 & 2033
- Table 23: Global Non-Halogenated Flame Retardants Chemicals Industry Revenue billion Forecast, by Type 2020 & 2033
- Table 24: Global Non-Halogenated Flame Retardants Chemicals Industry Volume K Tons Forecast, by Type 2020 & 2033
- Table 25: Global Non-Halogenated Flame Retardants Chemicals Industry Revenue billion Forecast, by End-user Industry 2020 & 2033
- Table 26: Global Non-Halogenated Flame Retardants Chemicals Industry Volume K Tons Forecast, by End-user Industry 2020 & 2033
- Table 27: Global Non-Halogenated Flame Retardants Chemicals Industry Revenue billion Forecast, by Country 2020 & 2033
- Table 28: Global Non-Halogenated Flame Retardants Chemicals Industry Volume K Tons Forecast, by Country 2020 & 2033
- Table 29: United States Non-Halogenated Flame Retardants Chemicals Industry Revenue (billion) Forecast, by Application 2020 & 2033
- Table 30: United States Non-Halogenated Flame Retardants Chemicals Industry Volume (K Tons) Forecast, by Application 2020 & 2033
- Table 31: Canada Non-Halogenated Flame Retardants Chemicals Industry Revenue (billion) Forecast, by Application 2020 & 2033
- Table 32: Canada Non-Halogenated Flame Retardants Chemicals Industry Volume (K Tons) Forecast, by Application 2020 & 2033
- Table 33: Mexico Non-Halogenated Flame Retardants Chemicals Industry Revenue (billion) Forecast, by Application 2020 & 2033
- Table 34: Mexico Non-Halogenated Flame Retardants Chemicals Industry Volume (K Tons) Forecast, by Application 2020 & 2033
- Table 35: Global Non-Halogenated Flame Retardants Chemicals Industry Revenue billion Forecast, by Type 2020 & 2033
- Table 36: Global Non-Halogenated Flame Retardants Chemicals Industry Volume K Tons Forecast, by Type 2020 & 2033
- Table 37: Global Non-Halogenated Flame Retardants Chemicals Industry Revenue billion Forecast, by End-user Industry 2020 & 2033
- Table 38: Global Non-Halogenated Flame Retardants Chemicals Industry Volume K Tons Forecast, by End-user Industry 2020 & 2033
- Table 39: Global Non-Halogenated Flame Retardants Chemicals Industry Revenue billion Forecast, by Country 2020 & 2033
- Table 40: Global Non-Halogenated Flame Retardants Chemicals Industry Volume K Tons Forecast, by Country 2020 & 2033
- Table 41: Germany Non-Halogenated Flame Retardants Chemicals Industry Revenue (billion) Forecast, by Application 2020 & 2033
- Table 42: Germany Non-Halogenated Flame Retardants Chemicals Industry Volume (K Tons) Forecast, by Application 2020 & 2033
- Table 43: United Kingdom Non-Halogenated Flame Retardants Chemicals Industry Revenue (billion) Forecast, by Application 2020 & 2033
- Table 44: United Kingdom Non-Halogenated Flame Retardants Chemicals Industry Volume (K Tons) Forecast, by Application 2020 & 2033
- Table 45: Italy Non-Halogenated Flame Retardants Chemicals Industry Revenue (billion) Forecast, by Application 2020 & 2033
- Table 46: Italy Non-Halogenated Flame Retardants Chemicals Industry Volume (K Tons) Forecast, by Application 2020 & 2033
- Table 47: France Non-Halogenated Flame Retardants Chemicals Industry Revenue (billion) Forecast, by Application 2020 & 2033
- Table 48: France Non-Halogenated Flame Retardants Chemicals Industry Volume (K Tons) Forecast, by Application 2020 & 2033
- Table 49: Rest of Europe Non-Halogenated Flame Retardants Chemicals Industry Revenue (billion) Forecast, by Application 2020 & 2033
- Table 50: Rest of Europe Non-Halogenated Flame Retardants Chemicals Industry Volume (K Tons) Forecast, by Application 2020 & 2033
- Table 51: Global Non-Halogenated Flame Retardants Chemicals Industry Revenue billion Forecast, by Type 2020 & 2033
- Table 52: Global Non-Halogenated Flame Retardants Chemicals Industry Volume K Tons Forecast, by Type 2020 & 2033
- Table 53: Global Non-Halogenated Flame Retardants Chemicals Industry Revenue billion Forecast, by End-user Industry 2020 & 2033
- Table 54: Global Non-Halogenated Flame Retardants Chemicals Industry Volume K Tons Forecast, by End-user Industry 2020 & 2033
- Table 55: Global Non-Halogenated Flame Retardants Chemicals Industry Revenue billion Forecast, by Country 2020 & 2033
- Table 56: Global Non-Halogenated Flame Retardants Chemicals Industry Volume K Tons Forecast, by Country 2020 & 2033
- Table 57: Brazil Non-Halogenated Flame Retardants Chemicals Industry Revenue (billion) Forecast, by Application 2020 & 2033
- Table 58: Brazil Non-Halogenated Flame Retardants Chemicals Industry Volume (K Tons) Forecast, by Application 2020 & 2033
- Table 59: Argentina Non-Halogenated Flame Retardants Chemicals Industry Revenue (billion) Forecast, by Application 2020 & 2033
- Table 60: Argentina Non-Halogenated Flame Retardants Chemicals Industry Volume (K Tons) Forecast, by Application 2020 & 2033
- Table 61: Rest of South America Non-Halogenated Flame Retardants Chemicals Industry Revenue (billion) Forecast, by Application 2020 & 2033
- Table 62: Rest of South America Non-Halogenated Flame Retardants Chemicals Industry Volume (K Tons) Forecast, by Application 2020 & 2033
- Table 63: Global Non-Halogenated Flame Retardants Chemicals Industry Revenue billion Forecast, by Type 2020 & 2033
- Table 64: Global Non-Halogenated Flame Retardants Chemicals Industry Volume K Tons Forecast, by Type 2020 & 2033
- Table 65: Global Non-Halogenated Flame Retardants Chemicals Industry Revenue billion Forecast, by End-user Industry 2020 & 2033
- Table 66: Global Non-Halogenated Flame Retardants Chemicals Industry Volume K Tons Forecast, by End-user Industry 2020 & 2033
- Table 67: Global Non-Halogenated Flame Retardants Chemicals Industry Revenue billion Forecast, by Country 2020 & 2033
- Table 68: Global Non-Halogenated Flame Retardants Chemicals Industry Volume K Tons Forecast, by Country 2020 & 2033
- Table 69: Saudi Arabia Non-Halogenated Flame Retardants Chemicals Industry Revenue (billion) Forecast, by Application 2020 & 2033
- Table 70: Saudi Arabia Non-Halogenated Flame Retardants Chemicals Industry Volume (K Tons) Forecast, by Application 2020 & 2033
- Table 71: South Africa Non-Halogenated Flame Retardants Chemicals Industry Revenue (billion) Forecast, by Application 2020 & 2033
- Table 72: South Africa Non-Halogenated Flame Retardants Chemicals Industry Volume (K Tons) Forecast, by Application 2020 & 2033
- Table 73: Rest of Middle East and Africa Non-Halogenated Flame Retardants Chemicals Industry Revenue (billion) Forecast, by Application 2020 & 2033
- Table 74: Rest of Middle East and Africa Non-Halogenated Flame Retardants Chemicals Industry Volume (K Tons) Forecast, by Application 2020 & 2033
Frequently Asked Questions
1. What is the projected Compound Annual Growth Rate (CAGR) of the Non-Halogenated Flame Retardants Chemicals Industry?
The projected CAGR is approximately 12.02%.
2. Which companies are prominent players in the Non-Halogenated Flame Retardants Chemicals Industry?
Key companies in the market include ICL, DIC Corporation, TOR Minerals, Clariant, Jiangsu Jacques Technology Co Ltd, MPI Chemie BV, Italmatch Chemicals SpA, LANXESS, Nippon Carbide Indestries Co Inc (Sanwa Chemical Industry Co Ltd), BASF SE, Rin Kagaku Kogyo Co Ltd, Shandong Brother Sci &Tech Co Ltd, Nabaltec AG, Thor, Eti Maden, Apexical Inc, NYACOL Nano Technologies Inc, Huber Engineered Materials, Daihachi Chemical Industry Co Ltd.
3. What are the main segments of the Non-Halogenated Flame Retardants Chemicals Industry?
The market segments include Type, End-user Industry.
4. Can you provide details about the market size?
The market size is estimated to be USD 10.59 billion as of 2022.
5. What are some drivers contributing to market growth?
; Environmental and Health Concerns Regarding Brominated and Other Flame Retardants; Increasing Infrastructure Activities in Asia-Pacific; Rising Consumer Electrical and Electronic Goods Manufacturing.
6. What are the notable trends driving market growth?
Increasing Demand from the Buildings and Construction Industry.
7. Are there any restraints impacting market growth?
; Non-suitability of Hydroxides to High Temperature Applications.
8. Can you provide examples of recent developments in the market?
N/A
9. What pricing options are available for accessing the report?
Pricing options include single-user, multi-user, and enterprise licenses priced at USD 4750, USD 5250, and USD 8750 respectively.
10. Is the market size provided in terms of value or volume?
The market size is provided in terms of value, measured in billion and volume, measured in K Tons.
11. Are there any specific market keywords associated with the report?
Yes, the market keyword associated with the report is "Non-Halogenated Flame Retardants Chemicals Industry," which aids in identifying and referencing the specific market segment covered.
12. How do I determine which pricing option suits my needs best?
The pricing options vary based on user requirements and access needs. Individual users may opt for single-user licenses, while businesses requiring broader access may choose multi-user or enterprise licenses for cost-effective access to the report.
13. Are there any additional resources or data provided in the Non-Halogenated Flame Retardants Chemicals Industry report?
While the report offers comprehensive insights, it's advisable to review the specific contents or supplementary materials provided to ascertain if additional resources or data are available.
14. How can I stay updated on further developments or reports in the Non-Halogenated Flame Retardants Chemicals Industry?
To stay informed about further developments, trends, and reports in the Non-Halogenated Flame Retardants Chemicals Industry, consider subscribing to industry newsletters, following relevant companies and organizations, or regularly checking reputable industry news sources and publications.
Methodology
Step 1 - Identification of Relevant Samples Size from Population Database


Step 2 - Approaches for Defining Global Market Size (Value, Volume* & Price*)

Note*: In applicable scenarios
Step 3 - Data Sources
Primary Research
- Web Analytics
- Survey Reports
- Research Institute
- Latest Research Reports
- Opinion Leaders
Secondary Research
- Annual Reports
- White Paper
- Latest Press Release
- Industry Association
- Paid Database
- Investor Presentations

Step 4 - Data Triangulation
Involves using different sources of information in order to increase the validity of a study
These sources are likely to be stakeholders in a program - participants, other researchers, program staff, other community members, and so on.
Then we put all data in single framework & apply various statistical tools to find out the dynamic on the market.
During the analysis stage, feedback from the stakeholder groups would be compared to determine areas of agreement as well as areas of divergence