

Key Insights
The North American surfactants market is projected for significant expansion, reaching an estimated 46.5 billion by 2025 and growing at a compound annual growth rate (CAGR) of 6.2% from 2025 to 2033. This robust growth is underpinned by several key drivers. The expanding personal care sector, propelled by increasing consumer demand for premium cosmetics and hygiene products, is a primary contributor. Concurrently, the flourishing household cleaning segment, supported by rising disposable incomes and a preference for efficient cleaning solutions, is significantly elevating surfactant demand. Furthermore, technological advancements, particularly the development of bio-based and sustainable surfactants, are redefining market dynamics and fostering adoption across diverse applications such as industrial and institutional cleaning, agrochemicals, and textile processing. These eco-friendly innovations directly address escalating environmental concerns and align with the growing emphasis on sustainable practices across industries.
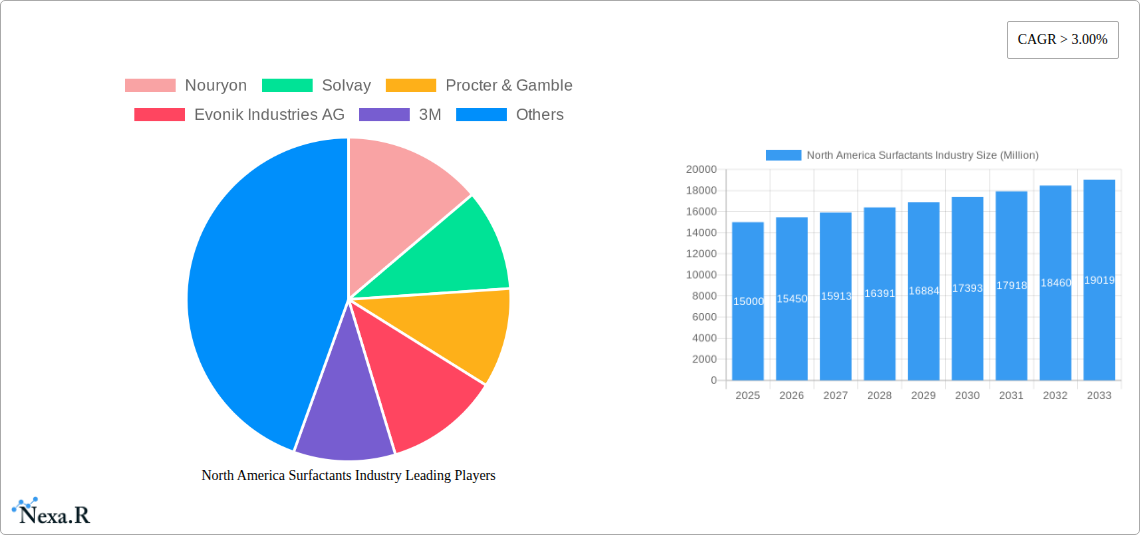
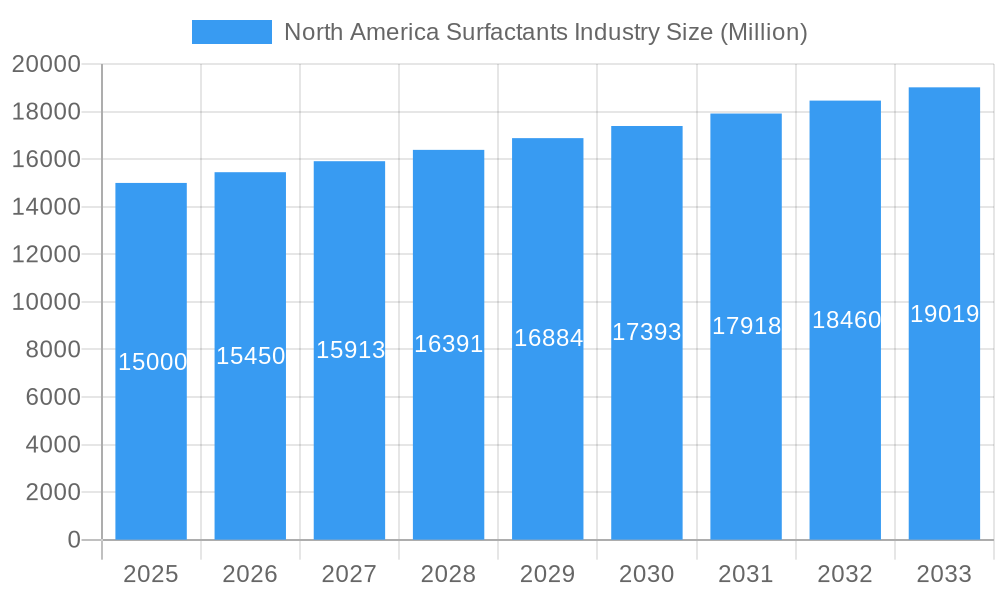
North America Surfactants Industry Market Size (In Billion)
Market segmentation reveals a dynamic landscape. Anionic surfactants continue to dominate due to their proven efficacy and cost-effectiveness. However, demand for cationic, non-ionic, and amphoteric surfactants is also rising, driven by their specialized properties. The increasing preference for bio-based surfactants highlights a growing market inclination towards environmentally responsible alternatives, presenting significant growth avenues for manufacturers investing in sustainable technologies. While competition among established players like Procter & Gamble, BASF, and Evonik remains keen, the market also benefits from innovation by smaller companies focusing on niche applications or sustainable solutions. Geographically, the United States remains the leading market within North America, attributed to its substantial population and developed consumer goods sector. Growth is also anticipated in Canada and Mexico, driven by industrial expansion and increasing consumer expenditure. Potential challenges to future market growth include supply chain volatility and fluctuations in raw material pricing.
North America Surfactants Industry Company Market Share
North America Surfactants Industry Market Report: 2019-2033
This comprehensive report provides an in-depth analysis of the North America surfactants market, encompassing market size, growth trends, competitive landscape, and future outlook. The study period covers 2019-2033, with 2025 as the base year and forecast period extending to 2033. The report is essential for industry professionals, investors, and stakeholders seeking to understand this dynamic market and capitalize on emerging opportunities. The report delves into key segments such as Anionic, Cationic, Non-ionic, Amphoteric, and Silicone surfactants, exploring their applications across diverse industries including household care, personal care, and industrial cleaning.
North America Surfactants Industry Market Dynamics & Structure
The North American surfactants market is characterized by a moderately consolidated structure, with key players like Nouryon, Solvay, Procter & Gamble, Evonik Industries AG, 3M, Croda International Plc, Ashland, BASF SE, Huntsman International LLC, Sasol, Dow, Godrej Industries Limited, GALAXY, MITSUI CHEMICALS AMERICA INC, CLARIANT, Henkel Corporation, Kao Corporation, Stepan Company, and Innospec holding significant market share. The market is driven by technological advancements, particularly in bio-based surfactants and sustainable formulations. Stringent environmental regulations are shaping product development and manufacturing processes. The competitive landscape is further influenced by the presence of numerous smaller players offering specialized surfactant solutions. Market concentration is estimated at xx% in 2025, with the top 5 players controlling approximately xx% of the market. M&A activity has been moderate in recent years, with approximately xx deals recorded between 2019 and 2024, primarily focused on consolidating market share and expanding product portfolios.
- Market Concentration: xx% in 2025 (estimated).
- Top 5 Players Market Share: xx% (estimated).
- M&A Activity (2019-2024): xx deals (estimated).
- Key Innovation Drivers: Sustainability, bio-based surfactants, performance enhancement.
- Regulatory Landscape: Stringent environmental regulations driving innovation in sustainable solutions.
North America Surfactants Industry Growth Trends & Insights
The North American surfactants market witnessed significant growth during the historical period (2019-2024), expanding from xx million units in 2019 to xx million units in 2024, exhibiting a CAGR of xx%. This growth is attributed to increasing demand across various applications, particularly in household care, personal care, and industrial cleaning. The market is expected to continue its growth trajectory during the forecast period (2025-2033), reaching xx million units by 2033, driven by factors such as rising disposable incomes, changing consumer preferences towards eco-friendly products, and technological advancements in surfactant formulations. Technological disruptions, such as the development of bio-based surfactants and the adoption of advanced manufacturing processes, are also contributing to market expansion. Shifts in consumer behavior toward sustainable and natural products are further accelerating the growth of the bio-based surfactant segment. Market penetration for bio-based surfactants is projected to increase from xx% in 2025 to xx% by 2033. The projected CAGR for the forecast period (2025-2033) is estimated to be xx%.
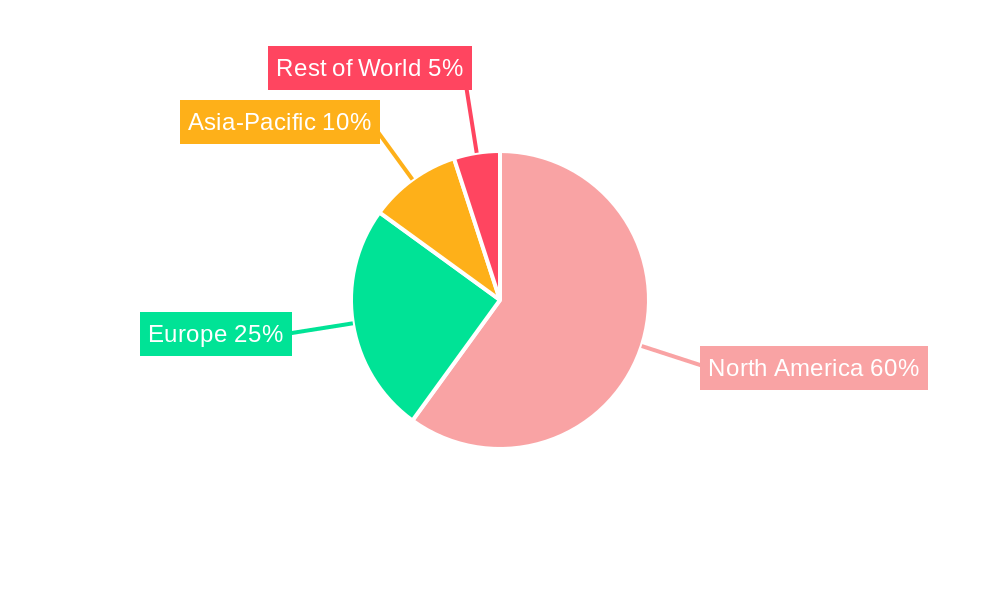
Dominant Regions, Countries, or Segments in North America Surfactants Industry
The United States holds the dominant position in the North American surfactants market, accounting for approximately xx% of the total market value in 2025. This dominance is attributed to the country's large and diversified end-use industries, robust economic growth, and well-established manufacturing infrastructure. Among the various surfactant types, anionic surfactants constitute the largest segment, holding approximately xx% of the market share in 2025, driven by their widespread application in detergents and cleaning products. Similarly, the household soap and detergent segment dominates application-wise, accounting for approximately xx% of market value, reflecting high consumer demand for cleaning products. The bio-based surfactant segment is showing rapid growth, fueled by increasing consumer awareness of environmental sustainability and stricter regulations regarding the use of synthetic chemicals.
- Key Regional Driver (US): Strong manufacturing base, large end-use industries, robust economy.
- Leading Surfactant Type: Anionic Surfactants (xx% market share in 2025).
- Largest Application Segment: Household soap and detergents (xx% market share in 2025).
- Fastest-Growing Segment: Bio-based surfactants.
North America Surfactants Industry Product Landscape
The North American surfactants market showcases a diverse product landscape, featuring a wide range of anionic, cationic, non-ionic, amphoteric, and silicone surfactants tailored for specific applications. Recent innovations focus on enhancing product performance, sustainability, and biodegradability. Key trends include the development of high-performance surfactants with improved cleaning efficacy and reduced environmental impact, the introduction of bio-based alternatives to traditional petroleum-derived surfactants, and the customization of surfactant formulations to meet specific industry needs. Unique selling propositions include superior cleaning power, eco-friendly formulations, and improved safety profiles.
Key Drivers, Barriers & Challenges in North America Surfactants Industry
Key Drivers:
- Growing demand across various end-use sectors (household care, personal care, industrial cleaning).
- Increasing consumer preference for eco-friendly and sustainable products.
- Technological advancements in surfactant formulations leading to improved performance and reduced environmental impact.
Challenges & Restraints:
- Fluctuations in raw material prices, impacting production costs and profitability.
- Stringent environmental regulations requiring manufacturers to adopt sustainable practices and reduce their environmental footprint.
- Intense competition from both established and emerging players, requiring companies to innovate and differentiate their product offerings. This pressure leads to price wars, squeezing profit margins.
Emerging Opportunities in North America Surfactants Industry
- Expanding applications of surfactants in specialized fields such as nanotechnology and biotechnology.
- Growing demand for bio-based and renewable surfactants in response to rising environmental concerns.
- Increased focus on developing customized surfactant solutions to meet the specific requirements of diverse industries.
Growth Accelerators in the North America Surfactants Industry
Long-term growth in the North America surfactants market will be fueled by technological breakthroughs in bio-based surfactant synthesis, strategic partnerships between surfactant manufacturers and end-use industries to develop innovative solutions, and market expansion into high-growth sectors like personal care and industrial cleaning in developing regions within North America.
Key Players Shaping the North America Surfactants Industry Market
- Nouryon
- Solvay
- Procter & Gamble
- Evonik Industries AG
- 3M
- Croda International Plc
- Ashland
- BASF SE
- Huntsman International LLC
- Sasol
- Dow
- Godrej Industries Limited
- GALAXY
- MITSUI CHEMICALS AMERICA INC
- CLARIANT
- Henkel Corporation
- Kao Corporation
- Stepan Company
- Innospec
Notable Milestones in North America Surfactants Industry Sector
- January 2023: Nouryon introduced Triameen Y12D, an antibacterial active, expanding its disinfectant product line.
- August 2022: Huntsman Corporation sold its Textile Effects segment to Archroma, impacting its market position in textile applications.
In-Depth North America Surfactants Industry Market Outlook
The North America surfactants market holds immense future potential, driven by the rising demand for sustainable and high-performance products. Strategic opportunities exist for companies to focus on developing innovative, eco-friendly surfactant solutions that cater to the growing needs of various industries, capitalizing on increasing consumer awareness of environmental sustainability. The market is poised for continued growth, presenting significant opportunities for both established players and new entrants.
North America Surfactants Industry Segmentation
-
1. Type
- 1.1. Anionic Surfactant
- 1.2. Cationic Surfactant
- 1.3. Non-ionic Surfactant
- 1.4. Amphoteric Surfactant
- 1.5. Silicone Surfactant
- 1.6. Other Types
-
2. Origin
- 2.1. Synthetic Surfactant
- 2.2. Bio-based Surfactant
-
3. Application
- 3.1. Household Soap and Detergent
- 3.2. Personal Care
- 3.3. Lubricants and Fuel Additives
- 3.4. Industry & Institutional Cleaning
- 3.5. Food Processing
- 3.6. Oilfield Chemicals
- 3.7. Agricultural Chemicals
- 3.8. Textile Processing
- 3.9. Emulsion Polymerization
- 3.10. Other Applications
-
4. Geography
- 4.1. United States
- 4.2. Canada
- 4.3. Mexico
- 4.4. Rest of North America
North America Surfactants Industry Segmentation By Geography
- 1. United States
- 2. Canada
- 3. Mexico
- 4. Rest of North America
North America Surfactants Industry Regional Market Share
Geographic Coverage of North America Surfactants Industry
North America Surfactants Industry REPORT HIGHLIGHTS
| Aspects | Details |
|---|---|
| Study Period | 2020-2034 |
| Base Year | 2025 |
| Estimated Year | 2026 |
| Forecast Period | 2026-2034 |
| Historical Period | 2020-2025 |
| Growth Rate | CAGR of 6.2% from 2020-2034 |
| Segmentation |
|
Table of Contents
- 1. Introduction
- 1.1. Research Scope
- 1.2. Market Segmentation
- 1.3. Research Objective
- 1.4. Definitions and Assumptions
- 2. Executive Summary
- 2.1. Market Snapshot
- 3. Market Dynamics
- 3.1. Market Drivers
- 3.2. Market Restrains
- 3.3. Market Trends
- 3.4. Market Opportunities
- 4. Market Factor Analysis
- 4.1. Porters Five Forces
- 4.1.1. Bargaining Power of Suppliers
- 4.1.2. Bargaining Power of Buyers
- 4.1.3. Threat of New Entrants
- 4.1.4. Threat of Substitutes
- 4.1.5. Competitive Rivalry
- 4.2. PESTEL analysis
- 4.3. BCG Analysis
- 4.3.1. Stars (High Growth, High Market Share)
- 4.3.2. Cash Cows (Low Growth, High Market Share)
- 4.3.3. Question Mark (High Growth, Low Market Share)
- 4.3.4. Dogs (Low Growth, Low Market Share)
- 4.4. Ansoff Matrix Analysis
- 4.5. Supply Chain Analysis
- 4.6. Regulatory Landscape
- 4.7. Current Market Potential and Opportunity Assessment (TAM–SAM–SOM Framework)
- 4.8. NRP Analyst Note
- 4.1. Porters Five Forces
- 5. Market Analysis, Insights and Forecast 2021-2033
- 5.1. Market Analysis, Insights and Forecast - by Type
- 5.1.1. Anionic Surfactant
- 5.1.2. Cationic Surfactant
- 5.1.3. Non-ionic Surfactant
- 5.1.4. Amphoteric Surfactant
- 5.1.5. Silicone Surfactant
- 5.1.6. Other Types
- 5.2. Market Analysis, Insights and Forecast - by Origin
- 5.2.1. Synthetic Surfactant
- 5.2.2. Bio-based Surfactant
- 5.3. Market Analysis, Insights and Forecast - by Application
- 5.3.1. Household Soap and Detergent
- 5.3.2. Personal Care
- 5.3.3. Lubricants and Fuel Additives
- 5.3.4. Industry & Institutional Cleaning
- 5.3.5. Food Processing
- 5.3.6. Oilfield Chemicals
- 5.3.7. Agricultural Chemicals
- 5.3.8. Textile Processing
- 5.3.9. Emulsion Polymerization
- 5.3.10. Other Applications
- 5.4. Market Analysis, Insights and Forecast - by Geography
- 5.4.1. United States
- 5.4.2. Canada
- 5.4.3. Mexico
- 5.4.4. Rest of North America
- 5.5. Market Analysis, Insights and Forecast - by Region
- 5.5.1. United States
- 5.5.2. Canada
- 5.5.3. Mexico
- 5.5.4. Rest of North America
- 5.1. Market Analysis, Insights and Forecast - by Type
- 6. North America Surfactants Industry Analysis, Insights and Forecast, 2021-2033
- 6.1. Market Analysis, Insights and Forecast - by Type
- 6.1.1. Anionic Surfactant
- 6.1.2. Cationic Surfactant
- 6.1.3. Non-ionic Surfactant
- 6.1.4. Amphoteric Surfactant
- 6.1.5. Silicone Surfactant
- 6.1.6. Other Types
- 6.2. Market Analysis, Insights and Forecast - by Origin
- 6.2.1. Synthetic Surfactant
- 6.2.2. Bio-based Surfactant
- 6.3. Market Analysis, Insights and Forecast - by Application
- 6.3.1. Household Soap and Detergent
- 6.3.2. Personal Care
- 6.3.3. Lubricants and Fuel Additives
- 6.3.4. Industry & Institutional Cleaning
- 6.3.5. Food Processing
- 6.3.6. Oilfield Chemicals
- 6.3.7. Agricultural Chemicals
- 6.3.8. Textile Processing
- 6.3.9. Emulsion Polymerization
- 6.3.10. Other Applications
- 6.4. Market Analysis, Insights and Forecast - by Geography
- 6.4.1. United States
- 6.4.2. Canada
- 6.4.3. Mexico
- 6.4.4. Rest of North America
- 6.1. Market Analysis, Insights and Forecast - by Type
- 7. United States North America Surfactants Industry Analysis, Insights and Forecast, 2020-2032
- 7.1. Market Analysis, Insights and Forecast - by Type
- 7.1.1. Anionic Surfactant
- 7.1.2. Cationic Surfactant
- 7.1.3. Non-ionic Surfactant
- 7.1.4. Amphoteric Surfactant
- 7.1.5. Silicone Surfactant
- 7.1.6. Other Types
- 7.2. Market Analysis, Insights and Forecast - by Origin
- 7.2.1. Synthetic Surfactant
- 7.2.2. Bio-based Surfactant
- 7.3. Market Analysis, Insights and Forecast - by Application
- 7.3.1. Household Soap and Detergent
- 7.3.2. Personal Care
- 7.3.3. Lubricants and Fuel Additives
- 7.3.4. Industry & Institutional Cleaning
- 7.3.5. Food Processing
- 7.3.6. Oilfield Chemicals
- 7.3.7. Agricultural Chemicals
- 7.3.8. Textile Processing
- 7.3.9. Emulsion Polymerization
- 7.3.10. Other Applications
- 7.4. Market Analysis, Insights and Forecast - by Geography
- 7.4.1. United States
- 7.4.2. Canada
- 7.4.3. Mexico
- 7.4.4. Rest of North America
- 7.1. Market Analysis, Insights and Forecast - by Type
- 8. Canada North America Surfactants Industry Analysis, Insights and Forecast, 2020-2032
- 8.1. Market Analysis, Insights and Forecast - by Type
- 8.1.1. Anionic Surfactant
- 8.1.2. Cationic Surfactant
- 8.1.3. Non-ionic Surfactant
- 8.1.4. Amphoteric Surfactant
- 8.1.5. Silicone Surfactant
- 8.1.6. Other Types
- 8.2. Market Analysis, Insights and Forecast - by Origin
- 8.2.1. Synthetic Surfactant
- 8.2.2. Bio-based Surfactant
- 8.3. Market Analysis, Insights and Forecast - by Application
- 8.3.1. Household Soap and Detergent
- 8.3.2. Personal Care
- 8.3.3. Lubricants and Fuel Additives
- 8.3.4. Industry & Institutional Cleaning
- 8.3.5. Food Processing
- 8.3.6. Oilfield Chemicals
- 8.3.7. Agricultural Chemicals
- 8.3.8. Textile Processing
- 8.3.9. Emulsion Polymerization
- 8.3.10. Other Applications
- 8.4. Market Analysis, Insights and Forecast - by Geography
- 8.4.1. United States
- 8.4.2. Canada
- 8.4.3. Mexico
- 8.4.4. Rest of North America
- 8.1. Market Analysis, Insights and Forecast - by Type
- 9. Mexico North America Surfactants Industry Analysis, Insights and Forecast, 2020-2032
- 9.1. Market Analysis, Insights and Forecast - by Type
- 9.1.1. Anionic Surfactant
- 9.1.2. Cationic Surfactant
- 9.1.3. Non-ionic Surfactant
- 9.1.4. Amphoteric Surfactant
- 9.1.5. Silicone Surfactant
- 9.1.6. Other Types
- 9.2. Market Analysis, Insights and Forecast - by Origin
- 9.2.1. Synthetic Surfactant
- 9.2.2. Bio-based Surfactant
- 9.3. Market Analysis, Insights and Forecast - by Application
- 9.3.1. Household Soap and Detergent
- 9.3.2. Personal Care
- 9.3.3. Lubricants and Fuel Additives
- 9.3.4. Industry & Institutional Cleaning
- 9.3.5. Food Processing
- 9.3.6. Oilfield Chemicals
- 9.3.7. Agricultural Chemicals
- 9.3.8. Textile Processing
- 9.3.9. Emulsion Polymerization
- 9.3.10. Other Applications
- 9.4. Market Analysis, Insights and Forecast - by Geography
- 9.4.1. United States
- 9.4.2. Canada
- 9.4.3. Mexico
- 9.4.4. Rest of North America
- 9.1. Market Analysis, Insights and Forecast - by Type
- 10. Rest of North America North America Surfactants Industry Analysis, Insights and Forecast, 2020-2032
- 10.1. Market Analysis, Insights and Forecast - by Type
- 10.1.1. Anionic Surfactant
- 10.1.2. Cationic Surfactant
- 10.1.3. Non-ionic Surfactant
- 10.1.4. Amphoteric Surfactant
- 10.1.5. Silicone Surfactant
- 10.1.6. Other Types
- 10.2. Market Analysis, Insights and Forecast - by Origin
- 10.2.1. Synthetic Surfactant
- 10.2.2. Bio-based Surfactant
- 10.3. Market Analysis, Insights and Forecast - by Application
- 10.3.1. Household Soap and Detergent
- 10.3.2. Personal Care
- 10.3.3. Lubricants and Fuel Additives
- 10.3.4. Industry & Institutional Cleaning
- 10.3.5. Food Processing
- 10.3.6. Oilfield Chemicals
- 10.3.7. Agricultural Chemicals
- 10.3.8. Textile Processing
- 10.3.9. Emulsion Polymerization
- 10.3.10. Other Applications
- 10.4. Market Analysis, Insights and Forecast - by Geography
- 10.4.1. United States
- 10.4.2. Canada
- 10.4.3. Mexico
- 10.4.4. Rest of North America
- 10.1. Market Analysis, Insights and Forecast - by Type
- 11. Competitive Analysis
- 11.1. Company Profiles
- 11.1.1 Nouryon
- 11.1.1.1. Company Overview
- 11.1.1.2. Products
- 11.1.1.3. Company Financials
- 11.1.1.4. SWOT Analysis
- 11.1.2 Solvay
- 11.1.2.1. Company Overview
- 11.1.2.2. Products
- 11.1.2.3. Company Financials
- 11.1.2.4. SWOT Analysis
- 11.1.3 Procter & Gamble
- 11.1.3.1. Company Overview
- 11.1.3.2. Products
- 11.1.3.3. Company Financials
- 11.1.3.4. SWOT Analysis
- 11.1.4 Evonik Industries AG
- 11.1.4.1. Company Overview
- 11.1.4.2. Products
- 11.1.4.3. Company Financials
- 11.1.4.4. SWOT Analysis
- 11.1.5 3M
- 11.1.5.1. Company Overview
- 11.1.5.2. Products
- 11.1.5.3. Company Financials
- 11.1.5.4. SWOT Analysis
- 11.1.6 Croda International Plc
- 11.1.6.1. Company Overview
- 11.1.6.2. Products
- 11.1.6.3. Company Financials
- 11.1.6.4. SWOT Analysis
- 11.1.7 Ashland
- 11.1.7.1. Company Overview
- 11.1.7.2. Products
- 11.1.7.3. Company Financials
- 11.1.7.4. SWOT Analysis
- 11.1.8 BASF SE
- 11.1.8.1. Company Overview
- 11.1.8.2. Products
- 11.1.8.3. Company Financials
- 11.1.8.4. SWOT Analysis
- 11.1.9 Huntsman International LLC
- 11.1.9.1. Company Overview
- 11.1.9.2. Products
- 11.1.9.3. Company Financials
- 11.1.9.4. SWOT Analysis
- 11.1.10 Sasol
- 11.1.10.1. Company Overview
- 11.1.10.2. Products
- 11.1.10.3. Company Financials
- 11.1.10.4. SWOT Analysis
- 11.1.11 Dow
- 11.1.11.1. Company Overview
- 11.1.11.2. Products
- 11.1.11.3. Company Financials
- 11.1.11.4. SWOT Analysis
- 11.1.12 Godrej Industries Limited
- 11.1.12.1. Company Overview
- 11.1.12.2. Products
- 11.1.12.3. Company Financials
- 11.1.12.4. SWOT Analysis
- 11.1.13 GALAXY
- 11.1.13.1. Company Overview
- 11.1.13.2. Products
- 11.1.13.3. Company Financials
- 11.1.13.4. SWOT Analysis
- 11.1.14 MITSUI CHEMICALS AMERICA INC
- 11.1.14.1. Company Overview
- 11.1.14.2. Products
- 11.1.14.3. Company Financials
- 11.1.14.4. SWOT Analysis
- 11.1.15 CLARIANT
- 11.1.15.1. Company Overview
- 11.1.15.2. Products
- 11.1.15.3. Company Financials
- 11.1.15.4. SWOT Analysis
- 11.1.16 Henkel Corporation
- 11.1.16.1. Company Overview
- 11.1.16.2. Products
- 11.1.16.3. Company Financials
- 11.1.16.4. SWOT Analysis
- 11.1.17 Kao Corporation
- 11.1.17.1. Company Overview
- 11.1.17.2. Products
- 11.1.17.3. Company Financials
- 11.1.17.4. SWOT Analysis
- 11.1.18 Stepan Company*List Not Exhaustive
- 11.1.18.1. Company Overview
- 11.1.18.2. Products
- 11.1.18.3. Company Financials
- 11.1.18.4. SWOT Analysis
- 11.1.19 Innospec
- 11.1.19.1. Company Overview
- 11.1.19.2. Products
- 11.1.19.3. Company Financials
- 11.1.19.4. SWOT Analysis
- 11.1.1 Nouryon
- 11.2. Market Entropy
- 11.2.1 Company's Key Areas Served
- 11.2.2 Recent Developments
- 11.3. Company Market Share Analysis 2025
- 11.3.1 Top 5 Companies Market Share Analysis
- 11.3.2 Top 3 Companies Market Share Analysis
- 11.4. List of Potential Customers
- 12. Research Methodology
List of Figures
- Figure 1: North America Surfactants Industry Revenue Breakdown (billion, %) by Product 2025 & 2033
- Figure 2: North America Surfactants Industry Share (%) by Company 2025
List of Tables
- Table 1: North America Surfactants Industry Revenue billion Forecast, by Type 2020 & 2033
- Table 2: North America Surfactants Industry Revenue billion Forecast, by Origin 2020 & 2033
- Table 3: North America Surfactants Industry Revenue billion Forecast, by Application 2020 & 2033
- Table 4: North America Surfactants Industry Revenue billion Forecast, by Geography 2020 & 2033
- Table 5: North America Surfactants Industry Revenue billion Forecast, by Region 2020 & 2033
- Table 6: North America Surfactants Industry Revenue billion Forecast, by Type 2020 & 2033
- Table 7: North America Surfactants Industry Revenue billion Forecast, by Origin 2020 & 2033
- Table 8: North America Surfactants Industry Revenue billion Forecast, by Application 2020 & 2033
- Table 9: North America Surfactants Industry Revenue billion Forecast, by Geography 2020 & 2033
- Table 10: North America Surfactants Industry Revenue billion Forecast, by Country 2020 & 2033
- Table 11: North America Surfactants Industry Revenue billion Forecast, by Type 2020 & 2033
- Table 12: North America Surfactants Industry Revenue billion Forecast, by Origin 2020 & 2033
- Table 13: North America Surfactants Industry Revenue billion Forecast, by Application 2020 & 2033
- Table 14: North America Surfactants Industry Revenue billion Forecast, by Geography 2020 & 2033
- Table 15: North America Surfactants Industry Revenue billion Forecast, by Country 2020 & 2033
- Table 16: North America Surfactants Industry Revenue billion Forecast, by Type 2020 & 2033
- Table 17: North America Surfactants Industry Revenue billion Forecast, by Origin 2020 & 2033
- Table 18: North America Surfactants Industry Revenue billion Forecast, by Application 2020 & 2033
- Table 19: North America Surfactants Industry Revenue billion Forecast, by Geography 2020 & 2033
- Table 20: North America Surfactants Industry Revenue billion Forecast, by Country 2020 & 2033
- Table 21: North America Surfactants Industry Revenue billion Forecast, by Type 2020 & 2033
- Table 22: North America Surfactants Industry Revenue billion Forecast, by Origin 2020 & 2033
- Table 23: North America Surfactants Industry Revenue billion Forecast, by Application 2020 & 2033
- Table 24: North America Surfactants Industry Revenue billion Forecast, by Geography 2020 & 2033
- Table 25: North America Surfactants Industry Revenue billion Forecast, by Country 2020 & 2033
Frequently Asked Questions
1. What is the projected Compound Annual Growth Rate (CAGR) of the North America Surfactants Industry?
The projected CAGR is approximately 6.2%.
2. Which companies are prominent players in the North America Surfactants Industry?
Key companies in the market include Nouryon, Solvay, Procter & Gamble, Evonik Industries AG, 3M, Croda International Plc, Ashland, BASF SE, Huntsman International LLC, Sasol, Dow, Godrej Industries Limited, GALAXY, MITSUI CHEMICALS AMERICA INC, CLARIANT, Henkel Corporation, Kao Corporation, Stepan Company*List Not Exhaustive, Innospec.
3. What are the main segments of the North America Surfactants Industry?
The market segments include Type, Origin, Application, Geography.
4. Can you provide details about the market size?
The market size is estimated to be USD 46.5 billion as of 2022.
5. What are some drivers contributing to market growth?
Increasing Demand for Bio-surfactants; Other Drivers.
6. What are the notable trends driving market growth?
Increasing Demand for Household Soaps and Detergents.
7. Are there any restraints impacting market growth?
Environmental Concerns Related to Synthetic Surfactants; Other Restraints.
8. Can you provide examples of recent developments in the market?
January 2023: Nouryon introduced Triameen Y12D (an antibacterial active) in the United States market. It enables users to create high-efficiency disinfectants for a number of applications, such as residential, institutional, and industrial applications.
9. What pricing options are available for accessing the report?
Pricing options include single-user, multi-user, and enterprise licenses priced at USD 3800, USD 4500, and USD 5800 respectively.
10. Is the market size provided in terms of value or volume?
The market size is provided in terms of value, measured in billion.
11. Are there any specific market keywords associated with the report?
Yes, the market keyword associated with the report is "North America Surfactants Industry," which aids in identifying and referencing the specific market segment covered.
12. How do I determine which pricing option suits my needs best?
The pricing options vary based on user requirements and access needs. Individual users may opt for single-user licenses, while businesses requiring broader access may choose multi-user or enterprise licenses for cost-effective access to the report.
13. Are there any additional resources or data provided in the North America Surfactants Industry report?
While the report offers comprehensive insights, it's advisable to review the specific contents or supplementary materials provided to ascertain if additional resources or data are available.
14. How can I stay updated on further developments or reports in the North America Surfactants Industry?
To stay informed about further developments, trends, and reports in the North America Surfactants Industry, consider subscribing to industry newsletters, following relevant companies and organizations, or regularly checking reputable industry news sources and publications.
Methodology
Step 1 - Identification of Relevant Samples Size from Population Database


Step 2 - Approaches for Defining Global Market Size (Value, Volume* & Price*)

Note*: In applicable scenarios
Step 3 - Data Sources
Primary Research
- Web Analytics
- Survey Reports
- Research Institute
- Latest Research Reports
- Opinion Leaders
Secondary Research
- Annual Reports
- White Paper
- Latest Press Release
- Industry Association
- Paid Database
- Investor Presentations

Step 4 - Data Triangulation
Involves using different sources of information in order to increase the validity of a study
These sources are likely to be stakeholders in a program - participants, other researchers, program staff, other community members, and so on.
Then we put all data in single framework & apply various statistical tools to find out the dynamic on the market.
During the analysis stage, feedback from the stakeholder groups would be compared to determine areas of agreement as well as areas of divergence