

Key Insights
The global obesity surgery device market is projected for substantial expansion, fueled by the escalating global prevalence of obesity and its associated comorbidities. Increased incidence of type 2 diabetes, cardiovascular disease, and sleep apnea is driving demand for effective weight-loss interventions. Advancements in minimally invasive surgical techniques, including laparoscopic and robotic approaches, are a key growth driver, offering patients reduced recovery times, minimized pain, and smaller incisions, thereby boosting procedure volumes. The development of innovative devices, such as advanced stapling systems, adjustable gastric banding devices, and enhanced endoscopic tools, is continuously improving surgical efficacy and patient safety. Key market players are investing in R&D to expand their product offerings and strengthen their market standing.
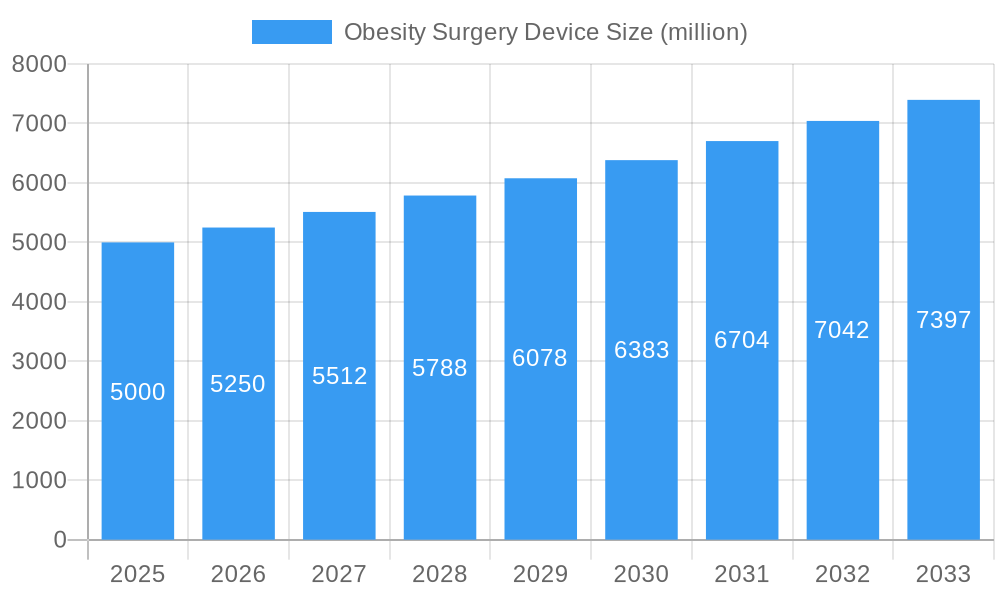
Obesity Surgery Device Market Size (In Billion)
The market is segmented by device type (gastric banding, gastric bypass, sleeve gastrectomy), procedure type, and end-user (hospitals, clinics). Despite challenges including high procedure costs and potential surgical complications, the market's growth trajectory remains positive, supported by increasing healthcare expenditure and heightened awareness of obesity-related health risks.
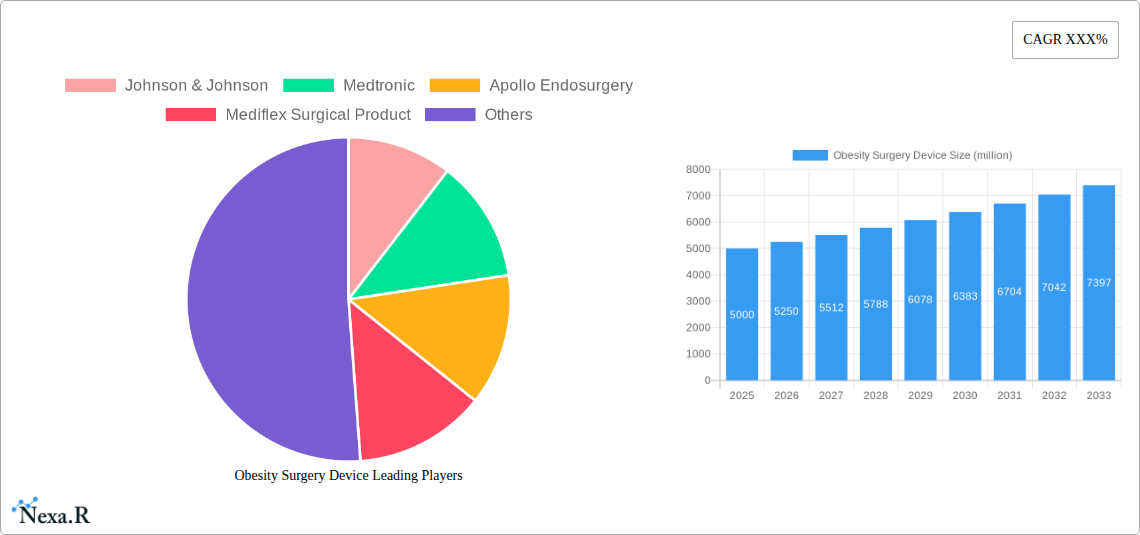
Obesity Surgery Device Company Market Share
The market is anticipated to grow at a Compound Annual Growth Rate (CAGR) of 6.4%, reaching a market size of $2 billion by 2025. While North America and Europe currently dominate market share due to robust healthcare spending and infrastructure, Asia-Pacific and Latin America are expected to witness significant growth driven by rising disposable incomes, improved healthcare access, and increasing awareness of obesity-related health issues. The competitive landscape features established and emerging companies fostering innovation through strategic alliances, mergers, acquisitions, and technological collaborations. A continued focus on patient safety, enhanced device designs, and the expansion of minimally invasive surgical techniques will be critical for sustained market growth.
Obesity Surgery Device Market Report: 2019-2033
This comprehensive report provides a detailed analysis of the global Obesity Surgery Device market, offering in-depth insights into market dynamics, growth trends, key players, and future outlook. The study covers the period 2019-2033, with a base year of 2025 and a forecast period of 2025-2033. The report segments the market by device type and geography, providing granular data for informed strategic decision-making. The total market size is projected to reach xx million units by 2033.
Obesity Surgery Device Market Dynamics & Structure
The global obesity surgery device market is characterized by moderate concentration, with key players like Johnson & Johnson, Medtronic, and Apollo Endosurgery holding significant market share. Technological advancements, particularly in minimally invasive procedures and robotic surgery, are major drivers. Regulatory frameworks, including those related to safety and efficacy, influence market growth. Competitive substitutes, such as lifestyle interventions and pharmaceutical treatments, pose a challenge. The end-user demographics are primarily obese adults, with a growing prevalence of obesity driving market expansion. M&A activity has been relatively moderate in recent years, with approximately xx deals recorded between 2019 and 2024, resulting in a consolidation of xx% market share among the top 5 players.
- Market Concentration: Moderately concentrated, with top 5 players holding xx% market share in 2024.
- Technological Innovation: Minimally invasive techniques, robotic-assisted surgery, and smart devices drive growth.
- Regulatory Landscape: Stringent regulations regarding safety and efficacy influence market access.
- Competitive Substitutes: Lifestyle changes and pharmaceutical interventions present competition.
- End-User Demographics: Primarily obese adults aged 18-65, with a growing target population.
- M&A Trends: Moderate activity, with xx deals recorded from 2019-2024 leading to xx% market consolidation.
- Innovation Barriers: High regulatory hurdles, lengthy clinical trials, and significant capital investment.
Obesity Surgery Device Growth Trends & Insights
The obesity surgery device market experienced significant growth during the historical period (2019-2024), with a CAGR of xx%. This growth is attributed to several factors, including rising obesity prevalence, increased awareness of surgical weight loss options, and technological advancements leading to improved patient outcomes. Market penetration remains relatively low, indicating significant growth potential. Technological disruptions, particularly the adoption of robotic-assisted surgery, have significantly improved procedure accuracy and reduced recovery times, further boosting market adoption. Shifting consumer behavior towards minimally invasive procedures and improved accessibility to healthcare are also contributing to growth. The estimated market size in 2025 is xx million units, projected to reach xx million units by 2033, driven by a CAGR of xx%.
Dominant Regions, Countries, or Segments in Obesity Surgery Device
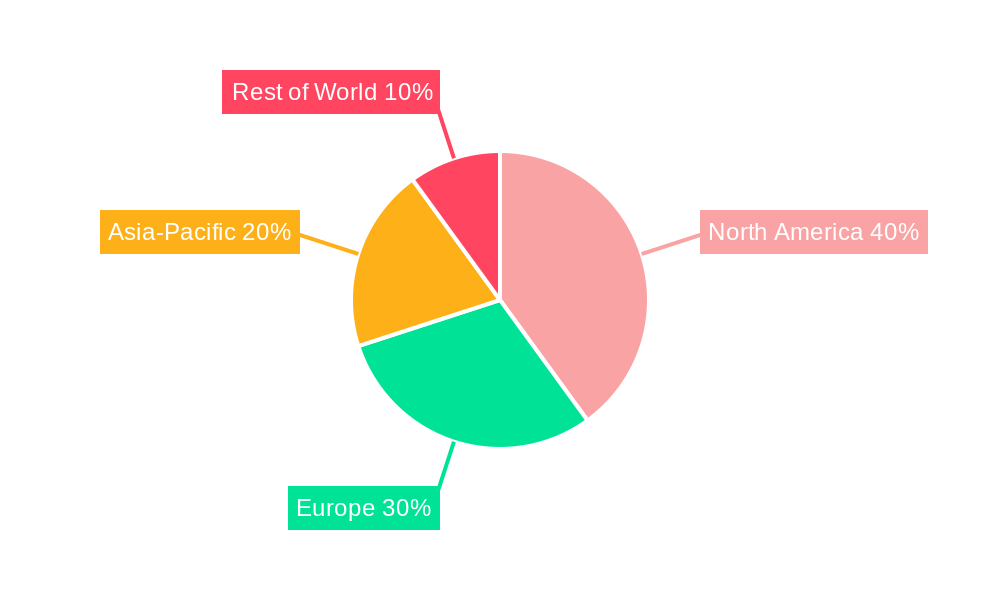
North America currently dominates the obesity surgery device market, holding the largest market share of approximately xx% in 2024 due to high obesity prevalence, well-established healthcare infrastructure, and high adoption rates of advanced technologies. Europe follows as the second largest market, with a market share of xx% in 2024, while the Asia-Pacific region is poised for significant growth driven by rising disposable incomes and increased healthcare spending.
- North America: High obesity prevalence, advanced healthcare infrastructure, and high adoption rates of minimally invasive surgeries.
- Europe: Growing awareness of bariatric surgery, coupled with increasing healthcare investments.
- Asia-Pacific: Rapid growth potential driven by rising disposable income and healthcare spending.
- Key Market Drivers: Increasing obesity rates, rising healthcare expenditure, technological advancements, favorable reimbursement policies.
Obesity Surgery Device Product Landscape
The obesity surgery device market encompasses a range of products, including laparoscopic instruments, staplers, and robotic systems. Recent innovations focus on enhancing minimally invasive techniques, improving surgical precision, and reducing recovery times. Key features include enhanced visualization capabilities, improved ergonomics, and advanced material properties for enhanced durability. The unique selling propositions often revolve around reduced invasiveness, improved patient outcomes, and shorter hospital stays.
Key Drivers, Barriers & Challenges in Obesity Surgery Device
Key Drivers:
- Rising prevalence of obesity globally.
- Technological advancements in minimally invasive surgery.
- Increased awareness and acceptance of bariatric procedures.
- Favorable reimbursement policies in developed markets.
Challenges and Restraints:
- High cost of devices and procedures limiting access.
- Stringent regulatory approvals and safety concerns.
- Potential complications and long-term risks associated with surgery.
- Competition from alternative weight loss methods. The impact of these challenges is estimated to reduce market growth by approximately xx% by 2033.
Emerging Opportunities in Obesity Surgery Device
Emerging opportunities lie in the development of innovative devices, such as single-incision surgery systems and improved robotic platforms. Untapped markets in developing countries present significant growth potential. The rise of telehealth and remote monitoring could improve patient care and reduce post-operative complications. Personalized medicine approaches targeting specific patient needs could further enhance market expansion.
Growth Accelerators in the Obesity Surgery Device Industry
Strategic partnerships between device manufacturers and healthcare providers are crucial for market expansion. Continuous technological innovation and improvements in device design and functionality will further drive growth. Expanding into untapped markets in developing countries, focusing on creating affordable and accessible devices is key.
Key Players Shaping the Obesity Surgery Device Market
- Johnson & Johnson
- Medtronic
- Apollo Endosurgery
- Mediflex Surgical Product
- Aspire Bariatrics
- Spatz FGIA
- MetaCure
- IntraPace
- TransEnterix
Notable Milestones in Obesity Surgery Device Sector
- 2020: FDA approval of a new robotic-assisted surgery system for bariatric procedures.
- 2022: Launch of a novel minimally invasive stapling device by a major player.
- 2023: Acquisition of a smaller device manufacturer by a leading medical technology company.
- 2024: Publication of landmark clinical trial data demonstrating improved outcomes with a new surgical technique.
In-Depth Obesity Surgery Device Market Outlook
The future of the obesity surgery device market is bright, with continued growth driven by technological advancements, expansion into new markets, and rising obesity rates globally. Strategic collaborations and a focus on improving patient outcomes will be essential for long-term success. The market is projected to witness significant expansion, driven by the increasing adoption of minimally invasive procedures and the development of advanced technologies. This growth will present significant opportunities for companies to establish a strong market presence and capitalize on unmet needs.
Obesity Surgery Device Segmentation
-
1. Application
- 1.1. Hospitals
- 1.2. Clinics
- 1.3. Others
-
2. Type
- 2.1. Intragastric Balloons
- 2.2. Gastric Electrical Stimulation
- 2.3. Gastric Bands
- 2.4. Others
Obesity Surgery Device Segmentation By Geography
-
1. North America
- 1.1. United States
- 1.2. Canada
- 1.3. Mexico
-
2. South America
- 2.1. Brazil
- 2.2. Argentina
- 2.3. Rest of South America
-
3. Europe
- 3.1. United Kingdom
- 3.2. Germany
- 3.3. France
- 3.4. Italy
- 3.5. Spain
- 3.6. Russia
- 3.7. Benelux
- 3.8. Nordics
- 3.9. Rest of Europe
-
4. Middle East & Africa
- 4.1. Turkey
- 4.2. Israel
- 4.3. GCC
- 4.4. North Africa
- 4.5. South Africa
- 4.6. Rest of Middle East & Africa
-
5. Asia Pacific
- 5.1. China
- 5.2. India
- 5.3. Japan
- 5.4. South Korea
- 5.5. ASEAN
- 5.6. Oceania
- 5.7. Rest of Asia Pacific
Obesity Surgery Device Regional Market Share
Geographic Coverage of Obesity Surgery Device
Obesity Surgery Device REPORT HIGHLIGHTS
| Aspects | Details |
|---|---|
| Study Period | 2020-2034 |
| Base Year | 2025 |
| Estimated Year | 2026 |
| Forecast Period | 2026-2034 |
| Historical Period | 2020-2025 |
| Growth Rate | CAGR of 6.4% from 2020-2034 |
| Segmentation |
|
Table of Contents
- 1. Introduction
- 1.1. Research Scope
- 1.2. Market Segmentation
- 1.3. Research Methodology
- 1.4. Definitions and Assumptions
- 2. Executive Summary
- 2.1. Introduction
- 3. Market Dynamics
- 3.1. Introduction
- 3.2. Market Drivers
- 3.3. Market Restrains
- 3.4. Market Trends
- 4. Market Factor Analysis
- 4.1. Porters Five Forces
- 4.2. Supply/Value Chain
- 4.3. PESTEL analysis
- 4.4. Market Entropy
- 4.5. Patent/Trademark Analysis
- 5. Global Obesity Surgery Device Analysis, Insights and Forecast, 2020-2032
- 5.1. Market Analysis, Insights and Forecast - by Application
- 5.1.1. Hospitals
- 5.1.2. Clinics
- 5.1.3. Others
- 5.2. Market Analysis, Insights and Forecast - by Type
- 5.2.1. Intragastric Balloons
- 5.2.2. Gastric Electrical Stimulation
- 5.2.3. Gastric Bands
- 5.2.4. Others
- 5.3. Market Analysis, Insights and Forecast - by Region
- 5.3.1. North America
- 5.3.2. South America
- 5.3.3. Europe
- 5.3.4. Middle East & Africa
- 5.3.5. Asia Pacific
- 5.1. Market Analysis, Insights and Forecast - by Application
- 6. North America Obesity Surgery Device Analysis, Insights and Forecast, 2020-2032
- 6.1. Market Analysis, Insights and Forecast - by Application
- 6.1.1. Hospitals
- 6.1.2. Clinics
- 6.1.3. Others
- 6.2. Market Analysis, Insights and Forecast - by Type
- 6.2.1. Intragastric Balloons
- 6.2.2. Gastric Electrical Stimulation
- 6.2.3. Gastric Bands
- 6.2.4. Others
- 6.1. Market Analysis, Insights and Forecast - by Application
- 7. South America Obesity Surgery Device Analysis, Insights and Forecast, 2020-2032
- 7.1. Market Analysis, Insights and Forecast - by Application
- 7.1.1. Hospitals
- 7.1.2. Clinics
- 7.1.3. Others
- 7.2. Market Analysis, Insights and Forecast - by Type
- 7.2.1. Intragastric Balloons
- 7.2.2. Gastric Electrical Stimulation
- 7.2.3. Gastric Bands
- 7.2.4. Others
- 7.1. Market Analysis, Insights and Forecast - by Application
- 8. Europe Obesity Surgery Device Analysis, Insights and Forecast, 2020-2032
- 8.1. Market Analysis, Insights and Forecast - by Application
- 8.1.1. Hospitals
- 8.1.2. Clinics
- 8.1.3. Others
- 8.2. Market Analysis, Insights and Forecast - by Type
- 8.2.1. Intragastric Balloons
- 8.2.2. Gastric Electrical Stimulation
- 8.2.3. Gastric Bands
- 8.2.4. Others
- 8.1. Market Analysis, Insights and Forecast - by Application
- 9. Middle East & Africa Obesity Surgery Device Analysis, Insights and Forecast, 2020-2032
- 9.1. Market Analysis, Insights and Forecast - by Application
- 9.1.1. Hospitals
- 9.1.2. Clinics
- 9.1.3. Others
- 9.2. Market Analysis, Insights and Forecast - by Type
- 9.2.1. Intragastric Balloons
- 9.2.2. Gastric Electrical Stimulation
- 9.2.3. Gastric Bands
- 9.2.4. Others
- 9.1. Market Analysis, Insights and Forecast - by Application
- 10. Asia Pacific Obesity Surgery Device Analysis, Insights and Forecast, 2020-2032
- 10.1. Market Analysis, Insights and Forecast - by Application
- 10.1.1. Hospitals
- 10.1.2. Clinics
- 10.1.3. Others
- 10.2. Market Analysis, Insights and Forecast - by Type
- 10.2.1. Intragastric Balloons
- 10.2.2. Gastric Electrical Stimulation
- 10.2.3. Gastric Bands
- 10.2.4. Others
- 10.1. Market Analysis, Insights and Forecast - by Application
- 11. Competitive Analysis
- 11.1. Global Market Share Analysis 2025
- 11.2. Company Profiles
- 11.2.1 Johnson & Johnson
- 11.2.1.1. Overview
- 11.2.1.2. Products
- 11.2.1.3. SWOT Analysis
- 11.2.1.4. Recent Developments
- 11.2.1.5. Financials (Based on Availability)
- 11.2.2 Medtronic
- 11.2.2.1. Overview
- 11.2.2.2. Products
- 11.2.2.3. SWOT Analysis
- 11.2.2.4. Recent Developments
- 11.2.2.5. Financials (Based on Availability)
- 11.2.3 Apollo Endosurgery
- 11.2.3.1. Overview
- 11.2.3.2. Products
- 11.2.3.3. SWOT Analysis
- 11.2.3.4. Recent Developments
- 11.2.3.5. Financials (Based on Availability)
- 11.2.4 Medtronic
- 11.2.4.1. Overview
- 11.2.4.2. Products
- 11.2.4.3. SWOT Analysis
- 11.2.4.4. Recent Developments
- 11.2.4.5. Financials (Based on Availability)
- 11.2.5 Mediflex Surgical Product
- 11.2.5.1. Overview
- 11.2.5.2. Products
- 11.2.5.3. SWOT Analysis
- 11.2.5.4. Recent Developments
- 11.2.5.5. Financials (Based on Availability)
- 11.2.6 Aspire Bariatrics
- 11.2.6.1. Overview
- 11.2.6.2. Products
- 11.2.6.3. SWOT Analysis
- 11.2.6.4. Recent Developments
- 11.2.6.5. Financials (Based on Availability)
- 11.2.7 Spatz FGIA
- 11.2.7.1. Overview
- 11.2.7.2. Products
- 11.2.7.3. SWOT Analysis
- 11.2.7.4. Recent Developments
- 11.2.7.5. Financials (Based on Availability)
- 11.2.8 MetaCure
- 11.2.8.1. Overview
- 11.2.8.2. Products
- 11.2.8.3. SWOT Analysis
- 11.2.8.4. Recent Developments
- 11.2.8.5. Financials (Based on Availability)
- 11.2.9 IntraPace
- 11.2.9.1. Overview
- 11.2.9.2. Products
- 11.2.9.3. SWOT Analysis
- 11.2.9.4. Recent Developments
- 11.2.9.5. Financials (Based on Availability)
- 11.2.10 TransEnterix
- 11.2.10.1. Overview
- 11.2.10.2. Products
- 11.2.10.3. SWOT Analysis
- 11.2.10.4. Recent Developments
- 11.2.10.5. Financials (Based on Availability)
- 11.2.1 Johnson & Johnson
List of Figures
- Figure 1: Global Obesity Surgery Device Revenue Breakdown (billion, %) by Region 2025 & 2033
- Figure 2: Global Obesity Surgery Device Volume Breakdown (K, %) by Region 2025 & 2033
- Figure 3: North America Obesity Surgery Device Revenue (billion), by Application 2025 & 2033
- Figure 4: North America Obesity Surgery Device Volume (K), by Application 2025 & 2033
- Figure 5: North America Obesity Surgery Device Revenue Share (%), by Application 2025 & 2033
- Figure 6: North America Obesity Surgery Device Volume Share (%), by Application 2025 & 2033
- Figure 7: North America Obesity Surgery Device Revenue (billion), by Type 2025 & 2033
- Figure 8: North America Obesity Surgery Device Volume (K), by Type 2025 & 2033
- Figure 9: North America Obesity Surgery Device Revenue Share (%), by Type 2025 & 2033
- Figure 10: North America Obesity Surgery Device Volume Share (%), by Type 2025 & 2033
- Figure 11: North America Obesity Surgery Device Revenue (billion), by Country 2025 & 2033
- Figure 12: North America Obesity Surgery Device Volume (K), by Country 2025 & 2033
- Figure 13: North America Obesity Surgery Device Revenue Share (%), by Country 2025 & 2033
- Figure 14: North America Obesity Surgery Device Volume Share (%), by Country 2025 & 2033
- Figure 15: South America Obesity Surgery Device Revenue (billion), by Application 2025 & 2033
- Figure 16: South America Obesity Surgery Device Volume (K), by Application 2025 & 2033
- Figure 17: South America Obesity Surgery Device Revenue Share (%), by Application 2025 & 2033
- Figure 18: South America Obesity Surgery Device Volume Share (%), by Application 2025 & 2033
- Figure 19: South America Obesity Surgery Device Revenue (billion), by Type 2025 & 2033
- Figure 20: South America Obesity Surgery Device Volume (K), by Type 2025 & 2033
- Figure 21: South America Obesity Surgery Device Revenue Share (%), by Type 2025 & 2033
- Figure 22: South America Obesity Surgery Device Volume Share (%), by Type 2025 & 2033
- Figure 23: South America Obesity Surgery Device Revenue (billion), by Country 2025 & 2033
- Figure 24: South America Obesity Surgery Device Volume (K), by Country 2025 & 2033
- Figure 25: South America Obesity Surgery Device Revenue Share (%), by Country 2025 & 2033
- Figure 26: South America Obesity Surgery Device Volume Share (%), by Country 2025 & 2033
- Figure 27: Europe Obesity Surgery Device Revenue (billion), by Application 2025 & 2033
- Figure 28: Europe Obesity Surgery Device Volume (K), by Application 2025 & 2033
- Figure 29: Europe Obesity Surgery Device Revenue Share (%), by Application 2025 & 2033
- Figure 30: Europe Obesity Surgery Device Volume Share (%), by Application 2025 & 2033
- Figure 31: Europe Obesity Surgery Device Revenue (billion), by Type 2025 & 2033
- Figure 32: Europe Obesity Surgery Device Volume (K), by Type 2025 & 2033
- Figure 33: Europe Obesity Surgery Device Revenue Share (%), by Type 2025 & 2033
- Figure 34: Europe Obesity Surgery Device Volume Share (%), by Type 2025 & 2033
- Figure 35: Europe Obesity Surgery Device Revenue (billion), by Country 2025 & 2033
- Figure 36: Europe Obesity Surgery Device Volume (K), by Country 2025 & 2033
- Figure 37: Europe Obesity Surgery Device Revenue Share (%), by Country 2025 & 2033
- Figure 38: Europe Obesity Surgery Device Volume Share (%), by Country 2025 & 2033
- Figure 39: Middle East & Africa Obesity Surgery Device Revenue (billion), by Application 2025 & 2033
- Figure 40: Middle East & Africa Obesity Surgery Device Volume (K), by Application 2025 & 2033
- Figure 41: Middle East & Africa Obesity Surgery Device Revenue Share (%), by Application 2025 & 2033
- Figure 42: Middle East & Africa Obesity Surgery Device Volume Share (%), by Application 2025 & 2033
- Figure 43: Middle East & Africa Obesity Surgery Device Revenue (billion), by Type 2025 & 2033
- Figure 44: Middle East & Africa Obesity Surgery Device Volume (K), by Type 2025 & 2033
- Figure 45: Middle East & Africa Obesity Surgery Device Revenue Share (%), by Type 2025 & 2033
- Figure 46: Middle East & Africa Obesity Surgery Device Volume Share (%), by Type 2025 & 2033
- Figure 47: Middle East & Africa Obesity Surgery Device Revenue (billion), by Country 2025 & 2033
- Figure 48: Middle East & Africa Obesity Surgery Device Volume (K), by Country 2025 & 2033
- Figure 49: Middle East & Africa Obesity Surgery Device Revenue Share (%), by Country 2025 & 2033
- Figure 50: Middle East & Africa Obesity Surgery Device Volume Share (%), by Country 2025 & 2033
- Figure 51: Asia Pacific Obesity Surgery Device Revenue (billion), by Application 2025 & 2033
- Figure 52: Asia Pacific Obesity Surgery Device Volume (K), by Application 2025 & 2033
- Figure 53: Asia Pacific Obesity Surgery Device Revenue Share (%), by Application 2025 & 2033
- Figure 54: Asia Pacific Obesity Surgery Device Volume Share (%), by Application 2025 & 2033
- Figure 55: Asia Pacific Obesity Surgery Device Revenue (billion), by Type 2025 & 2033
- Figure 56: Asia Pacific Obesity Surgery Device Volume (K), by Type 2025 & 2033
- Figure 57: Asia Pacific Obesity Surgery Device Revenue Share (%), by Type 2025 & 2033
- Figure 58: Asia Pacific Obesity Surgery Device Volume Share (%), by Type 2025 & 2033
- Figure 59: Asia Pacific Obesity Surgery Device Revenue (billion), by Country 2025 & 2033
- Figure 60: Asia Pacific Obesity Surgery Device Volume (K), by Country 2025 & 2033
- Figure 61: Asia Pacific Obesity Surgery Device Revenue Share (%), by Country 2025 & 2033
- Figure 62: Asia Pacific Obesity Surgery Device Volume Share (%), by Country 2025 & 2033
List of Tables
- Table 1: Global Obesity Surgery Device Revenue billion Forecast, by Application 2020 & 2033
- Table 2: Global Obesity Surgery Device Volume K Forecast, by Application 2020 & 2033
- Table 3: Global Obesity Surgery Device Revenue billion Forecast, by Type 2020 & 2033
- Table 4: Global Obesity Surgery Device Volume K Forecast, by Type 2020 & 2033
- Table 5: Global Obesity Surgery Device Revenue billion Forecast, by Region 2020 & 2033
- Table 6: Global Obesity Surgery Device Volume K Forecast, by Region 2020 & 2033
- Table 7: Global Obesity Surgery Device Revenue billion Forecast, by Application 2020 & 2033
- Table 8: Global Obesity Surgery Device Volume K Forecast, by Application 2020 & 2033
- Table 9: Global Obesity Surgery Device Revenue billion Forecast, by Type 2020 & 2033
- Table 10: Global Obesity Surgery Device Volume K Forecast, by Type 2020 & 2033
- Table 11: Global Obesity Surgery Device Revenue billion Forecast, by Country 2020 & 2033
- Table 12: Global Obesity Surgery Device Volume K Forecast, by Country 2020 & 2033
- Table 13: United States Obesity Surgery Device Revenue (billion) Forecast, by Application 2020 & 2033
- Table 14: United States Obesity Surgery Device Volume (K) Forecast, by Application 2020 & 2033
- Table 15: Canada Obesity Surgery Device Revenue (billion) Forecast, by Application 2020 & 2033
- Table 16: Canada Obesity Surgery Device Volume (K) Forecast, by Application 2020 & 2033
- Table 17: Mexico Obesity Surgery Device Revenue (billion) Forecast, by Application 2020 & 2033
- Table 18: Mexico Obesity Surgery Device Volume (K) Forecast, by Application 2020 & 2033
- Table 19: Global Obesity Surgery Device Revenue billion Forecast, by Application 2020 & 2033
- Table 20: Global Obesity Surgery Device Volume K Forecast, by Application 2020 & 2033
- Table 21: Global Obesity Surgery Device Revenue billion Forecast, by Type 2020 & 2033
- Table 22: Global Obesity Surgery Device Volume K Forecast, by Type 2020 & 2033
- Table 23: Global Obesity Surgery Device Revenue billion Forecast, by Country 2020 & 2033
- Table 24: Global Obesity Surgery Device Volume K Forecast, by Country 2020 & 2033
- Table 25: Brazil Obesity Surgery Device Revenue (billion) Forecast, by Application 2020 & 2033
- Table 26: Brazil Obesity Surgery Device Volume (K) Forecast, by Application 2020 & 2033
- Table 27: Argentina Obesity Surgery Device Revenue (billion) Forecast, by Application 2020 & 2033
- Table 28: Argentina Obesity Surgery Device Volume (K) Forecast, by Application 2020 & 2033
- Table 29: Rest of South America Obesity Surgery Device Revenue (billion) Forecast, by Application 2020 & 2033
- Table 30: Rest of South America Obesity Surgery Device Volume (K) Forecast, by Application 2020 & 2033
- Table 31: Global Obesity Surgery Device Revenue billion Forecast, by Application 2020 & 2033
- Table 32: Global Obesity Surgery Device Volume K Forecast, by Application 2020 & 2033
- Table 33: Global Obesity Surgery Device Revenue billion Forecast, by Type 2020 & 2033
- Table 34: Global Obesity Surgery Device Volume K Forecast, by Type 2020 & 2033
- Table 35: Global Obesity Surgery Device Revenue billion Forecast, by Country 2020 & 2033
- Table 36: Global Obesity Surgery Device Volume K Forecast, by Country 2020 & 2033
- Table 37: United Kingdom Obesity Surgery Device Revenue (billion) Forecast, by Application 2020 & 2033
- Table 38: United Kingdom Obesity Surgery Device Volume (K) Forecast, by Application 2020 & 2033
- Table 39: Germany Obesity Surgery Device Revenue (billion) Forecast, by Application 2020 & 2033
- Table 40: Germany Obesity Surgery Device Volume (K) Forecast, by Application 2020 & 2033
- Table 41: France Obesity Surgery Device Revenue (billion) Forecast, by Application 2020 & 2033
- Table 42: France Obesity Surgery Device Volume (K) Forecast, by Application 2020 & 2033
- Table 43: Italy Obesity Surgery Device Revenue (billion) Forecast, by Application 2020 & 2033
- Table 44: Italy Obesity Surgery Device Volume (K) Forecast, by Application 2020 & 2033
- Table 45: Spain Obesity Surgery Device Revenue (billion) Forecast, by Application 2020 & 2033
- Table 46: Spain Obesity Surgery Device Volume (K) Forecast, by Application 2020 & 2033
- Table 47: Russia Obesity Surgery Device Revenue (billion) Forecast, by Application 2020 & 2033
- Table 48: Russia Obesity Surgery Device Volume (K) Forecast, by Application 2020 & 2033
- Table 49: Benelux Obesity Surgery Device Revenue (billion) Forecast, by Application 2020 & 2033
- Table 50: Benelux Obesity Surgery Device Volume (K) Forecast, by Application 2020 & 2033
- Table 51: Nordics Obesity Surgery Device Revenue (billion) Forecast, by Application 2020 & 2033
- Table 52: Nordics Obesity Surgery Device Volume (K) Forecast, by Application 2020 & 2033
- Table 53: Rest of Europe Obesity Surgery Device Revenue (billion) Forecast, by Application 2020 & 2033
- Table 54: Rest of Europe Obesity Surgery Device Volume (K) Forecast, by Application 2020 & 2033
- Table 55: Global Obesity Surgery Device Revenue billion Forecast, by Application 2020 & 2033
- Table 56: Global Obesity Surgery Device Volume K Forecast, by Application 2020 & 2033
- Table 57: Global Obesity Surgery Device Revenue billion Forecast, by Type 2020 & 2033
- Table 58: Global Obesity Surgery Device Volume K Forecast, by Type 2020 & 2033
- Table 59: Global Obesity Surgery Device Revenue billion Forecast, by Country 2020 & 2033
- Table 60: Global Obesity Surgery Device Volume K Forecast, by Country 2020 & 2033
- Table 61: Turkey Obesity Surgery Device Revenue (billion) Forecast, by Application 2020 & 2033
- Table 62: Turkey Obesity Surgery Device Volume (K) Forecast, by Application 2020 & 2033
- Table 63: Israel Obesity Surgery Device Revenue (billion) Forecast, by Application 2020 & 2033
- Table 64: Israel Obesity Surgery Device Volume (K) Forecast, by Application 2020 & 2033
- Table 65: GCC Obesity Surgery Device Revenue (billion) Forecast, by Application 2020 & 2033
- Table 66: GCC Obesity Surgery Device Volume (K) Forecast, by Application 2020 & 2033
- Table 67: North Africa Obesity Surgery Device Revenue (billion) Forecast, by Application 2020 & 2033
- Table 68: North Africa Obesity Surgery Device Volume (K) Forecast, by Application 2020 & 2033
- Table 69: South Africa Obesity Surgery Device Revenue (billion) Forecast, by Application 2020 & 2033
- Table 70: South Africa Obesity Surgery Device Volume (K) Forecast, by Application 2020 & 2033
- Table 71: Rest of Middle East & Africa Obesity Surgery Device Revenue (billion) Forecast, by Application 2020 & 2033
- Table 72: Rest of Middle East & Africa Obesity Surgery Device Volume (K) Forecast, by Application 2020 & 2033
- Table 73: Global Obesity Surgery Device Revenue billion Forecast, by Application 2020 & 2033
- Table 74: Global Obesity Surgery Device Volume K Forecast, by Application 2020 & 2033
- Table 75: Global Obesity Surgery Device Revenue billion Forecast, by Type 2020 & 2033
- Table 76: Global Obesity Surgery Device Volume K Forecast, by Type 2020 & 2033
- Table 77: Global Obesity Surgery Device Revenue billion Forecast, by Country 2020 & 2033
- Table 78: Global Obesity Surgery Device Volume K Forecast, by Country 2020 & 2033
- Table 79: China Obesity Surgery Device Revenue (billion) Forecast, by Application 2020 & 2033
- Table 80: China Obesity Surgery Device Volume (K) Forecast, by Application 2020 & 2033
- Table 81: India Obesity Surgery Device Revenue (billion) Forecast, by Application 2020 & 2033
- Table 82: India Obesity Surgery Device Volume (K) Forecast, by Application 2020 & 2033
- Table 83: Japan Obesity Surgery Device Revenue (billion) Forecast, by Application 2020 & 2033
- Table 84: Japan Obesity Surgery Device Volume (K) Forecast, by Application 2020 & 2033
- Table 85: South Korea Obesity Surgery Device Revenue (billion) Forecast, by Application 2020 & 2033
- Table 86: South Korea Obesity Surgery Device Volume (K) Forecast, by Application 2020 & 2033
- Table 87: ASEAN Obesity Surgery Device Revenue (billion) Forecast, by Application 2020 & 2033
- Table 88: ASEAN Obesity Surgery Device Volume (K) Forecast, by Application 2020 & 2033
- Table 89: Oceania Obesity Surgery Device Revenue (billion) Forecast, by Application 2020 & 2033
- Table 90: Oceania Obesity Surgery Device Volume (K) Forecast, by Application 2020 & 2033
- Table 91: Rest of Asia Pacific Obesity Surgery Device Revenue (billion) Forecast, by Application 2020 & 2033
- Table 92: Rest of Asia Pacific Obesity Surgery Device Volume (K) Forecast, by Application 2020 & 2033
Frequently Asked Questions
1. What is the projected Compound Annual Growth Rate (CAGR) of the Obesity Surgery Device?
The projected CAGR is approximately 6.4%.
2. Which companies are prominent players in the Obesity Surgery Device?
Key companies in the market include Johnson & Johnson, Medtronic, Apollo Endosurgery, Medtronic, Mediflex Surgical Product, Aspire Bariatrics, Spatz FGIA, MetaCure, IntraPace, TransEnterix.
3. What are the main segments of the Obesity Surgery Device?
The market segments include Application, Type.
4. Can you provide details about the market size?
The market size is estimated to be USD 2 billion as of 2022.
5. What are some drivers contributing to market growth?
N/A
6. What are the notable trends driving market growth?
N/A
7. Are there any restraints impacting market growth?
N/A
8. Can you provide examples of recent developments in the market?
N/A
9. What pricing options are available for accessing the report?
Pricing options include single-user, multi-user, and enterprise licenses priced at USD 3950.00, USD 5925.00, and USD 7900.00 respectively.
10. Is the market size provided in terms of value or volume?
The market size is provided in terms of value, measured in billion and volume, measured in K.
11. Are there any specific market keywords associated with the report?
Yes, the market keyword associated with the report is "Obesity Surgery Device," which aids in identifying and referencing the specific market segment covered.
12. How do I determine which pricing option suits my needs best?
The pricing options vary based on user requirements and access needs. Individual users may opt for single-user licenses, while businesses requiring broader access may choose multi-user or enterprise licenses for cost-effective access to the report.
13. Are there any additional resources or data provided in the Obesity Surgery Device report?
While the report offers comprehensive insights, it's advisable to review the specific contents or supplementary materials provided to ascertain if additional resources or data are available.
14. How can I stay updated on further developments or reports in the Obesity Surgery Device?
To stay informed about further developments, trends, and reports in the Obesity Surgery Device, consider subscribing to industry newsletters, following relevant companies and organizations, or regularly checking reputable industry news sources and publications.
Methodology
Step 1 - Identification of Relevant Samples Size from Population Database


Step 2 - Approaches for Defining Global Market Size (Value, Volume* & Price*)

Note*: In applicable scenarios
Step 3 - Data Sources
Primary Research
- Web Analytics
- Survey Reports
- Research Institute
- Latest Research Reports
- Opinion Leaders
Secondary Research
- Annual Reports
- White Paper
- Latest Press Release
- Industry Association
- Paid Database
- Investor Presentations

Step 4 - Data Triangulation
Involves using different sources of information in order to increase the validity of a study
These sources are likely to be stakeholders in a program - participants, other researchers, program staff, other community members, and so on.
Then we put all data in single framework & apply various statistical tools to find out the dynamic on the market.
During the analysis stage, feedback from the stakeholder groups would be compared to determine areas of agreement as well as areas of divergence