

Key Insights
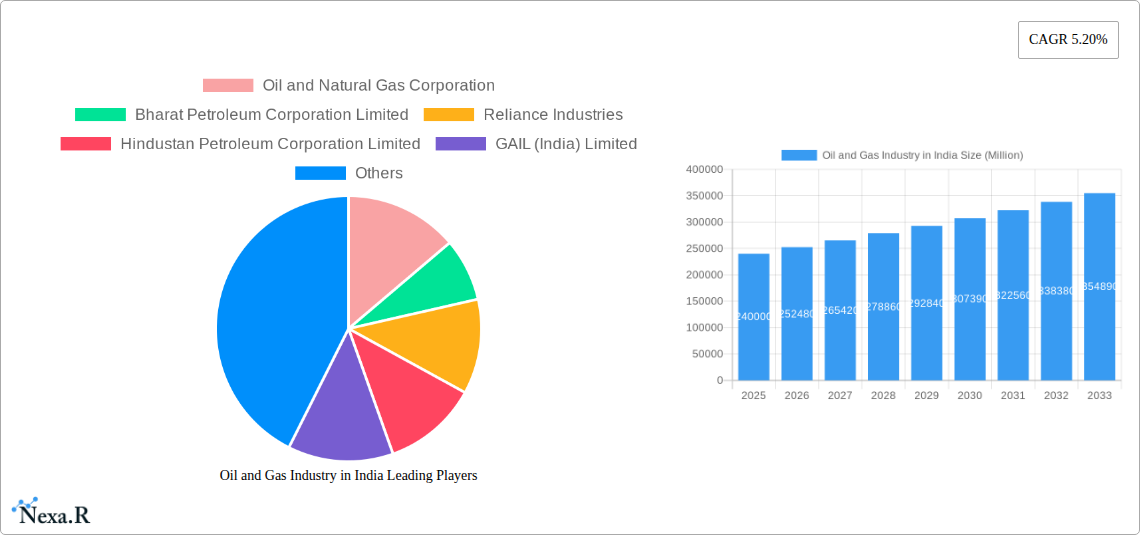
The Indian oil and gas industry, currently valued at approximately ₹20 trillion (USD 240 billion) in 2025, is poised for robust growth, projected to expand at a Compound Annual Growth Rate (CAGR) of 5.20% from 2025 to 2033. This expansion is fueled by several key drivers. Increasing energy demand from a rapidly growing population and industrial sector creates a strong foundation for market growth. Furthermore, government initiatives promoting infrastructure development, including pipelines and refining capacity, are bolstering the sector. A rising focus on cleaner energy sources, while presenting some challenges, also opens opportunities for investment in natural gas and renewable energy integration within the oil and gas infrastructure. The increasing adoption of advanced technologies like digitalization and automation for enhanced efficiency and safety are also contributing significantly. However, challenges remain, including fluctuating global crude oil prices, environmental concerns leading to stricter regulations, and geopolitical uncertainties impacting supply chains.
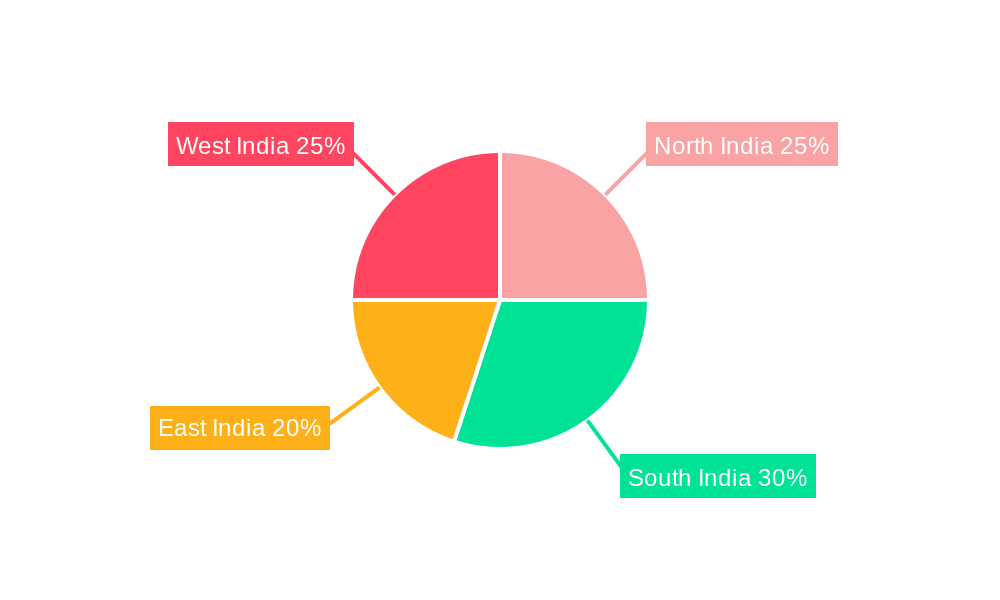
The sector's segmentation reveals significant opportunities across various deployment locations (onshore and offshore) and sectors (petrochemical plants, midstream, downstream, and upstream). Major players such as Oil and Natural Gas Corporation, Reliance Industries, and Indian Oil Corporation are key contributors, shaping the competitive landscape. Regional variations exist, with potential for uneven growth across North, South, East, and West India, largely dictated by infrastructure availability, resource distribution, and industrial concentration. The forecast period (2025-2033) anticipates a continued increase in market size, driven by the aforementioned factors, although potential external shocks and economic fluctuations could influence the actual growth trajectory. The historical period (2019-2024) likely reflects a period of mixed growth, influenced by global economic cycles and domestic policies.
Oil and Gas Industry in India: A Comprehensive Market Report (2019-2033)
This in-depth report provides a comprehensive analysis of the Indian oil and gas industry, encompassing market dynamics, growth trends, key players, and future prospects. The study covers the period 2019-2033, with a base year of 2025 and a forecast period of 2025-2033. The report leverages extensive data analysis to provide actionable insights for industry professionals, investors, and policymakers. Parent markets analyzed include energy and infrastructure, while child markets include Upstream, Midstream, and Downstream segments. Market values are presented in million units.
Oil and Gas Industry in India Market Dynamics & Structure
The Indian oil and gas market is characterized by a mix of state-owned giants and private players, creating a dynamic and competitive landscape. Market concentration is relatively high, with a few major players dominating the upstream and downstream sectors. Technological innovation is crucial, driven by the need for enhanced oil recovery, efficient exploration techniques, and cleaner energy solutions. Stringent regulatory frameworks govern exploration, production, and distribution, impacting investment decisions and market access. The industry faces competition from renewable energy sources, necessitating strategic adaptations. M&A activity is moderate, with occasional significant deals reshaping the competitive structure.
- Market Concentration: Top 5 players account for approximately xx% of the market share in 2025.
- Technological Innovation: Focus on digitalization, AI, and automation in exploration, production, and refining.
- Regulatory Framework: Complex licensing procedures and environmental regulations pose challenges.
- Competitive Substitutes: Growing adoption of renewable energy sources puts pressure on fossil fuels.
- End-User Demographics: Increasing urbanization and industrialization drive demand.
- M&A Trends: A moderate level of M&A activity, with xx deals recorded between 2019 and 2024.
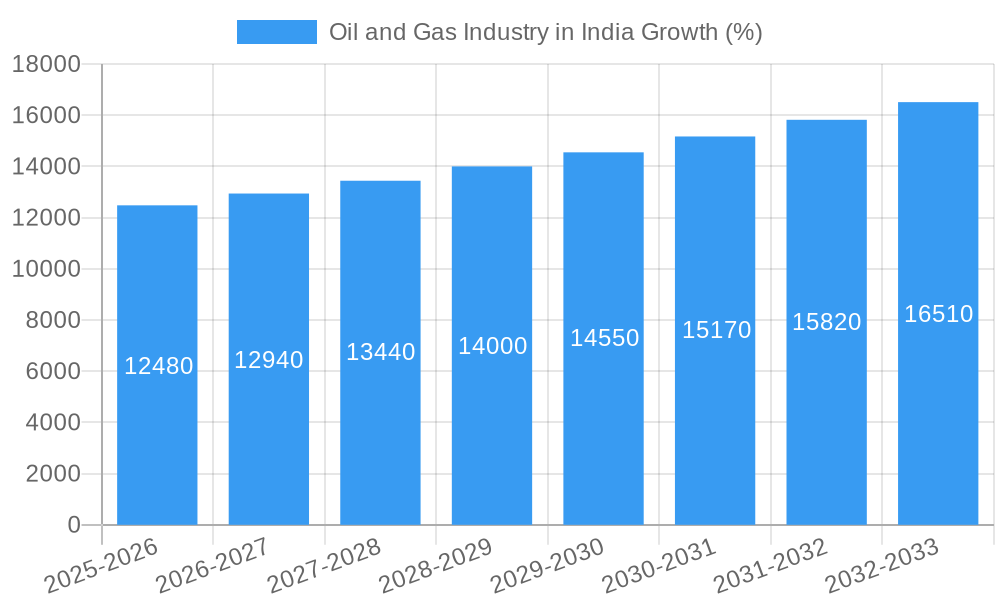
Oil and Gas Industry in India Growth Trends & Insights
The Indian oil and gas market exhibits robust growth driven by factors such as increasing energy demand, economic expansion, and government initiatives promoting infrastructure development. Market size experienced significant growth during the historical period (2019-2024), with a CAGR of xx%. Technological disruptions, such as the adoption of advanced exploration and production technologies, are boosting efficiency and reducing costs. Changing consumer behavior, reflected in a rising demand for cleaner fuels and gas-based energy solutions, is shaping the market. Adoption rates for new technologies vary across segments, with the downstream sector showing faster uptake. The projected CAGR for the forecast period (2025-2033) is xx%, indicating continued market expansion. Market penetration of cleaner fuels is projected to increase from xx% in 2025 to xx% by 2033.
Dominant Regions, Countries, or Segments in Oil and Gas Industry in India
The upstream segment, particularly onshore exploration and production, constitutes a significant portion of the Indian oil and gas market, driven by the presence of substantial hydrocarbon reserves. The western and eastern regions of India showcase substantial onshore oil and gas reserves leading to increased activity in these areas. The downstream segment, focusing on refining and marketing, is also a major contributor, propelled by growing demand for petroleum products. Petrochemical plants are increasingly significant, due to India's growing manufacturing sector.
- Key Drivers (Upstream): Large onshore and offshore reserves, government policies promoting exploration.
- Key Drivers (Downstream): Growing demand for petroleum products, expanding refining capacity.
- Key Drivers (Midstream): Investment in pipelines and transportation infrastructure.
- Key Drivers (Petrochemicals): Growth of the manufacturing and chemical industry.
- Market Share (Upstream): Onshore accounts for xx% of total production in 2025.
- Market Share (Downstream): Refineries with a capacity of xx million barrels per day.
Oil and Gas Industry in India Product Landscape
The Indian oil and gas industry offers a diverse range of products, including crude oil, natural gas, refined petroleum products (gasoline, diesel, LPG), and petrochemicals. Recent innovations focus on improving fuel efficiency, reducing emissions, and developing biofuels. Technological advancements in enhanced oil recovery techniques are optimizing production from mature fields. The unique selling propositions of various products center on quality, price competitiveness, and environmental compliance. The industry is embracing digital technologies to optimize operations and enhance efficiency.
Key Drivers, Barriers & Challenges in Oil and Gas Industry in India
Key Drivers: Increasing energy demand fueled by economic growth; government initiatives to boost domestic production and infrastructure development; technological advancements in exploration and production.
Challenges: Fluctuating global crude oil prices; regulatory complexities; environmental concerns regarding emissions; infrastructure limitations in some regions; competition from renewable energy sources; supply chain disruptions potentially affecting xx% of production in case of major issues.
Emerging Opportunities in Oil and Gas Industry in India
Opportunities exist in expanding gas-based power generation; development of renewable energy sources alongside fossil fuels; investments in petrochemical projects to meet growing industrial demand; and exploring new exploration and production technologies. Untapped potential exists in deepwater exploration and the development of shale gas resources. The evolving consumer preference for cleaner energy presents an opportunity for investment in cleaner fuels.
Growth Accelerators in the Oil and Gas Industry in India Industry
Technological breakthroughs in exploration and production, strategic partnerships between public and private sector players, and government initiatives aimed at infrastructure development are major growth catalysts. Market expansion into new geographical areas with untapped potential, coupled with investment in capacity expansion of refineries and petrochemical plants, further fuels growth. Emphasis on digitalization and the integration of AI and machine learning in operations contribute to cost optimization and higher efficiencies.
Key Players Shaping the Oil and Gas Industry in India Market
- Oil and Natural Gas Corporation
- Bharat Petroleum Corporation Limited
- Reliance Industries
- Hindustan Petroleum Corporation Limited
- GAIL (India) Limited
- Indian Oil Corporation Limited
- Oil India Limited
- Cairn India
- Punj Lloyd Limited
Notable Milestones in Oil and Gas Industry in India Sector
- March 2023: Indian Oil Corporation Ltd. announced a USD 742 million investment in a petrochemical complex at Paradip, Odisha.
- January 2022: Adani Total Gas Ltd. secured licenses to expand its CGD network to 14 new areas, investing USD 243 million.
In-Depth Oil and Gas Industry in India Market Outlook
The Indian oil and gas industry is poised for continued growth, driven by robust domestic demand and strategic investments. Opportunities abound in upstream exploration, downstream refining and marketing, and the burgeoning petrochemical sector. Technological advancements, coupled with supportive government policies, will shape the future landscape. Strategic partnerships and collaborations will play a pivotal role in unlocking the industry's full potential and meeting India's growing energy needs. The market is expected to continue its expansion, presenting lucrative opportunities for both domestic and international players.
Oil and Gas Industry in India Segmentation
-
1. Sector
-
1.1. Upstream
-
1.1.1. Location of Deployment
- 1.1.1.1. Onshore
- 1.1.1.2. Offshore
-
1.1.1. Location of Deployment
-
1.2. Downstream
- 1.2.1. Refineries
- 1.2.2. Petrochemical Plants
-
1.3. Midstream
- 1.3.1. Transportation
- 1.3.2. Storage
- 1.3.3. LNG Terminals
-
1.1. Upstream
Oil and Gas Industry in India Segmentation By Geography
-
1. North America
- 1.1. United States
- 1.2. Canada
- 1.3. Mexico
-
2. South America
- 2.1. Brazil
- 2.2. Argentina
- 2.3. Rest of South America
-
3. Europe
- 3.1. United Kingdom
- 3.2. Germany
- 3.3. France
- 3.4. Italy
- 3.5. Spain
- 3.6. Russia
- 3.7. Benelux
- 3.8. Nordics
- 3.9. Rest of Europe
-
4. Middle East & Africa
- 4.1. Turkey
- 4.2. Israel
- 4.3. GCC
- 4.4. North Africa
- 4.5. South Africa
- 4.6. Rest of Middle East & Africa
-
5. Asia Pacific
- 5.1. China
- 5.2. India
- 5.3. Japan
- 5.4. South Korea
- 5.5. ASEAN
- 5.6. Oceania
- 5.7. Rest of Asia Pacific
Oil and Gas Industry in India REPORT HIGHLIGHTS
| Aspects | Details |
|---|---|
| Study Period | 2019-2033 |
| Base Year | 2024 |
| Estimated Year | 2025 |
| Forecast Period | 2025-2033 |
| Historical Period | 2019-2024 |
| Growth Rate | CAGR of 5.20% from 2019-2033 |
| Segmentation |
|
Table of Contents
- 1. Introduction
- 1.1. Research Scope
- 1.2. Market Segmentation
- 1.3. Research Methodology
- 1.4. Definitions and Assumptions
- 2. Executive Summary
- 2.1. Introduction
- 3. Market Dynamics
- 3.1. Introduction
- 3.2. Market Drivers
- 3.2.1. 4.; Increasing Investment in the Upstream Sector4.; Supportive Government Policies
- 3.3. Market Restrains
- 3.3.1. 4.; Increasing Demand to Diversify the Power Generation Mix by Introducing Renewable Energy Sources
- 3.4. Market Trends
- 3.4.1. The Downstream Sector is Expected to Witness Significant Growth
- 4. Market Factor Analysis
- 4.1. Porters Five Forces
- 4.2. Supply/Value Chain
- 4.3. PESTEL analysis
- 4.4. Market Entropy
- 4.5. Patent/Trademark Analysis
- 5. Global Oil and Gas Industry in India Analysis, Insights and Forecast, 2019-2031
- 5.1. Market Analysis, Insights and Forecast - by Sector
- 5.1.1. Upstream
- 5.1.1.1. Location of Deployment
- 5.1.1.1.1. Onshore
- 5.1.1.1.2. Offshore
- 5.1.1.1. Location of Deployment
- 5.1.2. Downstream
- 5.1.2.1. Refineries
- 5.1.2.2. Petrochemical Plants
- 5.1.3. Midstream
- 5.1.3.1. Transportation
- 5.1.3.2. Storage
- 5.1.3.3. LNG Terminals
- 5.1.1. Upstream
- 5.2. Market Analysis, Insights and Forecast - by Region
- 5.2.1. North America
- 5.2.2. South America
- 5.2.3. Europe
- 5.2.4. Middle East & Africa
- 5.2.5. Asia Pacific
- 5.1. Market Analysis, Insights and Forecast - by Sector
- 6. North America Oil and Gas Industry in India Analysis, Insights and Forecast, 2019-2031
- 6.1. Market Analysis, Insights and Forecast - by Sector
- 6.1.1. Upstream
- 6.1.1.1. Location of Deployment
- 6.1.1.1.1. Onshore
- 6.1.1.1.2. Offshore
- 6.1.1.1. Location of Deployment
- 6.1.2. Downstream
- 6.1.2.1. Refineries
- 6.1.2.2. Petrochemical Plants
- 6.1.3. Midstream
- 6.1.3.1. Transportation
- 6.1.3.2. Storage
- 6.1.3.3. LNG Terminals
- 6.1.1. Upstream
- 6.1. Market Analysis, Insights and Forecast - by Sector
- 7. South America Oil and Gas Industry in India Analysis, Insights and Forecast, 2019-2031
- 7.1. Market Analysis, Insights and Forecast - by Sector
- 7.1.1. Upstream
- 7.1.1.1. Location of Deployment
- 7.1.1.1.1. Onshore
- 7.1.1.1.2. Offshore
- 7.1.1.1. Location of Deployment
- 7.1.2. Downstream
- 7.1.2.1. Refineries
- 7.1.2.2. Petrochemical Plants
- 7.1.3. Midstream
- 7.1.3.1. Transportation
- 7.1.3.2. Storage
- 7.1.3.3. LNG Terminals
- 7.1.1. Upstream
- 7.1. Market Analysis, Insights and Forecast - by Sector
- 8. Europe Oil and Gas Industry in India Analysis, Insights and Forecast, 2019-2031
- 8.1. Market Analysis, Insights and Forecast - by Sector
- 8.1.1. Upstream
- 8.1.1.1. Location of Deployment
- 8.1.1.1.1. Onshore
- 8.1.1.1.2. Offshore
- 8.1.1.1. Location of Deployment
- 8.1.2. Downstream
- 8.1.2.1. Refineries
- 8.1.2.2. Petrochemical Plants
- 8.1.3. Midstream
- 8.1.3.1. Transportation
- 8.1.3.2. Storage
- 8.1.3.3. LNG Terminals
- 8.1.1. Upstream
- 8.1. Market Analysis, Insights and Forecast - by Sector
- 9. Middle East & Africa Oil and Gas Industry in India Analysis, Insights and Forecast, 2019-2031
- 9.1. Market Analysis, Insights and Forecast - by Sector
- 9.1.1. Upstream
- 9.1.1.1. Location of Deployment
- 9.1.1.1.1. Onshore
- 9.1.1.1.2. Offshore
- 9.1.1.1. Location of Deployment
- 9.1.2. Downstream
- 9.1.2.1. Refineries
- 9.1.2.2. Petrochemical Plants
- 9.1.3. Midstream
- 9.1.3.1. Transportation
- 9.1.3.2. Storage
- 9.1.3.3. LNG Terminals
- 9.1.1. Upstream
- 9.1. Market Analysis, Insights and Forecast - by Sector
- 10. Asia Pacific Oil and Gas Industry in India Analysis, Insights and Forecast, 2019-2031
- 10.1. Market Analysis, Insights and Forecast - by Sector
- 10.1.1. Upstream
- 10.1.1.1. Location of Deployment
- 10.1.1.1.1. Onshore
- 10.1.1.1.2. Offshore
- 10.1.1.1. Location of Deployment
- 10.1.2. Downstream
- 10.1.2.1. Refineries
- 10.1.2.2. Petrochemical Plants
- 10.1.3. Midstream
- 10.1.3.1. Transportation
- 10.1.3.2. Storage
- 10.1.3.3. LNG Terminals
- 10.1.1. Upstream
- 10.1. Market Analysis, Insights and Forecast - by Sector
- 11. North India Oil and Gas Industry in India Analysis, Insights and Forecast, 2019-2031
- 12. South India Oil and Gas Industry in India Analysis, Insights and Forecast, 2019-2031
- 13. East India Oil and Gas Industry in India Analysis, Insights and Forecast, 2019-2031
- 14. West India Oil and Gas Industry in India Analysis, Insights and Forecast, 2019-2031
- 15. Competitive Analysis
- 15.1. Global Market Share Analysis 2024
- 15.2. Company Profiles
- 15.2.1 Oil and Natural Gas Corporation
- 15.2.1.1. Overview
- 15.2.1.2. Products
- 15.2.1.3. SWOT Analysis
- 15.2.1.4. Recent Developments
- 15.2.1.5. Financials (Based on Availability)
- 15.2.2 Bharat Petroleum Corporation Limited
- 15.2.2.1. Overview
- 15.2.2.2. Products
- 15.2.2.3. SWOT Analysis
- 15.2.2.4. Recent Developments
- 15.2.2.5. Financials (Based on Availability)
- 15.2.3 Reliance Industries
- 15.2.3.1. Overview
- 15.2.3.2. Products
- 15.2.3.3. SWOT Analysis
- 15.2.3.4. Recent Developments
- 15.2.3.5. Financials (Based on Availability)
- 15.2.4 Hindustan Petroleum Corporation Limited
- 15.2.4.1. Overview
- 15.2.4.2. Products
- 15.2.4.3. SWOT Analysis
- 15.2.4.4. Recent Developments
- 15.2.4.5. Financials (Based on Availability)
- 15.2.5 GAIL (India) Limited
- 15.2.5.1. Overview
- 15.2.5.2. Products
- 15.2.5.3. SWOT Analysis
- 15.2.5.4. Recent Developments
- 15.2.5.5. Financials (Based on Availability)
- 15.2.6 Indian Oil Corporation Limited
- 15.2.6.1. Overview
- 15.2.6.2. Products
- 15.2.6.3. SWOT Analysis
- 15.2.6.4. Recent Developments
- 15.2.6.5. Financials (Based on Availability)
- 15.2.7 Oil India Limited
- 15.2.7.1. Overview
- 15.2.7.2. Products
- 15.2.7.3. SWOT Analysis
- 15.2.7.4. Recent Developments
- 15.2.7.5. Financials (Based on Availability)
- 15.2.8 Cairn India
- 15.2.8.1. Overview
- 15.2.8.2. Products
- 15.2.8.3. SWOT Analysis
- 15.2.8.4. Recent Developments
- 15.2.8.5. Financials (Based on Availability)
- 15.2.9 Punj Lloyd Limited
- 15.2.9.1. Overview
- 15.2.9.2. Products
- 15.2.9.3. SWOT Analysis
- 15.2.9.4. Recent Developments
- 15.2.9.5. Financials (Based on Availability)
- 15.2.1 Oil and Natural Gas Corporation
List of Figures
- Figure 1: Global Oil and Gas Industry in India Revenue Breakdown (Million, %) by Region 2024 & 2032
- Figure 2: Global Oil and Gas Industry in India Volume Breakdown (Billion, %) by Region 2024 & 2032
- Figure 3: India Oil and Gas Industry in India Revenue (Million), by Country 2024 & 2032
- Figure 4: India Oil and Gas Industry in India Volume (Billion), by Country 2024 & 2032
- Figure 5: India Oil and Gas Industry in India Revenue Share (%), by Country 2024 & 2032
- Figure 6: India Oil and Gas Industry in India Volume Share (%), by Country 2024 & 2032
- Figure 7: North America Oil and Gas Industry in India Revenue (Million), by Sector 2024 & 2032
- Figure 8: North America Oil and Gas Industry in India Volume (Billion), by Sector 2024 & 2032
- Figure 9: North America Oil and Gas Industry in India Revenue Share (%), by Sector 2024 & 2032
- Figure 10: North America Oil and Gas Industry in India Volume Share (%), by Sector 2024 & 2032
- Figure 11: North America Oil and Gas Industry in India Revenue (Million), by Country 2024 & 2032
- Figure 12: North America Oil and Gas Industry in India Volume (Billion), by Country 2024 & 2032
- Figure 13: North America Oil and Gas Industry in India Revenue Share (%), by Country 2024 & 2032
- Figure 14: North America Oil and Gas Industry in India Volume Share (%), by Country 2024 & 2032
- Figure 15: South America Oil and Gas Industry in India Revenue (Million), by Sector 2024 & 2032
- Figure 16: South America Oil and Gas Industry in India Volume (Billion), by Sector 2024 & 2032
- Figure 17: South America Oil and Gas Industry in India Revenue Share (%), by Sector 2024 & 2032
- Figure 18: South America Oil and Gas Industry in India Volume Share (%), by Sector 2024 & 2032
- Figure 19: South America Oil and Gas Industry in India Revenue (Million), by Country 2024 & 2032
- Figure 20: South America Oil and Gas Industry in India Volume (Billion), by Country 2024 & 2032
- Figure 21: South America Oil and Gas Industry in India Revenue Share (%), by Country 2024 & 2032
- Figure 22: South America Oil and Gas Industry in India Volume Share (%), by Country 2024 & 2032
- Figure 23: Europe Oil and Gas Industry in India Revenue (Million), by Sector 2024 & 2032
- Figure 24: Europe Oil and Gas Industry in India Volume (Billion), by Sector 2024 & 2032
- Figure 25: Europe Oil and Gas Industry in India Revenue Share (%), by Sector 2024 & 2032
- Figure 26: Europe Oil and Gas Industry in India Volume Share (%), by Sector 2024 & 2032
- Figure 27: Europe Oil and Gas Industry in India Revenue (Million), by Country 2024 & 2032
- Figure 28: Europe Oil and Gas Industry in India Volume (Billion), by Country 2024 & 2032
- Figure 29: Europe Oil and Gas Industry in India Revenue Share (%), by Country 2024 & 2032
- Figure 30: Europe Oil and Gas Industry in India Volume Share (%), by Country 2024 & 2032
- Figure 31: Middle East & Africa Oil and Gas Industry in India Revenue (Million), by Sector 2024 & 2032
- Figure 32: Middle East & Africa Oil and Gas Industry in India Volume (Billion), by Sector 2024 & 2032
- Figure 33: Middle East & Africa Oil and Gas Industry in India Revenue Share (%), by Sector 2024 & 2032
- Figure 34: Middle East & Africa Oil and Gas Industry in India Volume Share (%), by Sector 2024 & 2032
- Figure 35: Middle East & Africa Oil and Gas Industry in India Revenue (Million), by Country 2024 & 2032
- Figure 36: Middle East & Africa Oil and Gas Industry in India Volume (Billion), by Country 2024 & 2032
- Figure 37: Middle East & Africa Oil and Gas Industry in India Revenue Share (%), by Country 2024 & 2032
- Figure 38: Middle East & Africa Oil and Gas Industry in India Volume Share (%), by Country 2024 & 2032
- Figure 39: Asia Pacific Oil and Gas Industry in India Revenue (Million), by Sector 2024 & 2032
- Figure 40: Asia Pacific Oil and Gas Industry in India Volume (Billion), by Sector 2024 & 2032
- Figure 41: Asia Pacific Oil and Gas Industry in India Revenue Share (%), by Sector 2024 & 2032
- Figure 42: Asia Pacific Oil and Gas Industry in India Volume Share (%), by Sector 2024 & 2032
- Figure 43: Asia Pacific Oil and Gas Industry in India Revenue (Million), by Country 2024 & 2032
- Figure 44: Asia Pacific Oil and Gas Industry in India Volume (Billion), by Country 2024 & 2032
- Figure 45: Asia Pacific Oil and Gas Industry in India Revenue Share (%), by Country 2024 & 2032
- Figure 46: Asia Pacific Oil and Gas Industry in India Volume Share (%), by Country 2024 & 2032
List of Tables
- Table 1: Global Oil and Gas Industry in India Revenue Million Forecast, by Region 2019 & 2032
- Table 2: Global Oil and Gas Industry in India Volume Billion Forecast, by Region 2019 & 2032
- Table 3: Global Oil and Gas Industry in India Revenue Million Forecast, by Sector 2019 & 2032
- Table 4: Global Oil and Gas Industry in India Volume Billion Forecast, by Sector 2019 & 2032
- Table 5: Global Oil and Gas Industry in India Revenue Million Forecast, by Region 2019 & 2032
- Table 6: Global Oil and Gas Industry in India Volume Billion Forecast, by Region 2019 & 2032
- Table 7: Global Oil and Gas Industry in India Revenue Million Forecast, by Country 2019 & 2032
- Table 8: Global Oil and Gas Industry in India Volume Billion Forecast, by Country 2019 & 2032
- Table 9: North India Oil and Gas Industry in India Revenue (Million) Forecast, by Application 2019 & 2032
- Table 10: North India Oil and Gas Industry in India Volume (Billion) Forecast, by Application 2019 & 2032
- Table 11: South India Oil and Gas Industry in India Revenue (Million) Forecast, by Application 2019 & 2032
- Table 12: South India Oil and Gas Industry in India Volume (Billion) Forecast, by Application 2019 & 2032
- Table 13: East India Oil and Gas Industry in India Revenue (Million) Forecast, by Application 2019 & 2032
- Table 14: East India Oil and Gas Industry in India Volume (Billion) Forecast, by Application 2019 & 2032
- Table 15: West India Oil and Gas Industry in India Revenue (Million) Forecast, by Application 2019 & 2032
- Table 16: West India Oil and Gas Industry in India Volume (Billion) Forecast, by Application 2019 & 2032
- Table 17: Global Oil and Gas Industry in India Revenue Million Forecast, by Sector 2019 & 2032
- Table 18: Global Oil and Gas Industry in India Volume Billion Forecast, by Sector 2019 & 2032
- Table 19: Global Oil and Gas Industry in India Revenue Million Forecast, by Country 2019 & 2032
- Table 20: Global Oil and Gas Industry in India Volume Billion Forecast, by Country 2019 & 2032
- Table 21: United States Oil and Gas Industry in India Revenue (Million) Forecast, by Application 2019 & 2032
- Table 22: United States Oil and Gas Industry in India Volume (Billion) Forecast, by Application 2019 & 2032
- Table 23: Canada Oil and Gas Industry in India Revenue (Million) Forecast, by Application 2019 & 2032
- Table 24: Canada Oil and Gas Industry in India Volume (Billion) Forecast, by Application 2019 & 2032
- Table 25: Mexico Oil and Gas Industry in India Revenue (Million) Forecast, by Application 2019 & 2032
- Table 26: Mexico Oil and Gas Industry in India Volume (Billion) Forecast, by Application 2019 & 2032
- Table 27: Global Oil and Gas Industry in India Revenue Million Forecast, by Sector 2019 & 2032
- Table 28: Global Oil and Gas Industry in India Volume Billion Forecast, by Sector 2019 & 2032
- Table 29: Global Oil and Gas Industry in India Revenue Million Forecast, by Country 2019 & 2032
- Table 30: Global Oil and Gas Industry in India Volume Billion Forecast, by Country 2019 & 2032
- Table 31: Brazil Oil and Gas Industry in India Revenue (Million) Forecast, by Application 2019 & 2032
- Table 32: Brazil Oil and Gas Industry in India Volume (Billion) Forecast, by Application 2019 & 2032
- Table 33: Argentina Oil and Gas Industry in India Revenue (Million) Forecast, by Application 2019 & 2032
- Table 34: Argentina Oil and Gas Industry in India Volume (Billion) Forecast, by Application 2019 & 2032
- Table 35: Rest of South America Oil and Gas Industry in India Revenue (Million) Forecast, by Application 2019 & 2032
- Table 36: Rest of South America Oil and Gas Industry in India Volume (Billion) Forecast, by Application 2019 & 2032
- Table 37: Global Oil and Gas Industry in India Revenue Million Forecast, by Sector 2019 & 2032
- Table 38: Global Oil and Gas Industry in India Volume Billion Forecast, by Sector 2019 & 2032
- Table 39: Global Oil and Gas Industry in India Revenue Million Forecast, by Country 2019 & 2032
- Table 40: Global Oil and Gas Industry in India Volume Billion Forecast, by Country 2019 & 2032
- Table 41: United Kingdom Oil and Gas Industry in India Revenue (Million) Forecast, by Application 2019 & 2032
- Table 42: United Kingdom Oil and Gas Industry in India Volume (Billion) Forecast, by Application 2019 & 2032
- Table 43: Germany Oil and Gas Industry in India Revenue (Million) Forecast, by Application 2019 & 2032
- Table 44: Germany Oil and Gas Industry in India Volume (Billion) Forecast, by Application 2019 & 2032
- Table 45: France Oil and Gas Industry in India Revenue (Million) Forecast, by Application 2019 & 2032
- Table 46: France Oil and Gas Industry in India Volume (Billion) Forecast, by Application 2019 & 2032
- Table 47: Italy Oil and Gas Industry in India Revenue (Million) Forecast, by Application 2019 & 2032
- Table 48: Italy Oil and Gas Industry in India Volume (Billion) Forecast, by Application 2019 & 2032
- Table 49: Spain Oil and Gas Industry in India Revenue (Million) Forecast, by Application 2019 & 2032
- Table 50: Spain Oil and Gas Industry in India Volume (Billion) Forecast, by Application 2019 & 2032
- Table 51: Russia Oil and Gas Industry in India Revenue (Million) Forecast, by Application 2019 & 2032
- Table 52: Russia Oil and Gas Industry in India Volume (Billion) Forecast, by Application 2019 & 2032
- Table 53: Benelux Oil and Gas Industry in India Revenue (Million) Forecast, by Application 2019 & 2032
- Table 54: Benelux Oil and Gas Industry in India Volume (Billion) Forecast, by Application 2019 & 2032
- Table 55: Nordics Oil and Gas Industry in India Revenue (Million) Forecast, by Application 2019 & 2032
- Table 56: Nordics Oil and Gas Industry in India Volume (Billion) Forecast, by Application 2019 & 2032
- Table 57: Rest of Europe Oil and Gas Industry in India Revenue (Million) Forecast, by Application 2019 & 2032
- Table 58: Rest of Europe Oil and Gas Industry in India Volume (Billion) Forecast, by Application 2019 & 2032
- Table 59: Global Oil and Gas Industry in India Revenue Million Forecast, by Sector 2019 & 2032
- Table 60: Global Oil and Gas Industry in India Volume Billion Forecast, by Sector 2019 & 2032
- Table 61: Global Oil and Gas Industry in India Revenue Million Forecast, by Country 2019 & 2032
- Table 62: Global Oil and Gas Industry in India Volume Billion Forecast, by Country 2019 & 2032
- Table 63: Turkey Oil and Gas Industry in India Revenue (Million) Forecast, by Application 2019 & 2032
- Table 64: Turkey Oil and Gas Industry in India Volume (Billion) Forecast, by Application 2019 & 2032
- Table 65: Israel Oil and Gas Industry in India Revenue (Million) Forecast, by Application 2019 & 2032
- Table 66: Israel Oil and Gas Industry in India Volume (Billion) Forecast, by Application 2019 & 2032
- Table 67: GCC Oil and Gas Industry in India Revenue (Million) Forecast, by Application 2019 & 2032
- Table 68: GCC Oil and Gas Industry in India Volume (Billion) Forecast, by Application 2019 & 2032
- Table 69: North Africa Oil and Gas Industry in India Revenue (Million) Forecast, by Application 2019 & 2032
- Table 70: North Africa Oil and Gas Industry in India Volume (Billion) Forecast, by Application 2019 & 2032
- Table 71: South Africa Oil and Gas Industry in India Revenue (Million) Forecast, by Application 2019 & 2032
- Table 72: South Africa Oil and Gas Industry in India Volume (Billion) Forecast, by Application 2019 & 2032
- Table 73: Rest of Middle East & Africa Oil and Gas Industry in India Revenue (Million) Forecast, by Application 2019 & 2032
- Table 74: Rest of Middle East & Africa Oil and Gas Industry in India Volume (Billion) Forecast, by Application 2019 & 2032
- Table 75: Global Oil and Gas Industry in India Revenue Million Forecast, by Sector 2019 & 2032
- Table 76: Global Oil and Gas Industry in India Volume Billion Forecast, by Sector 2019 & 2032
- Table 77: Global Oil and Gas Industry in India Revenue Million Forecast, by Country 2019 & 2032
- Table 78: Global Oil and Gas Industry in India Volume Billion Forecast, by Country 2019 & 2032
- Table 79: China Oil and Gas Industry in India Revenue (Million) Forecast, by Application 2019 & 2032
- Table 80: China Oil and Gas Industry in India Volume (Billion) Forecast, by Application 2019 & 2032
- Table 81: India Oil and Gas Industry in India Revenue (Million) Forecast, by Application 2019 & 2032
- Table 82: India Oil and Gas Industry in India Volume (Billion) Forecast, by Application 2019 & 2032
- Table 83: Japan Oil and Gas Industry in India Revenue (Million) Forecast, by Application 2019 & 2032
- Table 84: Japan Oil and Gas Industry in India Volume (Billion) Forecast, by Application 2019 & 2032
- Table 85: South Korea Oil and Gas Industry in India Revenue (Million) Forecast, by Application 2019 & 2032
- Table 86: South Korea Oil and Gas Industry in India Volume (Billion) Forecast, by Application 2019 & 2032
- Table 87: ASEAN Oil and Gas Industry in India Revenue (Million) Forecast, by Application 2019 & 2032
- Table 88: ASEAN Oil and Gas Industry in India Volume (Billion) Forecast, by Application 2019 & 2032
- Table 89: Oceania Oil and Gas Industry in India Revenue (Million) Forecast, by Application 2019 & 2032
- Table 90: Oceania Oil and Gas Industry in India Volume (Billion) Forecast, by Application 2019 & 2032
- Table 91: Rest of Asia Pacific Oil and Gas Industry in India Revenue (Million) Forecast, by Application 2019 & 2032
- Table 92: Rest of Asia Pacific Oil and Gas Industry in India Volume (Billion) Forecast, by Application 2019 & 2032
Frequently Asked Questions
1. What is the projected Compound Annual Growth Rate (CAGR) of the Oil and Gas Industry in India?
The projected CAGR is approximately 5.20%.
2. Which companies are prominent players in the Oil and Gas Industry in India?
Key companies in the market include Oil and Natural Gas Corporation, Bharat Petroleum Corporation Limited, Reliance Industries, Hindustan Petroleum Corporation Limited, GAIL (India) Limited, Indian Oil Corporation Limited, Oil India Limited, Cairn India, Punj Lloyd Limited.
3. What are the main segments of the Oil and Gas Industry in India?
The market segments include Sector.
4. Can you provide details about the market size?
The market size is estimated to be USD XX Million as of 2022.
5. What are some drivers contributing to market growth?
4.; Increasing Investment in the Upstream Sector4.; Supportive Government Policies.
6. What are the notable trends driving market growth?
The Downstream Sector is Expected to Witness Significant Growth.
7. Are there any restraints impacting market growth?
4.; Increasing Demand to Diversify the Power Generation Mix by Introducing Renewable Energy Sources.
8. Can you provide examples of recent developments in the market?
In March 2023, Indian Oil Corporation Ltd. announced that the company would invest USD 742 million in building a petrochemical complex at Paradip in the state of Odisha.
9. What pricing options are available for accessing the report?
Pricing options include single-user, multi-user, and enterprise licenses priced at USD 3800, USD 4500, and USD 5800 respectively.
10. Is the market size provided in terms of value or volume?
The market size is provided in terms of value, measured in Million and volume, measured in Billion.
11. Are there any specific market keywords associated with the report?
Yes, the market keyword associated with the report is "Oil and Gas Industry in India," which aids in identifying and referencing the specific market segment covered.
12. How do I determine which pricing option suits my needs best?
The pricing options vary based on user requirements and access needs. Individual users may opt for single-user licenses, while businesses requiring broader access may choose multi-user or enterprise licenses for cost-effective access to the report.
13. Are there any additional resources or data provided in the Oil and Gas Industry in India report?
While the report offers comprehensive insights, it's advisable to review the specific contents or supplementary materials provided to ascertain if additional resources or data are available.
14. How can I stay updated on further developments or reports in the Oil and Gas Industry in India?
To stay informed about further developments, trends, and reports in the Oil and Gas Industry in India, consider subscribing to industry newsletters, following relevant companies and organizations, or regularly checking reputable industry news sources and publications.
Methodology
Step 1 - Identification of Relevant Samples Size from Population Database


Step 2 - Approaches for Defining Global Market Size (Value, Volume* & Price*)

Note*: In applicable scenarios
Step 3 - Data Sources
Primary Research
- Web Analytics
- Survey Reports
- Research Institute
- Latest Research Reports
- Opinion Leaders
Secondary Research
- Annual Reports
- White Paper
- Latest Press Release
- Industry Association
- Paid Database
- Investor Presentations

Step 4 - Data Triangulation
Involves using different sources of information in order to increase the validity of a study
These sources are likely to be stakeholders in a program - participants, other researchers, program staff, other community members, and so on.
Then we put all data in single framework & apply various statistical tools to find out the dynamic on the market.
During the analysis stage, feedback from the stakeholder groups would be compared to determine areas of agreement as well as areas of divergence
