

Key Insights
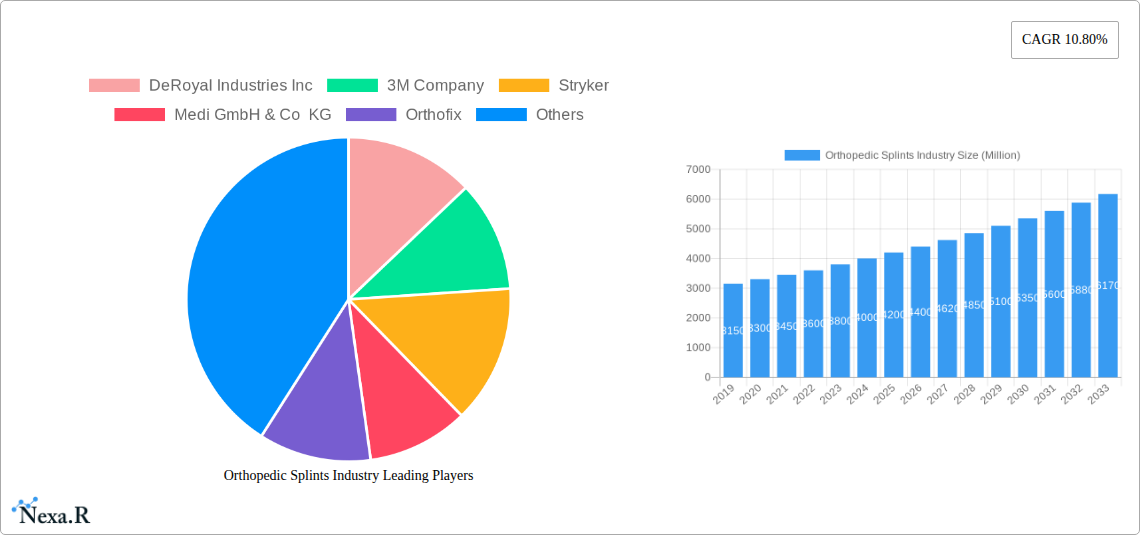
The global orthopedic splints market is poised for significant expansion, projected to reach an estimated USD 4,500 million by 2025 and maintain a robust Compound Annual Growth Rate (CAGR) of 10.80% through 2033. This growth trajectory is primarily fueled by an increasing prevalence of orthopedic conditions, including fractures, sprains, and dislocations, driven by an aging global population and a rise in sports-related injuries. Advancements in material science are leading to the development of lighter, more comfortable, and more effective splinting solutions, such as advanced fiberglass composites, further stimulating market demand. The growing adoption of minimally invasive surgical procedures also contributes to the demand for specialized splints that support post-operative recovery and mobility. Furthermore, expanding healthcare infrastructure, particularly in emerging economies, and increased patient awareness regarding the benefits of timely orthopedic intervention are also key contributors to market growth.
The market segmentation reveals diverse opportunities across product types, applications, and end-users. Fiberglass splints and plaster splints continue to hold substantial market share due to their established efficacy and cost-effectiveness. However, innovative splinting tools and accessories are gaining traction, offering enhanced patient comfort and ease of application for healthcare professionals. In terms of application, the lower extremity and upper extremity segments are dominant, reflecting the high incidence of injuries in these areas. The spinal segment is also witnessing steady growth due to an increase in spinal disorders. Hospitals remain the primary end-users, leveraging splints for immediate patient care and post-surgical management. Outpatient centers and home healthcare settings are emerging as significant growth areas, driven by the trend towards decentralized healthcare delivery and the need for convenient patient rehabilitation solutions. Leading players such as 3M Company, Stryker, and Medi GmbH & Co KG are actively investing in research and development to introduce innovative products and expand their market reach, anticipating a dynamic and competitive landscape.
Orthopedic Splints Industry Report: Global Market Analysis 2025-2033
This comprehensive report offers an in-depth analysis of the global orthopedic splints market, providing critical insights into market dynamics, growth trends, regional dominance, product landscape, and key player strategies. Covering the historical period of 2019-2024 and projecting growth through 2033, this report is an essential resource for manufacturers, distributors, healthcare providers, and investors seeking to understand and capitalize on opportunities within this vital healthcare segment. The report encompasses parent and child market perspectives, presenting all quantitative values in Million Units for clear and actionable understanding.
Orthopedic Splints Industry Market Dynamics & Structure
The orthopedic splints market is characterized by a moderate level of concentration, with established global players and a growing number of regional manufacturers vying for market share. Technological innovation serves as a primary driver, focusing on material advancements, enhanced patient comfort, and ease of application for healthcare professionals. Regulatory frameworks, particularly those governing medical device safety and efficacy, play a crucial role in shaping product development and market access. Competitive product substitutes, such as casting materials and advanced bracing solutions, present a constant challenge, pushing manufacturers to differentiate through superior performance and cost-effectiveness. End-user demographics, including an aging global population and the increasing prevalence of orthopedic conditions, are key demand drivers. Mergers and acquisitions (M&A) activity is observed, with larger companies seeking to expand their product portfolios and geographic reach.
- Market Concentration: Moderately concentrated with significant global players.
- Technological Innovation: Focus on lightweight, breathable, and customizable splint materials, along with digital integration for personalized fit.
- Regulatory Frameworks: Stringent approvals for medical devices, impacting market entry and product claims.
- Competitive Landscape: Competition from traditional casting, advanced bracing, and custom orthotics.
- End-User Demographics: Rising incidence of fractures, sports injuries, and degenerative bone conditions, coupled with an aging population.
- M&A Trends: Strategic acquisitions to gain market share and diversify product offerings.
Orthopedic Splints Industry Growth Trends & Insights
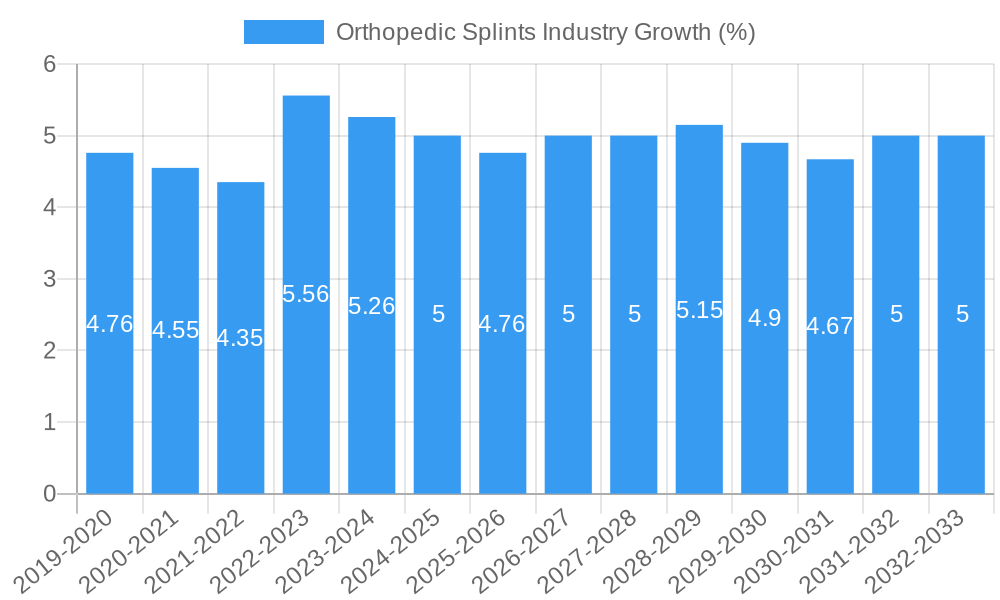
The global orthopedic splints market is poised for robust growth, driven by a confluence of factors including an increasing incidence of orthopedic injuries and fractures, a growing aging population with higher susceptibility to bone-related ailments, and advancements in material science leading to the development of lighter, more comfortable, and patient-friendly splinting solutions. The market size is projected to experience a healthy Compound Annual Growth Rate (CAGR) of approximately 5.5% from the base year 2025 through the forecast period ending 2033. This growth is further amplified by the rising adoption of orthopedic splints in ambulatory settings and home healthcare, reflecting a shift towards more decentralized patient care models. Technological disruptions are continuously reshaping the industry, with innovations such as 3D-printed splints and smart splints incorporating sensors to monitor healing progress gaining traction. Consumer behavior is also evolving, with patients increasingly seeking solutions that minimize discomfort, improve mobility during recovery, and offer aesthetic appeal. The pediatric segment, in particular, is witnessing a demand for colorful and easily removable splints. Furthermore, the expanding healthcare infrastructure in emerging economies is creating new avenues for market penetration and sustained growth. The global orthopedic splints market size is estimated at xx Million units in 2025, projected to reach xx Million units by 2033. The adoption rate of advanced splinting technologies is expected to surge, particularly in developed regions, as healthcare providers prioritize patient outcomes and recovery efficiency.
Dominant Regions, Countries, or Segments in Orthopedic Splints Industry
The Upper Extremity segment, encompassing splints for the arms, wrists, and hands, is a dominant force within the global orthopedic splints market. This dominance is attributed to the high prevalence of injuries related to sports, falls, and repetitive strain disorders affecting these areas. The estimated market share for the Upper Extremity segment is projected to be around 40% of the total market in 2025, valued at xx Million units. Key drivers contributing to this segment's leadership include the increasing participation in sports activities across all age groups, the rising incidence of carpal tunnel syndrome and other occupational hazards, and the effectiveness of splints in supporting post-operative recovery for conditions like fractures and tendon repairs.
- Product Segment Dominance: Fiberglass Splints are a significant contributor to the Upper Extremity segment's growth, offering superior strength-to-weight ratio, water resistance, and ease of application compared to traditional plaster splints. The market share of fiberglass splints is estimated at xx Million units in 2025.
- Application Dominance: The Upper Extremity application segment clearly leads due to the high volume of fractures and sprains in the arm, wrist, and hand.
- End-user Dominance: Hospitals are the primary end-users for orthopedic splints, accounting for an estimated xx% of the market in 2025, followed by outpatient centers. The need for immediate and effective fracture management in emergency departments and orthopedic wards drives this demand.
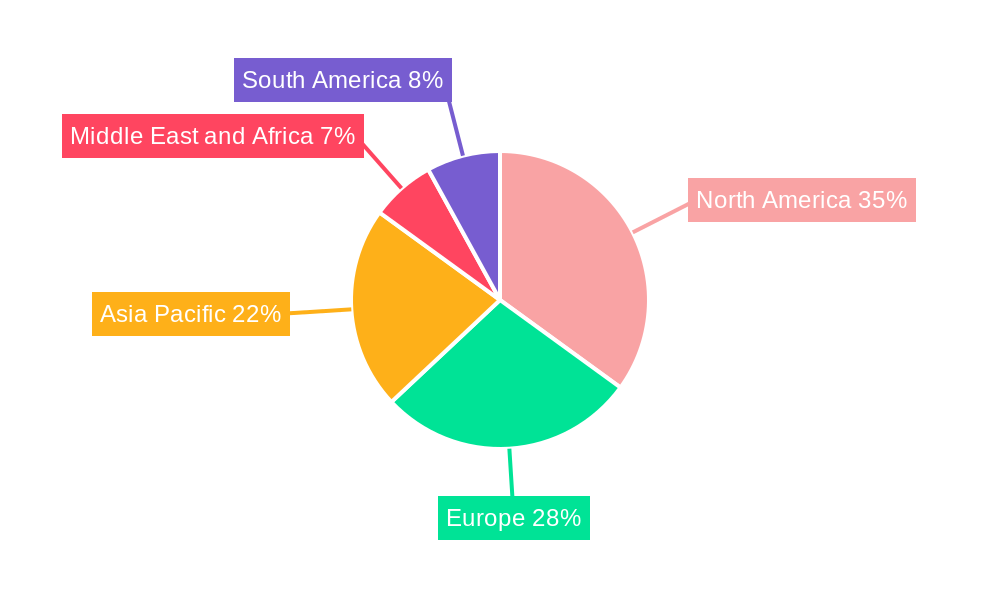
- Regional Dominance: North America and Europe are the leading regions, driven by well-established healthcare infrastructure, high disposable incomes, and a proactive approach to sports medicine and rehabilitation. The market share of North America is anticipated to be around xx% in 2025. Economic policies supporting healthcare access and reimbursement for orthopedic treatments further bolster these regions.
- Growth Potential: Emerging economies in Asia-Pacific are demonstrating significant growth potential due to increasing healthcare expenditure, rising awareness of orthopedic conditions, and improving access to advanced medical devices.
Orthopedic Splints Industry Product Landscape
The orthopedic splints industry is marked by continuous product innovation aimed at enhancing patient comfort, ease of application, and treatment efficacy. Fiberglass splints, known for their lightweight nature and water-resistant properties, continue to gain market share over traditional plaster splints. Splinting tools and accessories are evolving with ergonomic designs and integrated measurement systems for precise application. The market also features a growing array of "other products," including prefabricated splints for common injuries and custom-molded solutions tailored to individual patient needs. Technological advancements are driving the development of breathable materials, antimicrobial properties, and even smart splints capable of remote monitoring.
Key Drivers, Barriers & Challenges in Orthopedic Splints Industry
Key Drivers:
- Rising Incidence of Fractures and Orthopedic Injuries: An increasing global population, coupled with active lifestyles and sports participation, leads to a higher demand for effective splinting solutions.
- Aging Global Population: Elderly individuals are more prone to falls and osteoporosis, escalating the need for orthopedic interventions, including splints.
- Technological Advancements: Development of lightweight, breathable, and user-friendly splint materials enhances patient comfort and compliance.
- Growing Awareness of Sports Medicine and Rehabilitation: Increased emphasis on early and effective recovery from sports-related injuries drives the adoption of advanced splints.
Barriers & Challenges:
- Competition from Alternative Treatments: Casting, advanced bracing systems, and surgical interventions pose competitive threats.
- Cost Constraints and Reimbursement Policies: Healthcare cost pressures and varying reimbursement policies can impact market access and adoption rates, particularly in certain regions.
- Supply Chain Disruptions: Global events can disrupt the supply of raw materials and finished goods, impacting production and distribution.
- Regulatory Hurdles: Navigating diverse and evolving regulatory landscapes for medical devices across different countries presents a significant challenge.
Emerging Opportunities in Orthopedic Splints Industry
Emerging opportunities in the orthopedic splints industry lie in the development of advanced, patient-centric solutions. The growing demand for biodegradable and eco-friendly splinting materials presents a significant untapped market. Furthermore, the integration of smart technologies, such as embedded sensors for real-time monitoring of healing progress and patient adherence, offers substantial potential. The expansion of telemedicine and remote patient monitoring services creates opportunities for innovative splint designs that facilitate virtual consultations and follow-ups. Customized 3D-printed splints, tailored to individual anatomy and injury specifics, are also poised to gain traction, particularly for complex fractures or rare conditions.
Growth Accelerators in the Orthopedic Splints Industry Industry
Long-term growth in the orthopedic splints industry will be accelerated by continued investment in research and development for novel biomaterials and advanced manufacturing techniques. Strategic partnerships between splint manufacturers and orthopedic device companies, as well as collaborations with research institutions, will foster innovation and expedite product commercialization. Market expansion into underserved regions, driven by increasing healthcare expenditure and improved access to medical infrastructure, represents a significant growth catalyst. The development of integrated treatment pathways, where splints play a crucial role in multimodal rehabilitation, will further enhance their market penetration and value proposition.
Key Players Shaping the Orthopedic Splints Industry Market
- DeRoyal Industries Inc
- 3M Company
- Stryker
- Medi GmbH & Co KG
- Orthofix
- Plasti Surge Industries
- Essity (BSN Medical)
- Otto Bock Healthcare
- Dynatronics Corporation (Bird & Cronin)
- Patterson Medical Holdings Inc
- Zimmer Biomet
- Tynor
Notable Milestones in Orthopedic Splints Industry Sector
- January 2022: Dassiet launched UCAST, a product line targeted toward hospitals and health centers, making fracture treatment faster and safer both for the patient and nursing staff. UCAST splints are made of completely non-allergenic and non-toxic materials, and the medical staff does not need to protect themselves for casting.
- October 2021: Promoteq and Dassiet collaborated to bring an emergency splint widely available to professional customers and end users globally.
In-Depth Orthopedic Splints Industry Market Outlook
The orthopedic splints industry is set for sustained growth, driven by demographic shifts and continuous technological innovation. The market outlook is optimistic, with future potential amplified by the increasing adoption of advanced materials, smart splinting technologies, and personalized treatment approaches. Strategic opportunities lie in targeting emerging markets with tailored product offerings and expanding the utility of splints beyond simple immobilization to active participation in patient recovery pathways. The focus on patient comfort, reduced treatment time, and improved functional outcomes will continue to shape product development and market strategies, ensuring a robust and evolving future for the orthopedic splints sector.
Orthopedic Splints Industry Segmentation
-
1. Product
- 1.1. Fiberglass Splints
- 1.2. Plaster Splints
- 1.3. Splinting Tools And Accessories
- 1.4. Other Products
-
2. Application
- 2.1. Lower Extremity
- 2.2. Upper Extremity
- 2.3. Spinal
-
3. End-user
- 3.1. Hospitals
- 3.2. Outpatient Centers
- 3.3. Other End-users
Orthopedic Splints Industry Segmentation By Geography
-
1. North America
- 1.1. United States
- 1.2. Canada
- 1.3. Mexico
-
2. Europe
- 2.1. Germany
- 2.2. United Kingdom
- 2.3. France
- 2.4. Italy
- 2.5. Spain
- 2.6. Rest of Europe
-
3. Asia Pacific
- 3.1. China
- 3.2. Japan
- 3.3. India
- 3.4. Australia
- 3.5. South Korea
- 3.6. Rest of Asia Pacific
-
4. Middle East and Africa
- 4.1. GCC
- 4.2. South Africa
- 4.3. Rest of Middle East and Africa
-
5. South America
- 5.1. Brazil
- 5.2. Argentina
- 5.3. Rest of South America
Orthopedic Splints Industry REPORT HIGHLIGHTS
| Aspects | Details |
|---|---|
| Study Period | 2019-2033 |
| Base Year | 2024 |
| Estimated Year | 2025 |
| Forecast Period | 2025-2033 |
| Historical Period | 2019-2024 |
| Growth Rate | CAGR of 10.80% from 2019-2033 |
| Segmentation |
|
Table of Contents
- 1. Introduction
- 1.1. Research Scope
- 1.2. Market Segmentation
- 1.3. Research Methodology
- 1.4. Definitions and Assumptions
- 2. Executive Summary
- 2.1. Introduction
- 3. Market Dynamics
- 3.1. Introduction
- 3.2. Market Drivers
- 3.2.1. Increasing Number of Musculoskeletal Disorders; Increasing Bone Fracture Cases; Rise in Geriatric Population
- 3.3. Market Restrains
- 3.3.1. Negligence Toward Minor Injuries
- 3.4. Market Trends
- 3.4.1. Spinal Segment is Expected to Witness Growth Over the Forecast Period
- 4. Market Factor Analysis
- 4.1. Porters Five Forces
- 4.2. Supply/Value Chain
- 4.3. PESTEL analysis
- 4.4. Market Entropy
- 4.5. Patent/Trademark Analysis
- 5. Global Orthopedic Splints Industry Analysis, Insights and Forecast, 2019-2031
- 5.1. Market Analysis, Insights and Forecast - by Product
- 5.1.1. Fiberglass Splints
- 5.1.2. Plaster Splints
- 5.1.3. Splinting Tools And Accessories
- 5.1.4. Other Products
- 5.2. Market Analysis, Insights and Forecast - by Application
- 5.2.1. Lower Extremity
- 5.2.2. Upper Extremity
- 5.2.3. Spinal
- 5.3. Market Analysis, Insights and Forecast - by End-user
- 5.3.1. Hospitals
- 5.3.2. Outpatient Centers
- 5.3.3. Other End-users
- 5.4. Market Analysis, Insights and Forecast - by Region
- 5.4.1. North America
- 5.4.2. Europe
- 5.4.3. Asia Pacific
- 5.4.4. Middle East and Africa
- 5.4.5. South America
- 5.1. Market Analysis, Insights and Forecast - by Product
- 6. North America Orthopedic Splints Industry Analysis, Insights and Forecast, 2019-2031
- 6.1. Market Analysis, Insights and Forecast - by Product
- 6.1.1. Fiberglass Splints
- 6.1.2. Plaster Splints
- 6.1.3. Splinting Tools And Accessories
- 6.1.4. Other Products
- 6.2. Market Analysis, Insights and Forecast - by Application
- 6.2.1. Lower Extremity
- 6.2.2. Upper Extremity
- 6.2.3. Spinal
- 6.3. Market Analysis, Insights and Forecast - by End-user
- 6.3.1. Hospitals
- 6.3.2. Outpatient Centers
- 6.3.3. Other End-users
- 6.1. Market Analysis, Insights and Forecast - by Product
- 7. Europe Orthopedic Splints Industry Analysis, Insights and Forecast, 2019-2031
- 7.1. Market Analysis, Insights and Forecast - by Product
- 7.1.1. Fiberglass Splints
- 7.1.2. Plaster Splints
- 7.1.3. Splinting Tools And Accessories
- 7.1.4. Other Products
- 7.2. Market Analysis, Insights and Forecast - by Application
- 7.2.1. Lower Extremity
- 7.2.2. Upper Extremity
- 7.2.3. Spinal
- 7.3. Market Analysis, Insights and Forecast - by End-user
- 7.3.1. Hospitals
- 7.3.2. Outpatient Centers
- 7.3.3. Other End-users
- 7.1. Market Analysis, Insights and Forecast - by Product
- 8. Asia Pacific Orthopedic Splints Industry Analysis, Insights and Forecast, 2019-2031
- 8.1. Market Analysis, Insights and Forecast - by Product
- 8.1.1. Fiberglass Splints
- 8.1.2. Plaster Splints
- 8.1.3. Splinting Tools And Accessories
- 8.1.4. Other Products
- 8.2. Market Analysis, Insights and Forecast - by Application
- 8.2.1. Lower Extremity
- 8.2.2. Upper Extremity
- 8.2.3. Spinal
- 8.3. Market Analysis, Insights and Forecast - by End-user
- 8.3.1. Hospitals
- 8.3.2. Outpatient Centers
- 8.3.3. Other End-users
- 8.1. Market Analysis, Insights and Forecast - by Product
- 9. Middle East and Africa Orthopedic Splints Industry Analysis, Insights and Forecast, 2019-2031
- 9.1. Market Analysis, Insights and Forecast - by Product
- 9.1.1. Fiberglass Splints
- 9.1.2. Plaster Splints
- 9.1.3. Splinting Tools And Accessories
- 9.1.4. Other Products
- 9.2. Market Analysis, Insights and Forecast - by Application
- 9.2.1. Lower Extremity
- 9.2.2. Upper Extremity
- 9.2.3. Spinal
- 9.3. Market Analysis, Insights and Forecast - by End-user
- 9.3.1. Hospitals
- 9.3.2. Outpatient Centers
- 9.3.3. Other End-users
- 9.1. Market Analysis, Insights and Forecast - by Product
- 10. South America Orthopedic Splints Industry Analysis, Insights and Forecast, 2019-2031
- 10.1. Market Analysis, Insights and Forecast - by Product
- 10.1.1. Fiberglass Splints
- 10.1.2. Plaster Splints
- 10.1.3. Splinting Tools And Accessories
- 10.1.4. Other Products
- 10.2. Market Analysis, Insights and Forecast - by Application
- 10.2.1. Lower Extremity
- 10.2.2. Upper Extremity
- 10.2.3. Spinal
- 10.3. Market Analysis, Insights and Forecast - by End-user
- 10.3.1. Hospitals
- 10.3.2. Outpatient Centers
- 10.3.3. Other End-users
- 10.1. Market Analysis, Insights and Forecast - by Product
- 11. North America Orthopedic Splints Industry Analysis, Insights and Forecast, 2019-2031
- 11.1. Market Analysis, Insights and Forecast - By Country/Sub-region
- 11.1.1 United States
- 11.1.2 Canada
- 11.1.3 Mexico
- 12. Europe Orthopedic Splints Industry Analysis, Insights and Forecast, 2019-2031
- 12.1. Market Analysis, Insights and Forecast - By Country/Sub-region
- 12.1.1 Germany
- 12.1.2 United Kingdom
- 12.1.3 France
- 12.1.4 Italy
- 12.1.5 Spain
- 12.1.6 Rest of Europe
- 13. Asia Pacific Orthopedic Splints Industry Analysis, Insights and Forecast, 2019-2031
- 13.1. Market Analysis, Insights and Forecast - By Country/Sub-region
- 13.1.1 China
- 13.1.2 Japan
- 13.1.3 India
- 13.1.4 Australia
- 13.1.5 South Korea
- 13.1.6 Rest of Asia Pacific
- 14. Middle East and Africa Orthopedic Splints Industry Analysis, Insights and Forecast, 2019-2031
- 14.1. Market Analysis, Insights and Forecast - By Country/Sub-region
- 14.1.1 GCC
- 14.1.2 South Africa
- 14.1.3 Rest of Middle East and Africa
- 15. South America Orthopedic Splints Industry Analysis, Insights and Forecast, 2019-2031
- 15.1. Market Analysis, Insights and Forecast - By Country/Sub-region
- 15.1.1 Brazil
- 15.1.2 Argentina
- 15.1.3 Rest of South America
- 16. Competitive Analysis
- 16.1. Global Market Share Analysis 2024
- 16.2. Company Profiles
- 16.2.1 DeRoyal Industries Inc
- 16.2.1.1. Overview
- 16.2.1.2. Products
- 16.2.1.3. SWOT Analysis
- 16.2.1.4. Recent Developments
- 16.2.1.5. Financials (Based on Availability)
- 16.2.2 3M Company
- 16.2.2.1. Overview
- 16.2.2.2. Products
- 16.2.2.3. SWOT Analysis
- 16.2.2.4. Recent Developments
- 16.2.2.5. Financials (Based on Availability)
- 16.2.3 Stryker
- 16.2.3.1. Overview
- 16.2.3.2. Products
- 16.2.3.3. SWOT Analysis
- 16.2.3.4. Recent Developments
- 16.2.3.5. Financials (Based on Availability)
- 16.2.4 Medi GmbH & Co KG
- 16.2.4.1. Overview
- 16.2.4.2. Products
- 16.2.4.3. SWOT Analysis
- 16.2.4.4. Recent Developments
- 16.2.4.5. Financials (Based on Availability)
- 16.2.5 Orthofix
- 16.2.5.1. Overview
- 16.2.5.2. Products
- 16.2.5.3. SWOT Analysis
- 16.2.5.4. Recent Developments
- 16.2.5.5. Financials (Based on Availability)
- 16.2.6 Plasti Surge Industries
- 16.2.6.1. Overview
- 16.2.6.2. Products
- 16.2.6.3. SWOT Analysis
- 16.2.6.4. Recent Developments
- 16.2.6.5. Financials (Based on Availability)
- 16.2.7 Essity (BSN Medical)
- 16.2.7.1. Overview
- 16.2.7.2. Products
- 16.2.7.3. SWOT Analysis
- 16.2.7.4. Recent Developments
- 16.2.7.5. Financials (Based on Availability)
- 16.2.8 Otto Bock Healthcare
- 16.2.8.1. Overview
- 16.2.8.2. Products
- 16.2.8.3. SWOT Analysis
- 16.2.8.4. Recent Developments
- 16.2.8.5. Financials (Based on Availability)
- 16.2.9 Dynatronics Corporation (Bird & Cronin)
- 16.2.9.1. Overview
- 16.2.9.2. Products
- 16.2.9.3. SWOT Analysis
- 16.2.9.4. Recent Developments
- 16.2.9.5. Financials (Based on Availability)
- 16.2.10 Patterson Medical Holdings Inc
- 16.2.10.1. Overview
- 16.2.10.2. Products
- 16.2.10.3. SWOT Analysis
- 16.2.10.4. Recent Developments
- 16.2.10.5. Financials (Based on Availability)
- 16.2.11 Zimmer Biomet
- 16.2.11.1. Overview
- 16.2.11.2. Products
- 16.2.11.3. SWOT Analysis
- 16.2.11.4. Recent Developments
- 16.2.11.5. Financials (Based on Availability)
- 16.2.12 Tynor
- 16.2.12.1. Overview
- 16.2.12.2. Products
- 16.2.12.3. SWOT Analysis
- 16.2.12.4. Recent Developments
- 16.2.12.5. Financials (Based on Availability)
- 16.2.1 DeRoyal Industries Inc
List of Figures
- Figure 1: Global Orthopedic Splints Industry Revenue Breakdown (Million, %) by Region 2024 & 2032
- Figure 2: Global Orthopedic Splints Industry Volume Breakdown (K Unit, %) by Region 2024 & 2032
- Figure 3: North America Orthopedic Splints Industry Revenue (Million), by Country 2024 & 2032
- Figure 4: North America Orthopedic Splints Industry Volume (K Unit), by Country 2024 & 2032
- Figure 5: North America Orthopedic Splints Industry Revenue Share (%), by Country 2024 & 2032
- Figure 6: North America Orthopedic Splints Industry Volume Share (%), by Country 2024 & 2032
- Figure 7: Europe Orthopedic Splints Industry Revenue (Million), by Country 2024 & 2032
- Figure 8: Europe Orthopedic Splints Industry Volume (K Unit), by Country 2024 & 2032
- Figure 9: Europe Orthopedic Splints Industry Revenue Share (%), by Country 2024 & 2032
- Figure 10: Europe Orthopedic Splints Industry Volume Share (%), by Country 2024 & 2032
- Figure 11: Asia Pacific Orthopedic Splints Industry Revenue (Million), by Country 2024 & 2032
- Figure 12: Asia Pacific Orthopedic Splints Industry Volume (K Unit), by Country 2024 & 2032
- Figure 13: Asia Pacific Orthopedic Splints Industry Revenue Share (%), by Country 2024 & 2032
- Figure 14: Asia Pacific Orthopedic Splints Industry Volume Share (%), by Country 2024 & 2032
- Figure 15: Middle East and Africa Orthopedic Splints Industry Revenue (Million), by Country 2024 & 2032
- Figure 16: Middle East and Africa Orthopedic Splints Industry Volume (K Unit), by Country 2024 & 2032
- Figure 17: Middle East and Africa Orthopedic Splints Industry Revenue Share (%), by Country 2024 & 2032
- Figure 18: Middle East and Africa Orthopedic Splints Industry Volume Share (%), by Country 2024 & 2032
- Figure 19: South America Orthopedic Splints Industry Revenue (Million), by Country 2024 & 2032
- Figure 20: South America Orthopedic Splints Industry Volume (K Unit), by Country 2024 & 2032
- Figure 21: South America Orthopedic Splints Industry Revenue Share (%), by Country 2024 & 2032
- Figure 22: South America Orthopedic Splints Industry Volume Share (%), by Country 2024 & 2032
- Figure 23: North America Orthopedic Splints Industry Revenue (Million), by Product 2024 & 2032
- Figure 24: North America Orthopedic Splints Industry Volume (K Unit), by Product 2024 & 2032
- Figure 25: North America Orthopedic Splints Industry Revenue Share (%), by Product 2024 & 2032
- Figure 26: North America Orthopedic Splints Industry Volume Share (%), by Product 2024 & 2032
- Figure 27: North America Orthopedic Splints Industry Revenue (Million), by Application 2024 & 2032
- Figure 28: North America Orthopedic Splints Industry Volume (K Unit), by Application 2024 & 2032
- Figure 29: North America Orthopedic Splints Industry Revenue Share (%), by Application 2024 & 2032
- Figure 30: North America Orthopedic Splints Industry Volume Share (%), by Application 2024 & 2032
- Figure 31: North America Orthopedic Splints Industry Revenue (Million), by End-user 2024 & 2032
- Figure 32: North America Orthopedic Splints Industry Volume (K Unit), by End-user 2024 & 2032
- Figure 33: North America Orthopedic Splints Industry Revenue Share (%), by End-user 2024 & 2032
- Figure 34: North America Orthopedic Splints Industry Volume Share (%), by End-user 2024 & 2032
- Figure 35: North America Orthopedic Splints Industry Revenue (Million), by Country 2024 & 2032
- Figure 36: North America Orthopedic Splints Industry Volume (K Unit), by Country 2024 & 2032
- Figure 37: North America Orthopedic Splints Industry Revenue Share (%), by Country 2024 & 2032
- Figure 38: North America Orthopedic Splints Industry Volume Share (%), by Country 2024 & 2032
- Figure 39: Europe Orthopedic Splints Industry Revenue (Million), by Product 2024 & 2032
- Figure 40: Europe Orthopedic Splints Industry Volume (K Unit), by Product 2024 & 2032
- Figure 41: Europe Orthopedic Splints Industry Revenue Share (%), by Product 2024 & 2032
- Figure 42: Europe Orthopedic Splints Industry Volume Share (%), by Product 2024 & 2032
- Figure 43: Europe Orthopedic Splints Industry Revenue (Million), by Application 2024 & 2032
- Figure 44: Europe Orthopedic Splints Industry Volume (K Unit), by Application 2024 & 2032
- Figure 45: Europe Orthopedic Splints Industry Revenue Share (%), by Application 2024 & 2032
- Figure 46: Europe Orthopedic Splints Industry Volume Share (%), by Application 2024 & 2032
- Figure 47: Europe Orthopedic Splints Industry Revenue (Million), by End-user 2024 & 2032
- Figure 48: Europe Orthopedic Splints Industry Volume (K Unit), by End-user 2024 & 2032
- Figure 49: Europe Orthopedic Splints Industry Revenue Share (%), by End-user 2024 & 2032
- Figure 50: Europe Orthopedic Splints Industry Volume Share (%), by End-user 2024 & 2032
- Figure 51: Europe Orthopedic Splints Industry Revenue (Million), by Country 2024 & 2032
- Figure 52: Europe Orthopedic Splints Industry Volume (K Unit), by Country 2024 & 2032
- Figure 53: Europe Orthopedic Splints Industry Revenue Share (%), by Country 2024 & 2032
- Figure 54: Europe Orthopedic Splints Industry Volume Share (%), by Country 2024 & 2032
- Figure 55: Asia Pacific Orthopedic Splints Industry Revenue (Million), by Product 2024 & 2032
- Figure 56: Asia Pacific Orthopedic Splints Industry Volume (K Unit), by Product 2024 & 2032
- Figure 57: Asia Pacific Orthopedic Splints Industry Revenue Share (%), by Product 2024 & 2032
- Figure 58: Asia Pacific Orthopedic Splints Industry Volume Share (%), by Product 2024 & 2032
- Figure 59: Asia Pacific Orthopedic Splints Industry Revenue (Million), by Application 2024 & 2032
- Figure 60: Asia Pacific Orthopedic Splints Industry Volume (K Unit), by Application 2024 & 2032
- Figure 61: Asia Pacific Orthopedic Splints Industry Revenue Share (%), by Application 2024 & 2032
- Figure 62: Asia Pacific Orthopedic Splints Industry Volume Share (%), by Application 2024 & 2032
- Figure 63: Asia Pacific Orthopedic Splints Industry Revenue (Million), by End-user 2024 & 2032
- Figure 64: Asia Pacific Orthopedic Splints Industry Volume (K Unit), by End-user 2024 & 2032
- Figure 65: Asia Pacific Orthopedic Splints Industry Revenue Share (%), by End-user 2024 & 2032
- Figure 66: Asia Pacific Orthopedic Splints Industry Volume Share (%), by End-user 2024 & 2032
- Figure 67: Asia Pacific Orthopedic Splints Industry Revenue (Million), by Country 2024 & 2032
- Figure 68: Asia Pacific Orthopedic Splints Industry Volume (K Unit), by Country 2024 & 2032
- Figure 69: Asia Pacific Orthopedic Splints Industry Revenue Share (%), by Country 2024 & 2032
- Figure 70: Asia Pacific Orthopedic Splints Industry Volume Share (%), by Country 2024 & 2032
- Figure 71: Middle East and Africa Orthopedic Splints Industry Revenue (Million), by Product 2024 & 2032
- Figure 72: Middle East and Africa Orthopedic Splints Industry Volume (K Unit), by Product 2024 & 2032
- Figure 73: Middle East and Africa Orthopedic Splints Industry Revenue Share (%), by Product 2024 & 2032
- Figure 74: Middle East and Africa Orthopedic Splints Industry Volume Share (%), by Product 2024 & 2032
- Figure 75: Middle East and Africa Orthopedic Splints Industry Revenue (Million), by Application 2024 & 2032
- Figure 76: Middle East and Africa Orthopedic Splints Industry Volume (K Unit), by Application 2024 & 2032
- Figure 77: Middle East and Africa Orthopedic Splints Industry Revenue Share (%), by Application 2024 & 2032
- Figure 78: Middle East and Africa Orthopedic Splints Industry Volume Share (%), by Application 2024 & 2032
- Figure 79: Middle East and Africa Orthopedic Splints Industry Revenue (Million), by End-user 2024 & 2032
- Figure 80: Middle East and Africa Orthopedic Splints Industry Volume (K Unit), by End-user 2024 & 2032
- Figure 81: Middle East and Africa Orthopedic Splints Industry Revenue Share (%), by End-user 2024 & 2032
- Figure 82: Middle East and Africa Orthopedic Splints Industry Volume Share (%), by End-user 2024 & 2032
- Figure 83: Middle East and Africa Orthopedic Splints Industry Revenue (Million), by Country 2024 & 2032
- Figure 84: Middle East and Africa Orthopedic Splints Industry Volume (K Unit), by Country 2024 & 2032
- Figure 85: Middle East and Africa Orthopedic Splints Industry Revenue Share (%), by Country 2024 & 2032
- Figure 86: Middle East and Africa Orthopedic Splints Industry Volume Share (%), by Country 2024 & 2032
- Figure 87: South America Orthopedic Splints Industry Revenue (Million), by Product 2024 & 2032
- Figure 88: South America Orthopedic Splints Industry Volume (K Unit), by Product 2024 & 2032
- Figure 89: South America Orthopedic Splints Industry Revenue Share (%), by Product 2024 & 2032
- Figure 90: South America Orthopedic Splints Industry Volume Share (%), by Product 2024 & 2032
- Figure 91: South America Orthopedic Splints Industry Revenue (Million), by Application 2024 & 2032
- Figure 92: South America Orthopedic Splints Industry Volume (K Unit), by Application 2024 & 2032
- Figure 93: South America Orthopedic Splints Industry Revenue Share (%), by Application 2024 & 2032
- Figure 94: South America Orthopedic Splints Industry Volume Share (%), by Application 2024 & 2032
- Figure 95: South America Orthopedic Splints Industry Revenue (Million), by End-user 2024 & 2032
- Figure 96: South America Orthopedic Splints Industry Volume (K Unit), by End-user 2024 & 2032
- Figure 97: South America Orthopedic Splints Industry Revenue Share (%), by End-user 2024 & 2032
- Figure 98: South America Orthopedic Splints Industry Volume Share (%), by End-user 2024 & 2032
- Figure 99: South America Orthopedic Splints Industry Revenue (Million), by Country 2024 & 2032
- Figure 100: South America Orthopedic Splints Industry Volume (K Unit), by Country 2024 & 2032
- Figure 101: South America Orthopedic Splints Industry Revenue Share (%), by Country 2024 & 2032
- Figure 102: South America Orthopedic Splints Industry Volume Share (%), by Country 2024 & 2032
List of Tables
- Table 1: Global Orthopedic Splints Industry Revenue Million Forecast, by Region 2019 & 2032
- Table 2: Global Orthopedic Splints Industry Volume K Unit Forecast, by Region 2019 & 2032
- Table 3: Global Orthopedic Splints Industry Revenue Million Forecast, by Product 2019 & 2032
- Table 4: Global Orthopedic Splints Industry Volume K Unit Forecast, by Product 2019 & 2032
- Table 5: Global Orthopedic Splints Industry Revenue Million Forecast, by Application 2019 & 2032
- Table 6: Global Orthopedic Splints Industry Volume K Unit Forecast, by Application 2019 & 2032
- Table 7: Global Orthopedic Splints Industry Revenue Million Forecast, by End-user 2019 & 2032
- Table 8: Global Orthopedic Splints Industry Volume K Unit Forecast, by End-user 2019 & 2032
- Table 9: Global Orthopedic Splints Industry Revenue Million Forecast, by Region 2019 & 2032
- Table 10: Global Orthopedic Splints Industry Volume K Unit Forecast, by Region 2019 & 2032
- Table 11: Global Orthopedic Splints Industry Revenue Million Forecast, by Country 2019 & 2032
- Table 12: Global Orthopedic Splints Industry Volume K Unit Forecast, by Country 2019 & 2032
- Table 13: United States Orthopedic Splints Industry Revenue (Million) Forecast, by Application 2019 & 2032
- Table 14: United States Orthopedic Splints Industry Volume (K Unit) Forecast, by Application 2019 & 2032
- Table 15: Canada Orthopedic Splints Industry Revenue (Million) Forecast, by Application 2019 & 2032
- Table 16: Canada Orthopedic Splints Industry Volume (K Unit) Forecast, by Application 2019 & 2032
- Table 17: Mexico Orthopedic Splints Industry Revenue (Million) Forecast, by Application 2019 & 2032
- Table 18: Mexico Orthopedic Splints Industry Volume (K Unit) Forecast, by Application 2019 & 2032
- Table 19: Global Orthopedic Splints Industry Revenue Million Forecast, by Country 2019 & 2032
- Table 20: Global Orthopedic Splints Industry Volume K Unit Forecast, by Country 2019 & 2032
- Table 21: Germany Orthopedic Splints Industry Revenue (Million) Forecast, by Application 2019 & 2032
- Table 22: Germany Orthopedic Splints Industry Volume (K Unit) Forecast, by Application 2019 & 2032
- Table 23: United Kingdom Orthopedic Splints Industry Revenue (Million) Forecast, by Application 2019 & 2032
- Table 24: United Kingdom Orthopedic Splints Industry Volume (K Unit) Forecast, by Application 2019 & 2032
- Table 25: France Orthopedic Splints Industry Revenue (Million) Forecast, by Application 2019 & 2032
- Table 26: France Orthopedic Splints Industry Volume (K Unit) Forecast, by Application 2019 & 2032
- Table 27: Italy Orthopedic Splints Industry Revenue (Million) Forecast, by Application 2019 & 2032
- Table 28: Italy Orthopedic Splints Industry Volume (K Unit) Forecast, by Application 2019 & 2032
- Table 29: Spain Orthopedic Splints Industry Revenue (Million) Forecast, by Application 2019 & 2032
- Table 30: Spain Orthopedic Splints Industry Volume (K Unit) Forecast, by Application 2019 & 2032
- Table 31: Rest of Europe Orthopedic Splints Industry Revenue (Million) Forecast, by Application 2019 & 2032
- Table 32: Rest of Europe Orthopedic Splints Industry Volume (K Unit) Forecast, by Application 2019 & 2032
- Table 33: Global Orthopedic Splints Industry Revenue Million Forecast, by Country 2019 & 2032
- Table 34: Global Orthopedic Splints Industry Volume K Unit Forecast, by Country 2019 & 2032
- Table 35: China Orthopedic Splints Industry Revenue (Million) Forecast, by Application 2019 & 2032
- Table 36: China Orthopedic Splints Industry Volume (K Unit) Forecast, by Application 2019 & 2032
- Table 37: Japan Orthopedic Splints Industry Revenue (Million) Forecast, by Application 2019 & 2032
- Table 38: Japan Orthopedic Splints Industry Volume (K Unit) Forecast, by Application 2019 & 2032
- Table 39: India Orthopedic Splints Industry Revenue (Million) Forecast, by Application 2019 & 2032
- Table 40: India Orthopedic Splints Industry Volume (K Unit) Forecast, by Application 2019 & 2032
- Table 41: Australia Orthopedic Splints Industry Revenue (Million) Forecast, by Application 2019 & 2032
- Table 42: Australia Orthopedic Splints Industry Volume (K Unit) Forecast, by Application 2019 & 2032
- Table 43: South Korea Orthopedic Splints Industry Revenue (Million) Forecast, by Application 2019 & 2032
- Table 44: South Korea Orthopedic Splints Industry Volume (K Unit) Forecast, by Application 2019 & 2032
- Table 45: Rest of Asia Pacific Orthopedic Splints Industry Revenue (Million) Forecast, by Application 2019 & 2032
- Table 46: Rest of Asia Pacific Orthopedic Splints Industry Volume (K Unit) Forecast, by Application 2019 & 2032
- Table 47: Global Orthopedic Splints Industry Revenue Million Forecast, by Country 2019 & 2032
- Table 48: Global Orthopedic Splints Industry Volume K Unit Forecast, by Country 2019 & 2032
- Table 49: GCC Orthopedic Splints Industry Revenue (Million) Forecast, by Application 2019 & 2032
- Table 50: GCC Orthopedic Splints Industry Volume (K Unit) Forecast, by Application 2019 & 2032
- Table 51: South Africa Orthopedic Splints Industry Revenue (Million) Forecast, by Application 2019 & 2032
- Table 52: South Africa Orthopedic Splints Industry Volume (K Unit) Forecast, by Application 2019 & 2032
- Table 53: Rest of Middle East and Africa Orthopedic Splints Industry Revenue (Million) Forecast, by Application 2019 & 2032
- Table 54: Rest of Middle East and Africa Orthopedic Splints Industry Volume (K Unit) Forecast, by Application 2019 & 2032
- Table 55: Global Orthopedic Splints Industry Revenue Million Forecast, by Country 2019 & 2032
- Table 56: Global Orthopedic Splints Industry Volume K Unit Forecast, by Country 2019 & 2032
- Table 57: Brazil Orthopedic Splints Industry Revenue (Million) Forecast, by Application 2019 & 2032
- Table 58: Brazil Orthopedic Splints Industry Volume (K Unit) Forecast, by Application 2019 & 2032
- Table 59: Argentina Orthopedic Splints Industry Revenue (Million) Forecast, by Application 2019 & 2032
- Table 60: Argentina Orthopedic Splints Industry Volume (K Unit) Forecast, by Application 2019 & 2032
- Table 61: Rest of South America Orthopedic Splints Industry Revenue (Million) Forecast, by Application 2019 & 2032
- Table 62: Rest of South America Orthopedic Splints Industry Volume (K Unit) Forecast, by Application 2019 & 2032
- Table 63: Global Orthopedic Splints Industry Revenue Million Forecast, by Product 2019 & 2032
- Table 64: Global Orthopedic Splints Industry Volume K Unit Forecast, by Product 2019 & 2032
- Table 65: Global Orthopedic Splints Industry Revenue Million Forecast, by Application 2019 & 2032
- Table 66: Global Orthopedic Splints Industry Volume K Unit Forecast, by Application 2019 & 2032
- Table 67: Global Orthopedic Splints Industry Revenue Million Forecast, by End-user 2019 & 2032
- Table 68: Global Orthopedic Splints Industry Volume K Unit Forecast, by End-user 2019 & 2032
- Table 69: Global Orthopedic Splints Industry Revenue Million Forecast, by Country 2019 & 2032
- Table 70: Global Orthopedic Splints Industry Volume K Unit Forecast, by Country 2019 & 2032
- Table 71: United States Orthopedic Splints Industry Revenue (Million) Forecast, by Application 2019 & 2032
- Table 72: United States Orthopedic Splints Industry Volume (K Unit) Forecast, by Application 2019 & 2032
- Table 73: Canada Orthopedic Splints Industry Revenue (Million) Forecast, by Application 2019 & 2032
- Table 74: Canada Orthopedic Splints Industry Volume (K Unit) Forecast, by Application 2019 & 2032
- Table 75: Mexico Orthopedic Splints Industry Revenue (Million) Forecast, by Application 2019 & 2032
- Table 76: Mexico Orthopedic Splints Industry Volume (K Unit) Forecast, by Application 2019 & 2032
- Table 77: Global Orthopedic Splints Industry Revenue Million Forecast, by Product 2019 & 2032
- Table 78: Global Orthopedic Splints Industry Volume K Unit Forecast, by Product 2019 & 2032
- Table 79: Global Orthopedic Splints Industry Revenue Million Forecast, by Application 2019 & 2032
- Table 80: Global Orthopedic Splints Industry Volume K Unit Forecast, by Application 2019 & 2032
- Table 81: Global Orthopedic Splints Industry Revenue Million Forecast, by End-user 2019 & 2032
- Table 82: Global Orthopedic Splints Industry Volume K Unit Forecast, by End-user 2019 & 2032
- Table 83: Global Orthopedic Splints Industry Revenue Million Forecast, by Country 2019 & 2032
- Table 84: Global Orthopedic Splints Industry Volume K Unit Forecast, by Country 2019 & 2032
- Table 85: Germany Orthopedic Splints Industry Revenue (Million) Forecast, by Application 2019 & 2032
- Table 86: Germany Orthopedic Splints Industry Volume (K Unit) Forecast, by Application 2019 & 2032
- Table 87: United Kingdom Orthopedic Splints Industry Revenue (Million) Forecast, by Application 2019 & 2032
- Table 88: United Kingdom Orthopedic Splints Industry Volume (K Unit) Forecast, by Application 2019 & 2032
- Table 89: France Orthopedic Splints Industry Revenue (Million) Forecast, by Application 2019 & 2032
- Table 90: France Orthopedic Splints Industry Volume (K Unit) Forecast, by Application 2019 & 2032
- Table 91: Italy Orthopedic Splints Industry Revenue (Million) Forecast, by Application 2019 & 2032
- Table 92: Italy Orthopedic Splints Industry Volume (K Unit) Forecast, by Application 2019 & 2032
- Table 93: Spain Orthopedic Splints Industry Revenue (Million) Forecast, by Application 2019 & 2032
- Table 94: Spain Orthopedic Splints Industry Volume (K Unit) Forecast, by Application 2019 & 2032
- Table 95: Rest of Europe Orthopedic Splints Industry Revenue (Million) Forecast, by Application 2019 & 2032
- Table 96: Rest of Europe Orthopedic Splints Industry Volume (K Unit) Forecast, by Application 2019 & 2032
- Table 97: Global Orthopedic Splints Industry Revenue Million Forecast, by Product 2019 & 2032
- Table 98: Global Orthopedic Splints Industry Volume K Unit Forecast, by Product 2019 & 2032
- Table 99: Global Orthopedic Splints Industry Revenue Million Forecast, by Application 2019 & 2032
- Table 100: Global Orthopedic Splints Industry Volume K Unit Forecast, by Application 2019 & 2032
- Table 101: Global Orthopedic Splints Industry Revenue Million Forecast, by End-user 2019 & 2032
- Table 102: Global Orthopedic Splints Industry Volume K Unit Forecast, by End-user 2019 & 2032
- Table 103: Global Orthopedic Splints Industry Revenue Million Forecast, by Country 2019 & 2032
- Table 104: Global Orthopedic Splints Industry Volume K Unit Forecast, by Country 2019 & 2032
- Table 105: China Orthopedic Splints Industry Revenue (Million) Forecast, by Application 2019 & 2032
- Table 106: China Orthopedic Splints Industry Volume (K Unit) Forecast, by Application 2019 & 2032
- Table 107: Japan Orthopedic Splints Industry Revenue (Million) Forecast, by Application 2019 & 2032
- Table 108: Japan Orthopedic Splints Industry Volume (K Unit) Forecast, by Application 2019 & 2032
- Table 109: India Orthopedic Splints Industry Revenue (Million) Forecast, by Application 2019 & 2032
- Table 110: India Orthopedic Splints Industry Volume (K Unit) Forecast, by Application 2019 & 2032
- Table 111: Australia Orthopedic Splints Industry Revenue (Million) Forecast, by Application 2019 & 2032
- Table 112: Australia Orthopedic Splints Industry Volume (K Unit) Forecast, by Application 2019 & 2032
- Table 113: South Korea Orthopedic Splints Industry Revenue (Million) Forecast, by Application 2019 & 2032
- Table 114: South Korea Orthopedic Splints Industry Volume (K Unit) Forecast, by Application 2019 & 2032
- Table 115: Rest of Asia Pacific Orthopedic Splints Industry Revenue (Million) Forecast, by Application 2019 & 2032
- Table 116: Rest of Asia Pacific Orthopedic Splints Industry Volume (K Unit) Forecast, by Application 2019 & 2032
- Table 117: Global Orthopedic Splints Industry Revenue Million Forecast, by Product 2019 & 2032
- Table 118: Global Orthopedic Splints Industry Volume K Unit Forecast, by Product 2019 & 2032
- Table 119: Global Orthopedic Splints Industry Revenue Million Forecast, by Application 2019 & 2032
- Table 120: Global Orthopedic Splints Industry Volume K Unit Forecast, by Application 2019 & 2032
- Table 121: Global Orthopedic Splints Industry Revenue Million Forecast, by End-user 2019 & 2032
- Table 122: Global Orthopedic Splints Industry Volume K Unit Forecast, by End-user 2019 & 2032
- Table 123: Global Orthopedic Splints Industry Revenue Million Forecast, by Country 2019 & 2032
- Table 124: Global Orthopedic Splints Industry Volume K Unit Forecast, by Country 2019 & 2032
- Table 125: GCC Orthopedic Splints Industry Revenue (Million) Forecast, by Application 2019 & 2032
- Table 126: GCC Orthopedic Splints Industry Volume (K Unit) Forecast, by Application 2019 & 2032
- Table 127: South Africa Orthopedic Splints Industry Revenue (Million) Forecast, by Application 2019 & 2032
- Table 128: South Africa Orthopedic Splints Industry Volume (K Unit) Forecast, by Application 2019 & 2032
- Table 129: Rest of Middle East and Africa Orthopedic Splints Industry Revenue (Million) Forecast, by Application 2019 & 2032
- Table 130: Rest of Middle East and Africa Orthopedic Splints Industry Volume (K Unit) Forecast, by Application 2019 & 2032
- Table 131: Global Orthopedic Splints Industry Revenue Million Forecast, by Product 2019 & 2032
- Table 132: Global Orthopedic Splints Industry Volume K Unit Forecast, by Product 2019 & 2032
- Table 133: Global Orthopedic Splints Industry Revenue Million Forecast, by Application 2019 & 2032
- Table 134: Global Orthopedic Splints Industry Volume K Unit Forecast, by Application 2019 & 2032
- Table 135: Global Orthopedic Splints Industry Revenue Million Forecast, by End-user 2019 & 2032
- Table 136: Global Orthopedic Splints Industry Volume K Unit Forecast, by End-user 2019 & 2032
- Table 137: Global Orthopedic Splints Industry Revenue Million Forecast, by Country 2019 & 2032
- Table 138: Global Orthopedic Splints Industry Volume K Unit Forecast, by Country 2019 & 2032
- Table 139: Brazil Orthopedic Splints Industry Revenue (Million) Forecast, by Application 2019 & 2032
- Table 140: Brazil Orthopedic Splints Industry Volume (K Unit) Forecast, by Application 2019 & 2032
- Table 141: Argentina Orthopedic Splints Industry Revenue (Million) Forecast, by Application 2019 & 2032
- Table 142: Argentina Orthopedic Splints Industry Volume (K Unit) Forecast, by Application 2019 & 2032
- Table 143: Rest of South America Orthopedic Splints Industry Revenue (Million) Forecast, by Application 2019 & 2032
- Table 144: Rest of South America Orthopedic Splints Industry Volume (K Unit) Forecast, by Application 2019 & 2032
Frequently Asked Questions
1. What is the projected Compound Annual Growth Rate (CAGR) of the Orthopedic Splints Industry?
The projected CAGR is approximately 10.80%.
2. Which companies are prominent players in the Orthopedic Splints Industry?
Key companies in the market include DeRoyal Industries Inc, 3M Company, Stryker, Medi GmbH & Co KG, Orthofix, Plasti Surge Industries, Essity (BSN Medical), Otto Bock Healthcare, Dynatronics Corporation (Bird & Cronin), Patterson Medical Holdings Inc, Zimmer Biomet, Tynor.
3. What are the main segments of the Orthopedic Splints Industry?
The market segments include Product, Application, End-user.
4. Can you provide details about the market size?
The market size is estimated to be USD XX Million as of 2022.
5. What are some drivers contributing to market growth?
Increasing Number of Musculoskeletal Disorders; Increasing Bone Fracture Cases; Rise in Geriatric Population.
6. What are the notable trends driving market growth?
Spinal Segment is Expected to Witness Growth Over the Forecast Period.
7. Are there any restraints impacting market growth?
Negligence Toward Minor Injuries.
8. Can you provide examples of recent developments in the market?
In January 2022, Dassiet launched UCAST, a product line targeted toward hospitals and health centers, making fracture treatment faster and safer both for the patient and nursing staff. UCAST splints are made of completely non-allergenic and non-toxic materials, and the medical staff does not need to protect themselves for casting.
9. What pricing options are available for accessing the report?
Pricing options include single-user, multi-user, and enterprise licenses priced at USD 4750, USD 5250, and USD 8750 respectively.
10. Is the market size provided in terms of value or volume?
The market size is provided in terms of value, measured in Million and volume, measured in K Unit.
11. Are there any specific market keywords associated with the report?
Yes, the market keyword associated with the report is "Orthopedic Splints Industry," which aids in identifying and referencing the specific market segment covered.
12. How do I determine which pricing option suits my needs best?
The pricing options vary based on user requirements and access needs. Individual users may opt for single-user licenses, while businesses requiring broader access may choose multi-user or enterprise licenses for cost-effective access to the report.
13. Are there any additional resources or data provided in the Orthopedic Splints Industry report?
While the report offers comprehensive insights, it's advisable to review the specific contents or supplementary materials provided to ascertain if additional resources or data are available.
14. How can I stay updated on further developments or reports in the Orthopedic Splints Industry?
To stay informed about further developments, trends, and reports in the Orthopedic Splints Industry, consider subscribing to industry newsletters, following relevant companies and organizations, or regularly checking reputable industry news sources and publications.
Methodology
Step 1 - Identification of Relevant Samples Size from Population Database


Step 2 - Approaches for Defining Global Market Size (Value, Volume* & Price*)

Note*: In applicable scenarios
Step 3 - Data Sources
Primary Research
- Web Analytics
- Survey Reports
- Research Institute
- Latest Research Reports
- Opinion Leaders
Secondary Research
- Annual Reports
- White Paper
- Latest Press Release
- Industry Association
- Paid Database
- Investor Presentations

Step 4 - Data Triangulation
Involves using different sources of information in order to increase the validity of a study
These sources are likely to be stakeholders in a program - participants, other researchers, program staff, other community members, and so on.
Then we put all data in single framework & apply various statistical tools to find out the dynamic on the market.
During the analysis stage, feedback from the stakeholder groups would be compared to determine areas of agreement as well as areas of divergence
