

Key Insights
The global phenolic antioxidant market is poised for significant expansion, projecting a Compound Annual Growth Rate (CAGR) of 6.9%. Valued at 32.44 billion in the base year 2025, this dynamic sector is propelled by escalating demand across vital industries including packaging, construction, and automotive. The increasing integration of polymers like polypropylene and polyethylene in a wide array of applications directly fuels the need for high-performance antioxidants. Phenolic antioxidants are indispensable in enhancing the longevity and operational efficiency of these polymeric materials. Moreover, rigorous regulatory mandates concerning product safety and growing environmental consciousness are steering manufacturers towards adopting advanced, sustainable, and effective antioxidant solutions, thereby accelerating market growth. Geographically, Asia Pacific, with China and India at the forefront, presents substantial growth prospects owing to their expanding manufacturing capabilities and rapid infrastructure development.
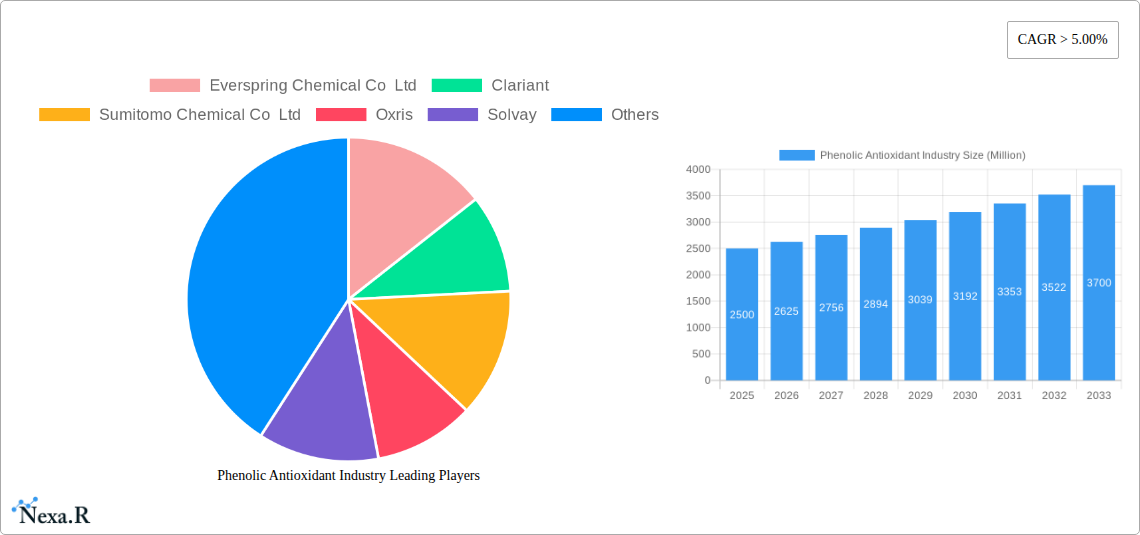
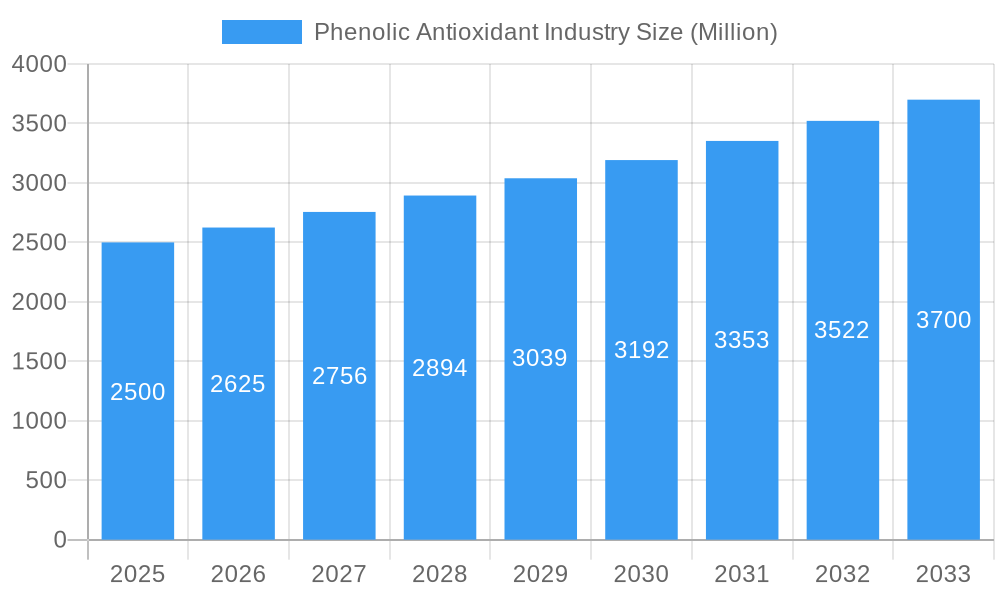
Phenolic Antioxidant Industry Market Size (In Billion)
The competitive arena features a blend of established global enterprises and regional specialists. Leading entities such as Clariant, BASF SE, and Sumitomo Chemical Co Ltd are substantially investing in research and development to refine product efficacy and broaden their offerings. Smaller firms are strategically targeting niche markets and optimizing cost-efficiency in production to maintain a competitive edge. The market is segmented by antioxidant type (phenolic, phosphite, phosphonite, and blends), application (packaging, construction, automotive, and others), and polymer resin (polypropylene, polyethylene, polyvinyl chloride, polystyrene, and acrylonitrile butadiene styrene). Future market trajectory will be shaped by innovations in polymer technology, the embrace of sustainable manufacturing processes, and evolving consumer preferences for eco-friendly products. A thorough understanding of these key drivers is paramount for stakeholders aiming to leverage opportunities within this evolving market landscape.
Phenolic Antioxidant Industry Company Market Share
Phenolic Antioxidant Industry Market Report: 2019-2033
This comprehensive report provides a detailed analysis of the Phenolic Antioxidant Industry, encompassing market dynamics, growth trends, regional segmentation, product landscape, key players, and future outlook. The study period covers 2019-2033, with 2025 as the base and estimated year. This report is an invaluable resource for industry professionals, investors, and anyone seeking a thorough understanding of this dynamic market. The report uses Million units for all value representations.
Keywords: Phenolic Antioxidants, Phosphite Antioxidants, Phosphonite Antioxidants, Antioxidant Blends, Polypropylene Antioxidants, Polyethylene Antioxidants, PVC Antioxidants, Polystyrene Antioxidants, ABS Antioxidants, Packaging Antioxidants, Construction Antioxidants, Automotive Antioxidants, Everspring Chemical Co Ltd, Clariant, Sumitomo Chemical Co Ltd, Oxris, Solvay, SI Group Inc, ADEKA CORPORATION, Trigon Antioxidants Pvt Ltd, Milliken & Company, 3V Sigma SpA, BASF SE, Astra Polymers, Dover Chemical Corporation, SONGWON, OMNOVA Solutions Inc, Emerald Performance Materials, Ampacet Corporation, Market Size, Market Share, CAGR, Market Growth, Industry Trends, Competitive Landscape.
Phenolic Antioxidant Industry Market Dynamics & Structure
The Phenolic Antioxidant Industry is characterized by a moderately concentrated market structure, with several major players holding significant market share. Technological innovation, particularly in developing higher-performance and more sustainable antioxidants, is a key driver. Stringent regulatory frameworks concerning environmental impact and material safety influence product development and adoption. Competition from alternative antioxidants, such as phosphite and phosphonite-based solutions, necessitates continuous innovation. End-user demographics, particularly within the packaging and automotive sectors, heavily influence demand. M&A activity has been moderate in recent years, with xx deals recorded between 2019 and 2024, resulting in a xx% shift in market concentration.
- Market Concentration: Moderately concentrated, with top 5 players holding approximately xx% market share in 2024.
- Technological Innovation: Focus on developing biodegradable and high-performance antioxidants.
- Regulatory Framework: Stringent regulations regarding environmental impact and safety standards.
- Competitive Substitutes: Phosphite and phosphonite antioxidants pose a significant competitive threat.
- End-User Demographics: Strong demand from packaging, automotive, and construction industries.
- M&A Trends: xx M&A deals recorded between 2019 and 2024, resulting in a xx% market share shift. Innovation barriers include high R&D costs and lengthy regulatory approval processes.
Phenolic Antioxidant Industry Growth Trends & Insights
The Phenolic Antioxidant Industry experienced a CAGR of xx% during the historical period (2019-2024), reaching a market size of xx Million units in 2024. This growth is primarily driven by increasing demand from the packaging and automotive sectors, fueled by rising consumption of polymers and stricter regulations on material degradation. The market is witnessing a gradual shift towards higher-performance antioxidants with enhanced thermal stability and processability. Consumer preference for sustainable packaging solutions is also creating significant opportunities for biodegradable phenolic antioxidants. The forecast period (2025-2033) projects a CAGR of xx%, reaching xx Million units by 2033. Technological disruptions, such as the development of novel antioxidant chemistries, are expected to further accelerate market growth.
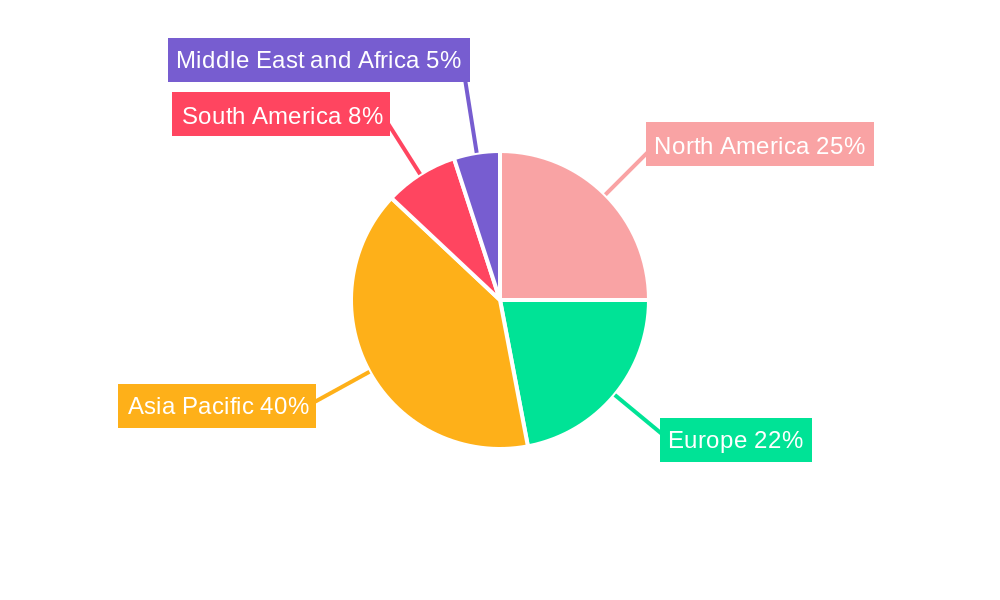
Dominant Regions, Countries, or Segments in Phenolic Antioxidant Industry
Asia-Pacific dominated the Phenolic Antioxidant market in 2024, accounting for xx% of the global market share, driven by robust growth in the polymer processing industries, particularly in China and India. Within the application segments, the packaging industry holds the largest share, followed by automotive and construction. The Polypropylene (PP) segment demonstrates the highest growth potential among polymer resins due to its widespread use in packaging and automotive applications.
- Key Drivers:
- Strong economic growth in Asia-Pacific, particularly in China and India.
- Expanding polymer processing industries.
- Increasing demand for high-performance packaging materials.
- Favorable government policies supporting industrial development.
- Dominance Factors:
- Large consumer base.
- Extensive manufacturing infrastructure.
- Growing adoption of advanced packaging technologies.
- Increasing investments in automotive production.
Phenolic Antioxidant Industry Product Landscape
The Phenolic Antioxidant market offers a diverse range of products categorized by antioxidant type (phenolic, phosphite, phosphonite), blends, and applications. Recent innovations focus on enhancing thermal stability, UV resistance, and color retention. Furthermore, there's a growing trend towards developing bio-based and more sustainable options, catering to environmentally conscious consumers. Unique selling propositions include improved processability, enhanced performance characteristics at lower concentrations, and superior color stability.
Key Drivers, Barriers & Challenges in Phenolic Antioxidant Industry
Key Drivers:
- Increasing demand for high-performance polymers in various end-use industries.
- Growing awareness of material degradation and the need for effective stabilization.
- Stringent regulations regarding product safety and environmental impact.
- Technological advancements in antioxidant synthesis and formulation.
Challenges & Restraints:
- Fluctuations in raw material prices impacting profitability.
- Stringent regulatory approvals increasing time-to-market.
- Intense competition from existing and emerging players.
- Potential supply chain disruptions affecting raw material availability. This resulted in a xx% increase in antioxidant prices in 2022.
Emerging Opportunities in Phenolic Antioxidant Industry
- Growing demand for biodegradable and compostable packaging.
- Expansion into niche applications like medical devices and electronics.
- Development of specialized antioxidants for high-temperature applications.
- Strategic partnerships and collaborations to enhance innovation and market reach.
Growth Accelerators in the Phenolic Antioxidant Industry
Technological breakthroughs in antioxidant synthesis, particularly focusing on sustainability and biodegradability, are driving long-term growth. Strategic partnerships between antioxidant manufacturers and polymer producers are fostering innovation and facilitating faster product development. Expanding into emerging economies and exploring new applications in high-growth sectors present significant opportunities for market expansion.
Key Players Shaping the Phenolic Antioxidant Industry Market
- Everspring Chemical Co Ltd
- Clariant
- Sumitomo Chemical Co Ltd
- Oxris
- Solvay
- SI Group Inc
- ADEKA CORPORATION
- Trigon Antioxidants Pvt Ltd
- Milliken & Company
- 3V Sigma SpA
- BASF SE
- Astra Polymers
- Dover Chemical Corporation
- SONGWON
- OMNOVA Solutions Inc
- Emerald Performance Materials
- Ampacet Corporation
Notable Milestones in Phenolic Antioxidant Industry Sector
- 2020: Clariant launches a new range of sustainable phenolic antioxidants.
- 2021: Sumitomo Chemical Co Ltd announces a strategic partnership with a major polymer producer.
- 2022: BASF SE invests in a new production facility for phenolic antioxidants.
- 2023: Several mergers and acquisitions reshape the industry landscape. (Specific details pending further research)
In-Depth Phenolic Antioxidant Industry Market Outlook
The Phenolic Antioxidant Industry is poised for robust growth in the coming years, driven by increasing demand from key end-use sectors, advancements in antioxidant technology, and favorable government policies supporting sustainability. Strategic investments in R&D, focus on developing novel and sustainable antioxidants, and expansion into new markets will be critical for companies seeking to capitalize on the future growth potential of this dynamic industry.
Phenolic Antioxidant Industry Segmentation
-
1. Polymer Resin
- 1.1. Polypropylene
- 1.2. Polyethylene
- 1.3. Polyvinyl Chloride
- 1.4. Polystyrene
- 1.5. Acrylonitrile Butadiene Styrene
-
2. Antioxidant Type
- 2.1. Phenolic
- 2.2. Phosphite and Phosphonite
- 2.3. Antioxident Blends
-
3. Application
- 3.1. Packaging
- 3.2. Construction
- 3.3. Automotive
- 3.4. Other Applications
Phenolic Antioxidant Industry Segmentation By Geography
-
1. Asia Pacific
- 1.1. China
- 1.2. India
- 1.3. Japan
- 1.4. South Korea
- 1.5. Rest of Asia Pacific
-
2. North America
- 2.1. United States
- 2.2. Canada
- 2.3. Mexico
-
3. Europe
- 3.1. Germany
- 3.2. United Kingdom
- 3.3. Italy
- 3.4. France
- 3.5. Rest of Europe
-
4. South America
- 4.1. Brazil
- 4.2. Argentina
- 4.3. Rest of South America
-
5. Middle East and Africa
- 5.1. Saudi Arabia
- 5.2. South Africa
- 5.3. Rest of Middle East and Africa
Phenolic Antioxidant Industry Regional Market Share
Geographic Coverage of Phenolic Antioxidant Industry
Phenolic Antioxidant Industry REPORT HIGHLIGHTS
| Aspects | Details |
|---|---|
| Study Period | 2020-2034 |
| Base Year | 2025 |
| Estimated Year | 2026 |
| Forecast Period | 2026-2034 |
| Historical Period | 2020-2025 |
| Growth Rate | CAGR of 6.9% from 2020-2034 |
| Segmentation |
|
Table of Contents
- 1. Introduction
- 1.1. Research Scope
- 1.2. Market Segmentation
- 1.3. Research Methodology
- 1.4. Definitions and Assumptions
- 2. Executive Summary
- 2.1. Introduction
- 3. Market Dynamics
- 3.1. Introduction
- 3.2. Market Drivers
- 3.2.1. ; Replacement of Conventional Materials by Plastics; Increasing Demand for Polypropylene
- 3.3. Market Restrains
- 3.3.1. ; Stringent Regulations Imposed on Plastics; Unfavorable Conditions Arising Due to COVID-19 Outbreak
- 3.4. Market Trends
- 3.4.1. Increasing Demand for Polypropylene Resin
- 4. Market Factor Analysis
- 4.1. Porters Five Forces
- 4.2. Supply/Value Chain
- 4.3. PESTEL analysis
- 4.4. Market Entropy
- 4.5. Patent/Trademark Analysis
- 5. Global Phenolic Antioxidant Industry Analysis, Insights and Forecast, 2020-2032
- 5.1. Market Analysis, Insights and Forecast - by Polymer Resin
- 5.1.1. Polypropylene
- 5.1.2. Polyethylene
- 5.1.3. Polyvinyl Chloride
- 5.1.4. Polystyrene
- 5.1.5. Acrylonitrile Butadiene Styrene
- 5.2. Market Analysis, Insights and Forecast - by Antioxidant Type
- 5.2.1. Phenolic
- 5.2.2. Phosphite and Phosphonite
- 5.2.3. Antioxident Blends
- 5.3. Market Analysis, Insights and Forecast - by Application
- 5.3.1. Packaging
- 5.3.2. Construction
- 5.3.3. Automotive
- 5.3.4. Other Applications
- 5.4. Market Analysis, Insights and Forecast - by Region
- 5.4.1. Asia Pacific
- 5.4.2. North America
- 5.4.3. Europe
- 5.4.4. South America
- 5.4.5. Middle East and Africa
- 5.1. Market Analysis, Insights and Forecast - by Polymer Resin
- 6. Asia Pacific Phenolic Antioxidant Industry Analysis, Insights and Forecast, 2020-2032
- 6.1. Market Analysis, Insights and Forecast - by Polymer Resin
- 6.1.1. Polypropylene
- 6.1.2. Polyethylene
- 6.1.3. Polyvinyl Chloride
- 6.1.4. Polystyrene
- 6.1.5. Acrylonitrile Butadiene Styrene
- 6.2. Market Analysis, Insights and Forecast - by Antioxidant Type
- 6.2.1. Phenolic
- 6.2.2. Phosphite and Phosphonite
- 6.2.3. Antioxident Blends
- 6.3. Market Analysis, Insights and Forecast - by Application
- 6.3.1. Packaging
- 6.3.2. Construction
- 6.3.3. Automotive
- 6.3.4. Other Applications
- 6.1. Market Analysis, Insights and Forecast - by Polymer Resin
- 7. North America Phenolic Antioxidant Industry Analysis, Insights and Forecast, 2020-2032
- 7.1. Market Analysis, Insights and Forecast - by Polymer Resin
- 7.1.1. Polypropylene
- 7.1.2. Polyethylene
- 7.1.3. Polyvinyl Chloride
- 7.1.4. Polystyrene
- 7.1.5. Acrylonitrile Butadiene Styrene
- 7.2. Market Analysis, Insights and Forecast - by Antioxidant Type
- 7.2.1. Phenolic
- 7.2.2. Phosphite and Phosphonite
- 7.2.3. Antioxident Blends
- 7.3. Market Analysis, Insights and Forecast - by Application
- 7.3.1. Packaging
- 7.3.2. Construction
- 7.3.3. Automotive
- 7.3.4. Other Applications
- 7.1. Market Analysis, Insights and Forecast - by Polymer Resin
- 8. Europe Phenolic Antioxidant Industry Analysis, Insights and Forecast, 2020-2032
- 8.1. Market Analysis, Insights and Forecast - by Polymer Resin
- 8.1.1. Polypropylene
- 8.1.2. Polyethylene
- 8.1.3. Polyvinyl Chloride
- 8.1.4. Polystyrene
- 8.1.5. Acrylonitrile Butadiene Styrene
- 8.2. Market Analysis, Insights and Forecast - by Antioxidant Type
- 8.2.1. Phenolic
- 8.2.2. Phosphite and Phosphonite
- 8.2.3. Antioxident Blends
- 8.3. Market Analysis, Insights and Forecast - by Application
- 8.3.1. Packaging
- 8.3.2. Construction
- 8.3.3. Automotive
- 8.3.4. Other Applications
- 8.1. Market Analysis, Insights and Forecast - by Polymer Resin
- 9. South America Phenolic Antioxidant Industry Analysis, Insights and Forecast, 2020-2032
- 9.1. Market Analysis, Insights and Forecast - by Polymer Resin
- 9.1.1. Polypropylene
- 9.1.2. Polyethylene
- 9.1.3. Polyvinyl Chloride
- 9.1.4. Polystyrene
- 9.1.5. Acrylonitrile Butadiene Styrene
- 9.2. Market Analysis, Insights and Forecast - by Antioxidant Type
- 9.2.1. Phenolic
- 9.2.2. Phosphite and Phosphonite
- 9.2.3. Antioxident Blends
- 9.3. Market Analysis, Insights and Forecast - by Application
- 9.3.1. Packaging
- 9.3.2. Construction
- 9.3.3. Automotive
- 9.3.4. Other Applications
- 9.1. Market Analysis, Insights and Forecast - by Polymer Resin
- 10. Middle East and Africa Phenolic Antioxidant Industry Analysis, Insights and Forecast, 2020-2032
- 10.1. Market Analysis, Insights and Forecast - by Polymer Resin
- 10.1.1. Polypropylene
- 10.1.2. Polyethylene
- 10.1.3. Polyvinyl Chloride
- 10.1.4. Polystyrene
- 10.1.5. Acrylonitrile Butadiene Styrene
- 10.2. Market Analysis, Insights and Forecast - by Antioxidant Type
- 10.2.1. Phenolic
- 10.2.2. Phosphite and Phosphonite
- 10.2.3. Antioxident Blends
- 10.3. Market Analysis, Insights and Forecast - by Application
- 10.3.1. Packaging
- 10.3.2. Construction
- 10.3.3. Automotive
- 10.3.4. Other Applications
- 10.1. Market Analysis, Insights and Forecast - by Polymer Resin
- 11. Competitive Analysis
- 11.1. Global Market Share Analysis 2025
- 11.2. Company Profiles
- 11.2.1 Everspring Chemical Co Ltd
- 11.2.1.1. Overview
- 11.2.1.2. Products
- 11.2.1.3. SWOT Analysis
- 11.2.1.4. Recent Developments
- 11.2.1.5. Financials (Based on Availability)
- 11.2.2 Clariant
- 11.2.2.1. Overview
- 11.2.2.2. Products
- 11.2.2.3. SWOT Analysis
- 11.2.2.4. Recent Developments
- 11.2.2.5. Financials (Based on Availability)
- 11.2.3 Sumitomo Chemical Co Ltd
- 11.2.3.1. Overview
- 11.2.3.2. Products
- 11.2.3.3. SWOT Analysis
- 11.2.3.4. Recent Developments
- 11.2.3.5. Financials (Based on Availability)
- 11.2.4 Oxris
- 11.2.4.1. Overview
- 11.2.4.2. Products
- 11.2.4.3. SWOT Analysis
- 11.2.4.4. Recent Developments
- 11.2.4.5. Financials (Based on Availability)
- 11.2.5 Solvay
- 11.2.5.1. Overview
- 11.2.5.2. Products
- 11.2.5.3. SWOT Analysis
- 11.2.5.4. Recent Developments
- 11.2.5.5. Financials (Based on Availability)
- 11.2.6 SI Group Inc
- 11.2.6.1. Overview
- 11.2.6.2. Products
- 11.2.6.3. SWOT Analysis
- 11.2.6.4. Recent Developments
- 11.2.6.5. Financials (Based on Availability)
- 11.2.7 ADEKA CORPORATION
- 11.2.7.1. Overview
- 11.2.7.2. Products
- 11.2.7.3. SWOT Analysis
- 11.2.7.4. Recent Developments
- 11.2.7.5. Financials (Based on Availability)
- 11.2.8 Trigon Antioxidants Pvt Ltd*List Not Exhaustive
- 11.2.8.1. Overview
- 11.2.8.2. Products
- 11.2.8.3. SWOT Analysis
- 11.2.8.4. Recent Developments
- 11.2.8.5. Financials (Based on Availability)
- 11.2.9 Milliken & Company
- 11.2.9.1. Overview
- 11.2.9.2. Products
- 11.2.9.3. SWOT Analysis
- 11.2.9.4. Recent Developments
- 11.2.9.5. Financials (Based on Availability)
- 11.2.10 3V Sigma SpA
- 11.2.10.1. Overview
- 11.2.10.2. Products
- 11.2.10.3. SWOT Analysis
- 11.2.10.4. Recent Developments
- 11.2.10.5. Financials (Based on Availability)
- 11.2.11 BASF SE
- 11.2.11.1. Overview
- 11.2.11.2. Products
- 11.2.11.3. SWOT Analysis
- 11.2.11.4. Recent Developments
- 11.2.11.5. Financials (Based on Availability)
- 11.2.12 Astra Polymers
- 11.2.12.1. Overview
- 11.2.12.2. Products
- 11.2.12.3. SWOT Analysis
- 11.2.12.4. Recent Developments
- 11.2.12.5. Financials (Based on Availability)
- 11.2.13 Dover Chemical Corporation
- 11.2.13.1. Overview
- 11.2.13.2. Products
- 11.2.13.3. SWOT Analysis
- 11.2.13.4. Recent Developments
- 11.2.13.5. Financials (Based on Availability)
- 11.2.14 SONGWON
- 11.2.14.1. Overview
- 11.2.14.2. Products
- 11.2.14.3. SWOT Analysis
- 11.2.14.4. Recent Developments
- 11.2.14.5. Financials (Based on Availability)
- 11.2.15 OMNOVA Solutions Inc
- 11.2.15.1. Overview
- 11.2.15.2. Products
- 11.2.15.3. SWOT Analysis
- 11.2.15.4. Recent Developments
- 11.2.15.5. Financials (Based on Availability)
- 11.2.16 Emerald Performance Materials
- 11.2.16.1. Overview
- 11.2.16.2. Products
- 11.2.16.3. SWOT Analysis
- 11.2.16.4. Recent Developments
- 11.2.16.5. Financials (Based on Availability)
- 11.2.17 Ampacet Corporation
- 11.2.17.1. Overview
- 11.2.17.2. Products
- 11.2.17.3. SWOT Analysis
- 11.2.17.4. Recent Developments
- 11.2.17.5. Financials (Based on Availability)
- 11.2.1 Everspring Chemical Co Ltd
List of Figures
- Figure 1: Global Phenolic Antioxidant Industry Revenue Breakdown (billion, %) by Region 2025 & 2033
- Figure 2: Asia Pacific Phenolic Antioxidant Industry Revenue (billion), by Polymer Resin 2025 & 2033
- Figure 3: Asia Pacific Phenolic Antioxidant Industry Revenue Share (%), by Polymer Resin 2025 & 2033
- Figure 4: Asia Pacific Phenolic Antioxidant Industry Revenue (billion), by Antioxidant Type 2025 & 2033
- Figure 5: Asia Pacific Phenolic Antioxidant Industry Revenue Share (%), by Antioxidant Type 2025 & 2033
- Figure 6: Asia Pacific Phenolic Antioxidant Industry Revenue (billion), by Application 2025 & 2033
- Figure 7: Asia Pacific Phenolic Antioxidant Industry Revenue Share (%), by Application 2025 & 2033
- Figure 8: Asia Pacific Phenolic Antioxidant Industry Revenue (billion), by Country 2025 & 2033
- Figure 9: Asia Pacific Phenolic Antioxidant Industry Revenue Share (%), by Country 2025 & 2033
- Figure 10: North America Phenolic Antioxidant Industry Revenue (billion), by Polymer Resin 2025 & 2033
- Figure 11: North America Phenolic Antioxidant Industry Revenue Share (%), by Polymer Resin 2025 & 2033
- Figure 12: North America Phenolic Antioxidant Industry Revenue (billion), by Antioxidant Type 2025 & 2033
- Figure 13: North America Phenolic Antioxidant Industry Revenue Share (%), by Antioxidant Type 2025 & 2033
- Figure 14: North America Phenolic Antioxidant Industry Revenue (billion), by Application 2025 & 2033
- Figure 15: North America Phenolic Antioxidant Industry Revenue Share (%), by Application 2025 & 2033
- Figure 16: North America Phenolic Antioxidant Industry Revenue (billion), by Country 2025 & 2033
- Figure 17: North America Phenolic Antioxidant Industry Revenue Share (%), by Country 2025 & 2033
- Figure 18: Europe Phenolic Antioxidant Industry Revenue (billion), by Polymer Resin 2025 & 2033
- Figure 19: Europe Phenolic Antioxidant Industry Revenue Share (%), by Polymer Resin 2025 & 2033
- Figure 20: Europe Phenolic Antioxidant Industry Revenue (billion), by Antioxidant Type 2025 & 2033
- Figure 21: Europe Phenolic Antioxidant Industry Revenue Share (%), by Antioxidant Type 2025 & 2033
- Figure 22: Europe Phenolic Antioxidant Industry Revenue (billion), by Application 2025 & 2033
- Figure 23: Europe Phenolic Antioxidant Industry Revenue Share (%), by Application 2025 & 2033
- Figure 24: Europe Phenolic Antioxidant Industry Revenue (billion), by Country 2025 & 2033
- Figure 25: Europe Phenolic Antioxidant Industry Revenue Share (%), by Country 2025 & 2033
- Figure 26: South America Phenolic Antioxidant Industry Revenue (billion), by Polymer Resin 2025 & 2033
- Figure 27: South America Phenolic Antioxidant Industry Revenue Share (%), by Polymer Resin 2025 & 2033
- Figure 28: South America Phenolic Antioxidant Industry Revenue (billion), by Antioxidant Type 2025 & 2033
- Figure 29: South America Phenolic Antioxidant Industry Revenue Share (%), by Antioxidant Type 2025 & 2033
- Figure 30: South America Phenolic Antioxidant Industry Revenue (billion), by Application 2025 & 2033
- Figure 31: South America Phenolic Antioxidant Industry Revenue Share (%), by Application 2025 & 2033
- Figure 32: South America Phenolic Antioxidant Industry Revenue (billion), by Country 2025 & 2033
- Figure 33: South America Phenolic Antioxidant Industry Revenue Share (%), by Country 2025 & 2033
- Figure 34: Middle East and Africa Phenolic Antioxidant Industry Revenue (billion), by Polymer Resin 2025 & 2033
- Figure 35: Middle East and Africa Phenolic Antioxidant Industry Revenue Share (%), by Polymer Resin 2025 & 2033
- Figure 36: Middle East and Africa Phenolic Antioxidant Industry Revenue (billion), by Antioxidant Type 2025 & 2033
- Figure 37: Middle East and Africa Phenolic Antioxidant Industry Revenue Share (%), by Antioxidant Type 2025 & 2033
- Figure 38: Middle East and Africa Phenolic Antioxidant Industry Revenue (billion), by Application 2025 & 2033
- Figure 39: Middle East and Africa Phenolic Antioxidant Industry Revenue Share (%), by Application 2025 & 2033
- Figure 40: Middle East and Africa Phenolic Antioxidant Industry Revenue (billion), by Country 2025 & 2033
- Figure 41: Middle East and Africa Phenolic Antioxidant Industry Revenue Share (%), by Country 2025 & 2033
List of Tables
- Table 1: Global Phenolic Antioxidant Industry Revenue billion Forecast, by Polymer Resin 2020 & 2033
- Table 2: Global Phenolic Antioxidant Industry Revenue billion Forecast, by Antioxidant Type 2020 & 2033
- Table 3: Global Phenolic Antioxidant Industry Revenue billion Forecast, by Application 2020 & 2033
- Table 4: Global Phenolic Antioxidant Industry Revenue billion Forecast, by Region 2020 & 2033
- Table 5: Global Phenolic Antioxidant Industry Revenue billion Forecast, by Polymer Resin 2020 & 2033
- Table 6: Global Phenolic Antioxidant Industry Revenue billion Forecast, by Antioxidant Type 2020 & 2033
- Table 7: Global Phenolic Antioxidant Industry Revenue billion Forecast, by Application 2020 & 2033
- Table 8: Global Phenolic Antioxidant Industry Revenue billion Forecast, by Country 2020 & 2033
- Table 9: China Phenolic Antioxidant Industry Revenue (billion) Forecast, by Application 2020 & 2033
- Table 10: India Phenolic Antioxidant Industry Revenue (billion) Forecast, by Application 2020 & 2033
- Table 11: Japan Phenolic Antioxidant Industry Revenue (billion) Forecast, by Application 2020 & 2033
- Table 12: South Korea Phenolic Antioxidant Industry Revenue (billion) Forecast, by Application 2020 & 2033
- Table 13: Rest of Asia Pacific Phenolic Antioxidant Industry Revenue (billion) Forecast, by Application 2020 & 2033
- Table 14: Global Phenolic Antioxidant Industry Revenue billion Forecast, by Polymer Resin 2020 & 2033
- Table 15: Global Phenolic Antioxidant Industry Revenue billion Forecast, by Antioxidant Type 2020 & 2033
- Table 16: Global Phenolic Antioxidant Industry Revenue billion Forecast, by Application 2020 & 2033
- Table 17: Global Phenolic Antioxidant Industry Revenue billion Forecast, by Country 2020 & 2033
- Table 18: United States Phenolic Antioxidant Industry Revenue (billion) Forecast, by Application 2020 & 2033
- Table 19: Canada Phenolic Antioxidant Industry Revenue (billion) Forecast, by Application 2020 & 2033
- Table 20: Mexico Phenolic Antioxidant Industry Revenue (billion) Forecast, by Application 2020 & 2033
- Table 21: Global Phenolic Antioxidant Industry Revenue billion Forecast, by Polymer Resin 2020 & 2033
- Table 22: Global Phenolic Antioxidant Industry Revenue billion Forecast, by Antioxidant Type 2020 & 2033
- Table 23: Global Phenolic Antioxidant Industry Revenue billion Forecast, by Application 2020 & 2033
- Table 24: Global Phenolic Antioxidant Industry Revenue billion Forecast, by Country 2020 & 2033
- Table 25: Germany Phenolic Antioxidant Industry Revenue (billion) Forecast, by Application 2020 & 2033
- Table 26: United Kingdom Phenolic Antioxidant Industry Revenue (billion) Forecast, by Application 2020 & 2033
- Table 27: Italy Phenolic Antioxidant Industry Revenue (billion) Forecast, by Application 2020 & 2033
- Table 28: France Phenolic Antioxidant Industry Revenue (billion) Forecast, by Application 2020 & 2033
- Table 29: Rest of Europe Phenolic Antioxidant Industry Revenue (billion) Forecast, by Application 2020 & 2033
- Table 30: Global Phenolic Antioxidant Industry Revenue billion Forecast, by Polymer Resin 2020 & 2033
- Table 31: Global Phenolic Antioxidant Industry Revenue billion Forecast, by Antioxidant Type 2020 & 2033
- Table 32: Global Phenolic Antioxidant Industry Revenue billion Forecast, by Application 2020 & 2033
- Table 33: Global Phenolic Antioxidant Industry Revenue billion Forecast, by Country 2020 & 2033
- Table 34: Brazil Phenolic Antioxidant Industry Revenue (billion) Forecast, by Application 2020 & 2033
- Table 35: Argentina Phenolic Antioxidant Industry Revenue (billion) Forecast, by Application 2020 & 2033
- Table 36: Rest of South America Phenolic Antioxidant Industry Revenue (billion) Forecast, by Application 2020 & 2033
- Table 37: Global Phenolic Antioxidant Industry Revenue billion Forecast, by Polymer Resin 2020 & 2033
- Table 38: Global Phenolic Antioxidant Industry Revenue billion Forecast, by Antioxidant Type 2020 & 2033
- Table 39: Global Phenolic Antioxidant Industry Revenue billion Forecast, by Application 2020 & 2033
- Table 40: Global Phenolic Antioxidant Industry Revenue billion Forecast, by Country 2020 & 2033
- Table 41: Saudi Arabia Phenolic Antioxidant Industry Revenue (billion) Forecast, by Application 2020 & 2033
- Table 42: South Africa Phenolic Antioxidant Industry Revenue (billion) Forecast, by Application 2020 & 2033
- Table 43: Rest of Middle East and Africa Phenolic Antioxidant Industry Revenue (billion) Forecast, by Application 2020 & 2033
Frequently Asked Questions
1. What is the projected Compound Annual Growth Rate (CAGR) of the Phenolic Antioxidant Industry?
The projected CAGR is approximately 6.9%.
2. Which companies are prominent players in the Phenolic Antioxidant Industry?
Key companies in the market include Everspring Chemical Co Ltd, Clariant, Sumitomo Chemical Co Ltd, Oxris, Solvay, SI Group Inc, ADEKA CORPORATION, Trigon Antioxidants Pvt Ltd*List Not Exhaustive, Milliken & Company, 3V Sigma SpA, BASF SE, Astra Polymers, Dover Chemical Corporation, SONGWON, OMNOVA Solutions Inc, Emerald Performance Materials, Ampacet Corporation.
3. What are the main segments of the Phenolic Antioxidant Industry?
The market segments include Polymer Resin, Antioxidant Type, Application.
4. Can you provide details about the market size?
The market size is estimated to be USD 32.44 billion as of 2022.
5. What are some drivers contributing to market growth?
; Replacement of Conventional Materials by Plastics; Increasing Demand for Polypropylene.
6. What are the notable trends driving market growth?
Increasing Demand for Polypropylene Resin.
7. Are there any restraints impacting market growth?
; Stringent Regulations Imposed on Plastics; Unfavorable Conditions Arising Due to COVID-19 Outbreak.
8. Can you provide examples of recent developments in the market?
N/A
9. What pricing options are available for accessing the report?
Pricing options include single-user, multi-user, and enterprise licenses priced at USD 4750, USD 5250, and USD 8750 respectively.
10. Is the market size provided in terms of value or volume?
The market size is provided in terms of value, measured in billion.
11. Are there any specific market keywords associated with the report?
Yes, the market keyword associated with the report is "Phenolic Antioxidant Industry," which aids in identifying and referencing the specific market segment covered.
12. How do I determine which pricing option suits my needs best?
The pricing options vary based on user requirements and access needs. Individual users may opt for single-user licenses, while businesses requiring broader access may choose multi-user or enterprise licenses for cost-effective access to the report.
13. Are there any additional resources or data provided in the Phenolic Antioxidant Industry report?
While the report offers comprehensive insights, it's advisable to review the specific contents or supplementary materials provided to ascertain if additional resources or data are available.
14. How can I stay updated on further developments or reports in the Phenolic Antioxidant Industry?
To stay informed about further developments, trends, and reports in the Phenolic Antioxidant Industry, consider subscribing to industry newsletters, following relevant companies and organizations, or regularly checking reputable industry news sources and publications.
Methodology
Step 1 - Identification of Relevant Samples Size from Population Database


Step 2 - Approaches for Defining Global Market Size (Value, Volume* & Price*)

Note*: In applicable scenarios
Step 3 - Data Sources
Primary Research
- Web Analytics
- Survey Reports
- Research Institute
- Latest Research Reports
- Opinion Leaders
Secondary Research
- Annual Reports
- White Paper
- Latest Press Release
- Industry Association
- Paid Database
- Investor Presentations

Step 4 - Data Triangulation
Involves using different sources of information in order to increase the validity of a study
These sources are likely to be stakeholders in a program - participants, other researchers, program staff, other community members, and so on.
Then we put all data in single framework & apply various statistical tools to find out the dynamic on the market.
During the analysis stage, feedback from the stakeholder groups would be compared to determine areas of agreement as well as areas of divergence