

Key Insights
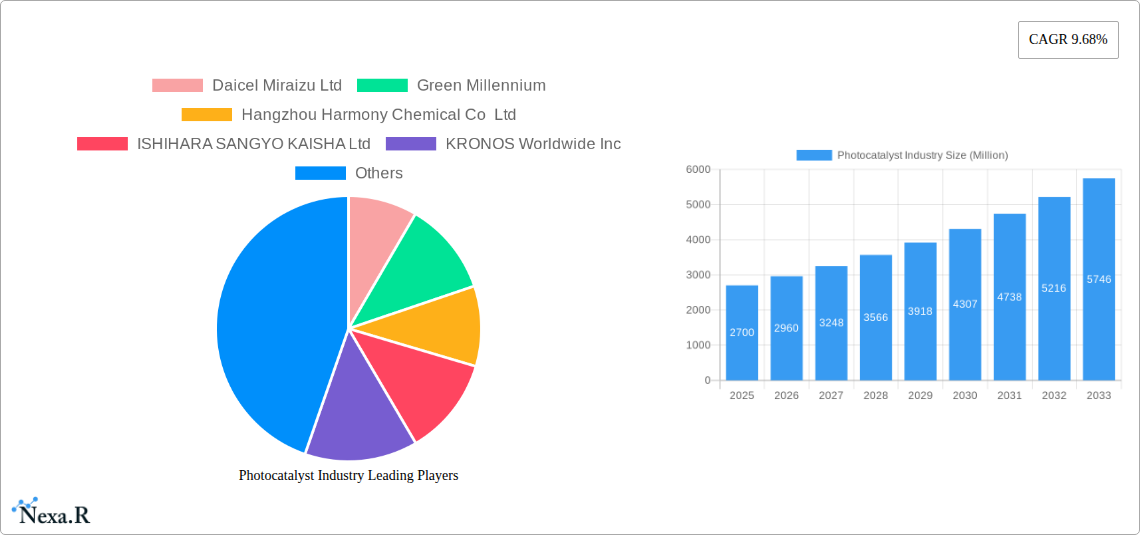
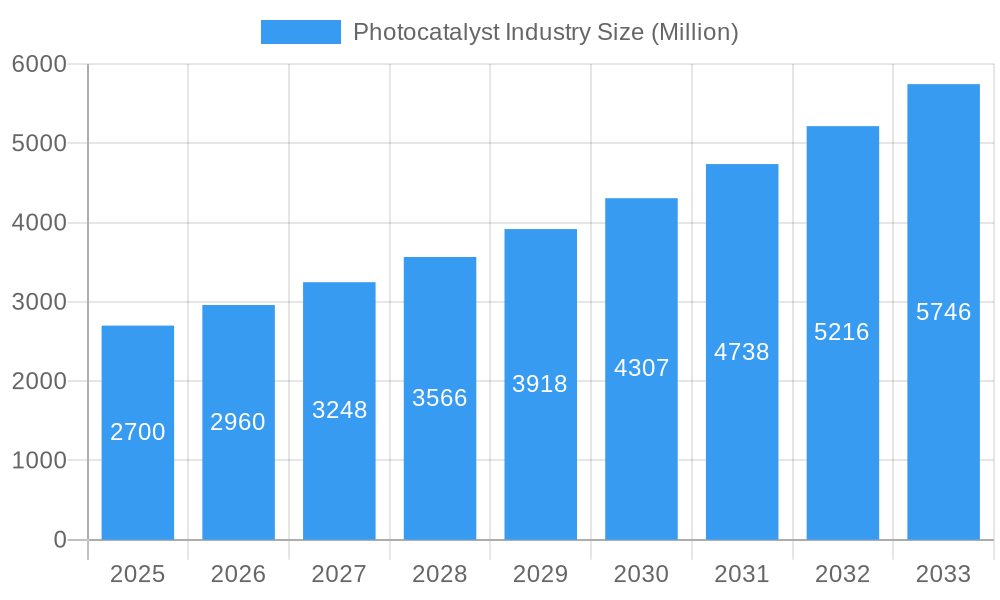
The global photocatalyst market, valued at $2.70 billion in 2025, is projected to experience robust growth, driven by increasing demand across diverse applications. A compound annual growth rate (CAGR) of 9.68% from 2025 to 2033 indicates a significant expansion, reaching an estimated market size exceeding $6 billion by 2033. This growth is fueled by several key factors. The rising adoption of photocatalysis in environmental remediation, particularly air and water purification, is a major driver, spurred by increasing concerns about pollution and stricter environmental regulations. Furthermore, the expanding use of photocatalysts in self-cleaning surfaces, antimicrobial coatings, and hydrogen production contributes significantly to market expansion. Technological advancements leading to more efficient and cost-effective photocatalyst materials, such as titanium dioxide and zinc oxide-based nanomaterials, are also bolstering market growth. While challenges remain, such as the need for improved light harvesting efficiency and scalability of production, the overall market outlook is positive, with substantial growth opportunities across various sectors and regions.
Photocatalyst Industry Market Size (In Billion)
The competitive landscape is characterized by a mix of established players and emerging companies. Key players like Daicel Miraizu Ltd, Kronos Worldwide Inc, and Showa Denko KK are actively investing in research and development to enhance product performance and expand their market reach. The emergence of innovative nanotechnology-based solutions is creating new avenues for growth, attracting both established chemical companies and specialized nanomaterial firms. Geographical expansion, particularly in developing economies with rapidly growing infrastructure and industrial sectors, presents significant opportunities for market penetration. However, market growth might be tempered by factors such as the cost of production, potential environmental concerns associated with the manufacturing process of certain photocatalysts, and the need for further research to overcome limitations in certain applications. Nevertheless, the continuous innovation in material science and the escalating need for sustainable solutions position the photocatalyst market for sustained expansion in the coming years.
Photocatalyst Industry Company Market Share
Photocatalyst Industry Market Report: 2019-2033
This comprehensive report provides a detailed analysis of the global photocatalyst industry, encompassing market dynamics, growth trends, regional segmentation, product landscape, key players, and future outlook. The study period covers 2019-2033, with 2025 serving as the base and estimated year. This report is invaluable for industry professionals, investors, and researchers seeking to understand and capitalize on opportunities within this rapidly evolving market. The parent market is the chemical industry, while the child market encompasses various applications such as environmental remediation, self-cleaning surfaces, and water purification. The global market size is projected to reach xx Million units by 2033.
Photocatalyst Industry Market Dynamics & Structure
The photocatalyst market is characterized by moderate concentration, with several major players holding significant market share. Technological innovation, particularly in nanomaterials and surface modification techniques, is a primary driver. Stringent environmental regulations globally are pushing adoption, while the emergence of cost-effective alternatives presents a competitive challenge. End-user demographics are expanding beyond traditional industrial applications to include consumer products. M&A activity has been relatively modest in recent years, with a focus on strategic partnerships and technology acquisitions.
- Market Concentration: Moderately concentrated, with top 5 players holding approximately xx% market share (2024).
- Technological Innovation: Focus on enhancing efficiency, durability, and cost-effectiveness of photocatalysts. Key innovations include novel nanomaterials and surface functionalization techniques.
- Regulatory Framework: Increasingly stringent environmental regulations are driving demand, particularly in developed markets.
- Competitive Substitutes: Other advanced oxidation processes (AOPs) and traditional treatment methods present competitive pressure.
- End-User Demographics: Expanding beyond industrial applications to encompass consumer products (self-cleaning surfaces, air purifiers).
- M&A Trends: Limited major acquisitions, but strategic partnerships and technology licensing agreements are prevalent. Estimated xx M&A deals between 2019-2024.
Photocatalyst Industry Growth Trends & Insights
The photocatalyst market has experienced steady growth over the past few years, driven by increasing environmental concerns and technological advancements. The market size exhibited a CAGR of xx% during the historical period (2019-2024) and is projected to maintain a CAGR of xx% during the forecast period (2025-2033), reaching xx Million units by 2033. This growth is attributed to factors such as increasing adoption rates across diverse applications, technological disruptions leading to improved performance and cost-effectiveness, and a shift in consumer behavior toward environmentally friendly solutions. Market penetration in key segments remains relatively low, indicating significant untapped potential.
Dominant Regions, Countries, or Segments in Photocatalyst Industry
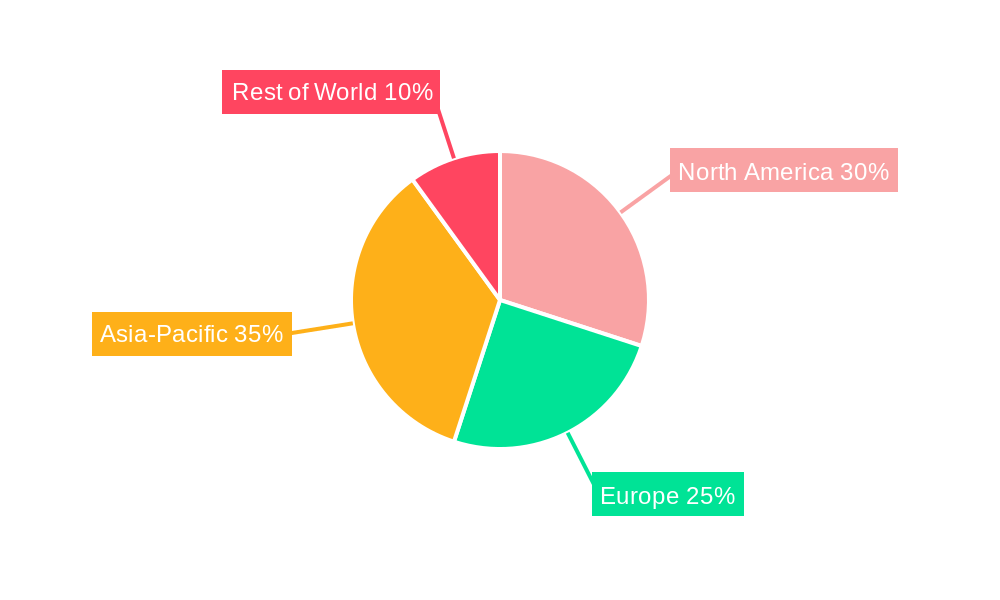
Asia-Pacific is currently the leading region for the photocatalyst market, driven by strong economic growth, expanding industrialization, and supportive government policies promoting environmental sustainability. China and Japan are particularly significant contributors. North America and Europe also hold substantial market share, albeit with slower growth rates compared to Asia-Pacific. The building and construction sector is a major segment, followed by water treatment and air purification.
- Key Drivers in Asia-Pacific:
- Rapid industrialization and urbanization.
- Increasing government investments in environmental protection.
- Growing awareness of air and water pollution issues.
- Dominance Factors: Large market size, high adoption rates in key applications, and favorable regulatory environment.
- Growth Potential: Significant potential for growth in emerging economies within Asia-Pacific and expanding applications in developed regions.
Photocatalyst Industry Product Landscape
Photocatalyst products are largely categorized by material type (TiO2, ZnO, etc.), particle size, and surface modifications. Recent innovations focus on improving photocatalytic efficiency, stability, and recyclability. Unique selling propositions often emphasize enhanced performance in specific applications (e.g., self-cleaning coatings with enhanced hydrophilicity). Technological advancements include the development of novel composite materials and doping strategies to broaden the spectral response and improve quantum efficiency.
Key Drivers, Barriers & Challenges in Photocatalyst Industry
Key Drivers:
- Growing environmental concerns and stringent regulations.
- Increasing demand for energy-efficient and sustainable solutions.
- Technological advancements leading to improved performance and cost-effectiveness.
Key Challenges & Restraints:
- High initial investment costs can hinder adoption, especially for smaller businesses.
- Potential toxicity concerns associated with certain photocatalyst materials necessitate careful handling and disposal practices.
- Competition from alternative technologies limits market penetration in specific applications. This leads to a projected xx% reduction in market growth by 2030.
Emerging Opportunities in Photocatalyst Industry
Emerging opportunities include the application of photocatalysts in water purification for decentralized systems, the development of self-cleaning and antimicrobial coatings for consumer products, and the exploration of photocatalytic air purification for indoor environments. Untapped markets in developing economies offer significant potential for growth, while innovative applications in areas such as energy production and environmental remediation present exciting possibilities.
Growth Accelerators in the Photocatalyst Industry
Technological breakthroughs in nanomaterial synthesis and surface engineering are driving long-term growth. Strategic partnerships between material scientists, equipment manufacturers, and end-users are fostering innovation and accelerating market adoption. Expanding into new applications, such as self-cleaning textiles, and exploring opportunities in emerging economies will significantly fuel future growth.
Key Players Shaping the Photocatalyst Industry Market
- Daicel Miraizu Ltd
- Green Millennium
- Hangzhou Harmony Chemical Co Ltd
- ISHIHARA SANGYO KAISHA Ltd
- KRONOS Worldwide Inc
- Lomon Billions
- Nanoptek Corp
- SHOWA DENKO KK
- TAYCA
- The Chemours Company
- TitanPE Technologies Inc
- Tronox Holdings PLC
- Venator Materials PLC
- *List Not Exhaustive
Notable Milestones in Photocatalyst Industry Sector
- September 2022: Venator secures ECO PASSPORT by OEKO-TEX for its fiber anatase TiO2, expanding its textile industry presence.
- March 2022: Tronox Holdings plc signs a long-term power purchase agreement with SOLA Group for 200 MW of solar power, enhancing sustainability and cost-efficiency.
In-Depth Photocatalyst Industry Market Outlook
The photocatalyst industry is poised for sustained growth, driven by technological advancements, expanding applications, and increasing environmental awareness. Strategic investments in research and development, coupled with collaborative partnerships, will be crucial for unlocking the full market potential and capitalizing on emerging opportunities across various sectors. The market's future trajectory is promising, with significant potential for innovation and market expansion in the coming decade.
Photocatalyst Industry Segmentation
-
1. Type
- 1.1. Titanium dioxide
- 1.2. Zinc Oxide
- 1.3. Other Types
-
2. Application
- 2.1. Self-Cleaning
- 2.2. Air Purification
- 2.3. Water Treatment
- 2.4. Anti-Fogging
- 2.5. Other Applications
Photocatalyst Industry Segmentation By Geography
-
1. Asia Pacific
- 1.1. China
- 1.2. India
- 1.3. Japan
- 1.4. South Korea
- 1.5. Rest of Asia Pacific
-
2. North America
- 2.1. United States
- 2.2. Canada
- 2.3. Mexico
-
3. Europe
- 3.1. Germany
- 3.2. United Kingdom
- 3.3. France
- 3.4. Italy
- 3.5. Rest of Europe
-
4. South America
- 4.1. Brazil
- 4.2. Argentina
- 4.3. Rest of South America
-
5. Middle East and Africa
- 5.1. Saudi Arabia
- 5.2. South Africa
- 5.3. Rest of Middle East and Africa
Photocatalyst Industry Regional Market Share
Geographic Coverage of Photocatalyst Industry
Photocatalyst Industry REPORT HIGHLIGHTS
| Aspects | Details |
|---|---|
| Study Period | 2020-2034 |
| Base Year | 2025 |
| Estimated Year | 2026 |
| Forecast Period | 2026-2034 |
| Historical Period | 2020-2025 |
| Growth Rate | CAGR of 9.68% from 2020-2034 |
| Segmentation |
|
Table of Contents
- 1. Introduction
- 1.1. Research Scope
- 1.2. Market Segmentation
- 1.3. Research Objective
- 1.4. Definitions and Assumptions
- 2. Executive Summary
- 2.1. Market Snapshot
- 3. Market Dynamics
- 3.1. Market Drivers
- 3.2. Market Restrains
- 3.3. Market Trends
- 3.4. Market Opportunities
- 4. Market Factor Analysis
- 4.1. Porters Five Forces
- 4.1.1. Bargaining Power of Suppliers
- 4.1.2. Bargaining Power of Buyers
- 4.1.3. Threat of New Entrants
- 4.1.4. Threat of Substitutes
- 4.1.5. Competitive Rivalry
- 4.2. PESTEL analysis
- 4.3. BCG Analysis
- 4.3.1. Stars (High Growth, High Market Share)
- 4.3.2. Cash Cows (Low Growth, High Market Share)
- 4.3.3. Question Mark (High Growth, Low Market Share)
- 4.3.4. Dogs (Low Growth, Low Market Share)
- 4.4. Ansoff Matrix Analysis
- 4.5. Supply Chain Analysis
- 4.6. Regulatory Landscape
- 4.7. Current Market Potential and Opportunity Assessment (TAM–SAM–SOM Framework)
- 4.8. NRP Analyst Note
- 4.1. Porters Five Forces
- 5. Market Analysis, Insights and Forecast 2021-2033
- 5.1. Market Analysis, Insights and Forecast - by Type
- 5.1.1. Titanium dioxide
- 5.1.2. Zinc Oxide
- 5.1.3. Other Types
- 5.2. Market Analysis, Insights and Forecast - by Application
- 5.2.1. Self-Cleaning
- 5.2.2. Air Purification
- 5.2.3. Water Treatment
- 5.2.4. Anti-Fogging
- 5.2.5. Other Applications
- 5.3. Market Analysis, Insights and Forecast - by Region
- 5.3.1. Asia Pacific
- 5.3.2. North America
- 5.3.3. Europe
- 5.3.4. South America
- 5.3.5. Middle East and Africa
- 5.1. Market Analysis, Insights and Forecast - by Type
- 6. Global Photocatalyst Industry Analysis, Insights and Forecast, 2021-2033
- 6.1. Market Analysis, Insights and Forecast - by Type
- 6.1.1. Titanium dioxide
- 6.1.2. Zinc Oxide
- 6.1.3. Other Types
- 6.2. Market Analysis, Insights and Forecast - by Application
- 6.2.1. Self-Cleaning
- 6.2.2. Air Purification
- 6.2.3. Water Treatment
- 6.2.4. Anti-Fogging
- 6.2.5. Other Applications
- 6.1. Market Analysis, Insights and Forecast - by Type
- 7. Asia Pacific Photocatalyst Industry Analysis, Insights and Forecast, 2020-2032
- 7.1. Market Analysis, Insights and Forecast - by Type
- 7.1.1. Titanium dioxide
- 7.1.2. Zinc Oxide
- 7.1.3. Other Types
- 7.2. Market Analysis, Insights and Forecast - by Application
- 7.2.1. Self-Cleaning
- 7.2.2. Air Purification
- 7.2.3. Water Treatment
- 7.2.4. Anti-Fogging
- 7.2.5. Other Applications
- 7.1. Market Analysis, Insights and Forecast - by Type
- 8. North America Photocatalyst Industry Analysis, Insights and Forecast, 2020-2032
- 8.1. Market Analysis, Insights and Forecast - by Type
- 8.1.1. Titanium dioxide
- 8.1.2. Zinc Oxide
- 8.1.3. Other Types
- 8.2. Market Analysis, Insights and Forecast - by Application
- 8.2.1. Self-Cleaning
- 8.2.2. Air Purification
- 8.2.3. Water Treatment
- 8.2.4. Anti-Fogging
- 8.2.5. Other Applications
- 8.1. Market Analysis, Insights and Forecast - by Type
- 9. Europe Photocatalyst Industry Analysis, Insights and Forecast, 2020-2032
- 9.1. Market Analysis, Insights and Forecast - by Type
- 9.1.1. Titanium dioxide
- 9.1.2. Zinc Oxide
- 9.1.3. Other Types
- 9.2. Market Analysis, Insights and Forecast - by Application
- 9.2.1. Self-Cleaning
- 9.2.2. Air Purification
- 9.2.3. Water Treatment
- 9.2.4. Anti-Fogging
- 9.2.5. Other Applications
- 9.1. Market Analysis, Insights and Forecast - by Type
- 10. South America Photocatalyst Industry Analysis, Insights and Forecast, 2020-2032
- 10.1. Market Analysis, Insights and Forecast - by Type
- 10.1.1. Titanium dioxide
- 10.1.2. Zinc Oxide
- 10.1.3. Other Types
- 10.2. Market Analysis, Insights and Forecast - by Application
- 10.2.1. Self-Cleaning
- 10.2.2. Air Purification
- 10.2.3. Water Treatment
- 10.2.4. Anti-Fogging
- 10.2.5. Other Applications
- 10.1. Market Analysis, Insights and Forecast - by Type
- 11. Middle East and Africa Photocatalyst Industry Analysis, Insights and Forecast, 2020-2032
- 11.1. Market Analysis, Insights and Forecast - by Type
- 11.1.1. Titanium dioxide
- 11.1.2. Zinc Oxide
- 11.1.3. Other Types
- 11.2. Market Analysis, Insights and Forecast - by Application
- 11.2.1. Self-Cleaning
- 11.2.2. Air Purification
- 11.2.3. Water Treatment
- 11.2.4. Anti-Fogging
- 11.2.5. Other Applications
- 11.1. Market Analysis, Insights and Forecast - by Type
- 12. Competitive Analysis
- 12.1. Company Profiles
- 12.1.1 Daicel Miraizu Ltd
- 12.1.1.1. Company Overview
- 12.1.1.2. Products
- 12.1.1.3. Company Financials
- 12.1.1.4. SWOT Analysis
- 12.1.2 Green Millennium
- 12.1.2.1. Company Overview
- 12.1.2.2. Products
- 12.1.2.3. Company Financials
- 12.1.2.4. SWOT Analysis
- 12.1.3 Hangzhou Harmony Chemical Co Ltd
- 12.1.3.1. Company Overview
- 12.1.3.2. Products
- 12.1.3.3. Company Financials
- 12.1.3.4. SWOT Analysis
- 12.1.4 ISHIHARA SANGYO KAISHA Ltd
- 12.1.4.1. Company Overview
- 12.1.4.2. Products
- 12.1.4.3. Company Financials
- 12.1.4.4. SWOT Analysis
- 12.1.5 KRONOS Worldwide Inc
- 12.1.5.1. Company Overview
- 12.1.5.2. Products
- 12.1.5.3. Company Financials
- 12.1.5.4. SWOT Analysis
- 12.1.6 Lomon Billions
- 12.1.6.1. Company Overview
- 12.1.6.2. Products
- 12.1.6.3. Company Financials
- 12.1.6.4. SWOT Analysis
- 12.1.7 Nanoptek Corp
- 12.1.7.1. Company Overview
- 12.1.7.2. Products
- 12.1.7.3. Company Financials
- 12.1.7.4. SWOT Analysis
- 12.1.8 SHOWA DENKO KK
- 12.1.8.1. Company Overview
- 12.1.8.2. Products
- 12.1.8.3. Company Financials
- 12.1.8.4. SWOT Analysis
- 12.1.9 TAYCA
- 12.1.9.1. Company Overview
- 12.1.9.2. Products
- 12.1.9.3. Company Financials
- 12.1.9.4. SWOT Analysis
- 12.1.10 The Chemours Company
- 12.1.10.1. Company Overview
- 12.1.10.2. Products
- 12.1.10.3. Company Financials
- 12.1.10.4. SWOT Analysis
- 12.1.11 TitanPE Technologies Inc
- 12.1.11.1. Company Overview
- 12.1.11.2. Products
- 12.1.11.3. Company Financials
- 12.1.11.4. SWOT Analysis
- 12.1.12 Tronox Holdings PLC
- 12.1.12.1. Company Overview
- 12.1.12.2. Products
- 12.1.12.3. Company Financials
- 12.1.12.4. SWOT Analysis
- 12.1.13 Venator Materials PLC*List Not Exhaustive
- 12.1.13.1. Company Overview
- 12.1.13.2. Products
- 12.1.13.3. Company Financials
- 12.1.13.4. SWOT Analysis
- 12.1.1 Daicel Miraizu Ltd
- 12.2. Market Entropy
- 12.2.1 Company's Key Areas Served
- 12.2.2 Recent Developments
- 12.3. Company Market Share Analysis 2025
- 12.3.1 Top 5 Companies Market Share Analysis
- 12.3.2 Top 3 Companies Market Share Analysis
- 12.4. List of Potential Customers
- 13. Research Methodology
List of Figures
- Figure 1: Global Photocatalyst Industry Revenue Breakdown (Million, %) by Region 2025 & 2033
- Figure 2: Global Photocatalyst Industry Volume Breakdown (Billion, %) by Region 2025 & 2033
- Figure 3: Asia Pacific Photocatalyst Industry Revenue (Million), by Type 2025 & 2033
- Figure 4: Asia Pacific Photocatalyst Industry Volume (Billion), by Type 2025 & 2033
- Figure 5: Asia Pacific Photocatalyst Industry Revenue Share (%), by Type 2025 & 2033
- Figure 6: Asia Pacific Photocatalyst Industry Volume Share (%), by Type 2025 & 2033
- Figure 7: Asia Pacific Photocatalyst Industry Revenue (Million), by Application 2025 & 2033
- Figure 8: Asia Pacific Photocatalyst Industry Volume (Billion), by Application 2025 & 2033
- Figure 9: Asia Pacific Photocatalyst Industry Revenue Share (%), by Application 2025 & 2033
- Figure 10: Asia Pacific Photocatalyst Industry Volume Share (%), by Application 2025 & 2033
- Figure 11: Asia Pacific Photocatalyst Industry Revenue (Million), by Country 2025 & 2033
- Figure 12: Asia Pacific Photocatalyst Industry Volume (Billion), by Country 2025 & 2033
- Figure 13: Asia Pacific Photocatalyst Industry Revenue Share (%), by Country 2025 & 2033
- Figure 14: Asia Pacific Photocatalyst Industry Volume Share (%), by Country 2025 & 2033
- Figure 15: North America Photocatalyst Industry Revenue (Million), by Type 2025 & 2033
- Figure 16: North America Photocatalyst Industry Volume (Billion), by Type 2025 & 2033
- Figure 17: North America Photocatalyst Industry Revenue Share (%), by Type 2025 & 2033
- Figure 18: North America Photocatalyst Industry Volume Share (%), by Type 2025 & 2033
- Figure 19: North America Photocatalyst Industry Revenue (Million), by Application 2025 & 2033
- Figure 20: North America Photocatalyst Industry Volume (Billion), by Application 2025 & 2033
- Figure 21: North America Photocatalyst Industry Revenue Share (%), by Application 2025 & 2033
- Figure 22: North America Photocatalyst Industry Volume Share (%), by Application 2025 & 2033
- Figure 23: North America Photocatalyst Industry Revenue (Million), by Country 2025 & 2033
- Figure 24: North America Photocatalyst Industry Volume (Billion), by Country 2025 & 2033
- Figure 25: North America Photocatalyst Industry Revenue Share (%), by Country 2025 & 2033
- Figure 26: North America Photocatalyst Industry Volume Share (%), by Country 2025 & 2033
- Figure 27: Europe Photocatalyst Industry Revenue (Million), by Type 2025 & 2033
- Figure 28: Europe Photocatalyst Industry Volume (Billion), by Type 2025 & 2033
- Figure 29: Europe Photocatalyst Industry Revenue Share (%), by Type 2025 & 2033
- Figure 30: Europe Photocatalyst Industry Volume Share (%), by Type 2025 & 2033
- Figure 31: Europe Photocatalyst Industry Revenue (Million), by Application 2025 & 2033
- Figure 32: Europe Photocatalyst Industry Volume (Billion), by Application 2025 & 2033
- Figure 33: Europe Photocatalyst Industry Revenue Share (%), by Application 2025 & 2033
- Figure 34: Europe Photocatalyst Industry Volume Share (%), by Application 2025 & 2033
- Figure 35: Europe Photocatalyst Industry Revenue (Million), by Country 2025 & 2033
- Figure 36: Europe Photocatalyst Industry Volume (Billion), by Country 2025 & 2033
- Figure 37: Europe Photocatalyst Industry Revenue Share (%), by Country 2025 & 2033
- Figure 38: Europe Photocatalyst Industry Volume Share (%), by Country 2025 & 2033
- Figure 39: South America Photocatalyst Industry Revenue (Million), by Type 2025 & 2033
- Figure 40: South America Photocatalyst Industry Volume (Billion), by Type 2025 & 2033
- Figure 41: South America Photocatalyst Industry Revenue Share (%), by Type 2025 & 2033
- Figure 42: South America Photocatalyst Industry Volume Share (%), by Type 2025 & 2033
- Figure 43: South America Photocatalyst Industry Revenue (Million), by Application 2025 & 2033
- Figure 44: South America Photocatalyst Industry Volume (Billion), by Application 2025 & 2033
- Figure 45: South America Photocatalyst Industry Revenue Share (%), by Application 2025 & 2033
- Figure 46: South America Photocatalyst Industry Volume Share (%), by Application 2025 & 2033
- Figure 47: South America Photocatalyst Industry Revenue (Million), by Country 2025 & 2033
- Figure 48: South America Photocatalyst Industry Volume (Billion), by Country 2025 & 2033
- Figure 49: South America Photocatalyst Industry Revenue Share (%), by Country 2025 & 2033
- Figure 50: South America Photocatalyst Industry Volume Share (%), by Country 2025 & 2033
- Figure 51: Middle East and Africa Photocatalyst Industry Revenue (Million), by Type 2025 & 2033
- Figure 52: Middle East and Africa Photocatalyst Industry Volume (Billion), by Type 2025 & 2033
- Figure 53: Middle East and Africa Photocatalyst Industry Revenue Share (%), by Type 2025 & 2033
- Figure 54: Middle East and Africa Photocatalyst Industry Volume Share (%), by Type 2025 & 2033
- Figure 55: Middle East and Africa Photocatalyst Industry Revenue (Million), by Application 2025 & 2033
- Figure 56: Middle East and Africa Photocatalyst Industry Volume (Billion), by Application 2025 & 2033
- Figure 57: Middle East and Africa Photocatalyst Industry Revenue Share (%), by Application 2025 & 2033
- Figure 58: Middle East and Africa Photocatalyst Industry Volume Share (%), by Application 2025 & 2033
- Figure 59: Middle East and Africa Photocatalyst Industry Revenue (Million), by Country 2025 & 2033
- Figure 60: Middle East and Africa Photocatalyst Industry Volume (Billion), by Country 2025 & 2033
- Figure 61: Middle East and Africa Photocatalyst Industry Revenue Share (%), by Country 2025 & 2033
- Figure 62: Middle East and Africa Photocatalyst Industry Volume Share (%), by Country 2025 & 2033
List of Tables
- Table 1: Global Photocatalyst Industry Revenue Million Forecast, by Type 2020 & 2033
- Table 2: Global Photocatalyst Industry Volume Billion Forecast, by Type 2020 & 2033
- Table 3: Global Photocatalyst Industry Revenue Million Forecast, by Application 2020 & 2033
- Table 4: Global Photocatalyst Industry Volume Billion Forecast, by Application 2020 & 2033
- Table 5: Global Photocatalyst Industry Revenue Million Forecast, by Region 2020 & 2033
- Table 6: Global Photocatalyst Industry Volume Billion Forecast, by Region 2020 & 2033
- Table 7: Global Photocatalyst Industry Revenue Million Forecast, by Type 2020 & 2033
- Table 8: Global Photocatalyst Industry Volume Billion Forecast, by Type 2020 & 2033
- Table 9: Global Photocatalyst Industry Revenue Million Forecast, by Application 2020 & 2033
- Table 10: Global Photocatalyst Industry Volume Billion Forecast, by Application 2020 & 2033
- Table 11: Global Photocatalyst Industry Revenue Million Forecast, by Country 2020 & 2033
- Table 12: Global Photocatalyst Industry Volume Billion Forecast, by Country 2020 & 2033
- Table 13: China Photocatalyst Industry Revenue (Million) Forecast, by Application 2020 & 2033
- Table 14: China Photocatalyst Industry Volume (Billion) Forecast, by Application 2020 & 2033
- Table 15: India Photocatalyst Industry Revenue (Million) Forecast, by Application 2020 & 2033
- Table 16: India Photocatalyst Industry Volume (Billion) Forecast, by Application 2020 & 2033
- Table 17: Japan Photocatalyst Industry Revenue (Million) Forecast, by Application 2020 & 2033
- Table 18: Japan Photocatalyst Industry Volume (Billion) Forecast, by Application 2020 & 2033
- Table 19: South Korea Photocatalyst Industry Revenue (Million) Forecast, by Application 2020 & 2033
- Table 20: South Korea Photocatalyst Industry Volume (Billion) Forecast, by Application 2020 & 2033
- Table 21: Rest of Asia Pacific Photocatalyst Industry Revenue (Million) Forecast, by Application 2020 & 2033
- Table 22: Rest of Asia Pacific Photocatalyst Industry Volume (Billion) Forecast, by Application 2020 & 2033
- Table 23: Global Photocatalyst Industry Revenue Million Forecast, by Type 2020 & 2033
- Table 24: Global Photocatalyst Industry Volume Billion Forecast, by Type 2020 & 2033
- Table 25: Global Photocatalyst Industry Revenue Million Forecast, by Application 2020 & 2033
- Table 26: Global Photocatalyst Industry Volume Billion Forecast, by Application 2020 & 2033
- Table 27: Global Photocatalyst Industry Revenue Million Forecast, by Country 2020 & 2033
- Table 28: Global Photocatalyst Industry Volume Billion Forecast, by Country 2020 & 2033
- Table 29: United States Photocatalyst Industry Revenue (Million) Forecast, by Application 2020 & 2033
- Table 30: United States Photocatalyst Industry Volume (Billion) Forecast, by Application 2020 & 2033
- Table 31: Canada Photocatalyst Industry Revenue (Million) Forecast, by Application 2020 & 2033
- Table 32: Canada Photocatalyst Industry Volume (Billion) Forecast, by Application 2020 & 2033
- Table 33: Mexico Photocatalyst Industry Revenue (Million) Forecast, by Application 2020 & 2033
- Table 34: Mexico Photocatalyst Industry Volume (Billion) Forecast, by Application 2020 & 2033
- Table 35: Global Photocatalyst Industry Revenue Million Forecast, by Type 2020 & 2033
- Table 36: Global Photocatalyst Industry Volume Billion Forecast, by Type 2020 & 2033
- Table 37: Global Photocatalyst Industry Revenue Million Forecast, by Application 2020 & 2033
- Table 38: Global Photocatalyst Industry Volume Billion Forecast, by Application 2020 & 2033
- Table 39: Global Photocatalyst Industry Revenue Million Forecast, by Country 2020 & 2033
- Table 40: Global Photocatalyst Industry Volume Billion Forecast, by Country 2020 & 2033
- Table 41: Germany Photocatalyst Industry Revenue (Million) Forecast, by Application 2020 & 2033
- Table 42: Germany Photocatalyst Industry Volume (Billion) Forecast, by Application 2020 & 2033
- Table 43: United Kingdom Photocatalyst Industry Revenue (Million) Forecast, by Application 2020 & 2033
- Table 44: United Kingdom Photocatalyst Industry Volume (Billion) Forecast, by Application 2020 & 2033
- Table 45: France Photocatalyst Industry Revenue (Million) Forecast, by Application 2020 & 2033
- Table 46: France Photocatalyst Industry Volume (Billion) Forecast, by Application 2020 & 2033
- Table 47: Italy Photocatalyst Industry Revenue (Million) Forecast, by Application 2020 & 2033
- Table 48: Italy Photocatalyst Industry Volume (Billion) Forecast, by Application 2020 & 2033
- Table 49: Rest of Europe Photocatalyst Industry Revenue (Million) Forecast, by Application 2020 & 2033
- Table 50: Rest of Europe Photocatalyst Industry Volume (Billion) Forecast, by Application 2020 & 2033
- Table 51: Global Photocatalyst Industry Revenue Million Forecast, by Type 2020 & 2033
- Table 52: Global Photocatalyst Industry Volume Billion Forecast, by Type 2020 & 2033
- Table 53: Global Photocatalyst Industry Revenue Million Forecast, by Application 2020 & 2033
- Table 54: Global Photocatalyst Industry Volume Billion Forecast, by Application 2020 & 2033
- Table 55: Global Photocatalyst Industry Revenue Million Forecast, by Country 2020 & 2033
- Table 56: Global Photocatalyst Industry Volume Billion Forecast, by Country 2020 & 2033
- Table 57: Brazil Photocatalyst Industry Revenue (Million) Forecast, by Application 2020 & 2033
- Table 58: Brazil Photocatalyst Industry Volume (Billion) Forecast, by Application 2020 & 2033
- Table 59: Argentina Photocatalyst Industry Revenue (Million) Forecast, by Application 2020 & 2033
- Table 60: Argentina Photocatalyst Industry Volume (Billion) Forecast, by Application 2020 & 2033
- Table 61: Rest of South America Photocatalyst Industry Revenue (Million) Forecast, by Application 2020 & 2033
- Table 62: Rest of South America Photocatalyst Industry Volume (Billion) Forecast, by Application 2020 & 2033
- Table 63: Global Photocatalyst Industry Revenue Million Forecast, by Type 2020 & 2033
- Table 64: Global Photocatalyst Industry Volume Billion Forecast, by Type 2020 & 2033
- Table 65: Global Photocatalyst Industry Revenue Million Forecast, by Application 2020 & 2033
- Table 66: Global Photocatalyst Industry Volume Billion Forecast, by Application 2020 & 2033
- Table 67: Global Photocatalyst Industry Revenue Million Forecast, by Country 2020 & 2033
- Table 68: Global Photocatalyst Industry Volume Billion Forecast, by Country 2020 & 2033
- Table 69: Saudi Arabia Photocatalyst Industry Revenue (Million) Forecast, by Application 2020 & 2033
- Table 70: Saudi Arabia Photocatalyst Industry Volume (Billion) Forecast, by Application 2020 & 2033
- Table 71: South Africa Photocatalyst Industry Revenue (Million) Forecast, by Application 2020 & 2033
- Table 72: South Africa Photocatalyst Industry Volume (Billion) Forecast, by Application 2020 & 2033
- Table 73: Rest of Middle East and Africa Photocatalyst Industry Revenue (Million) Forecast, by Application 2020 & 2033
- Table 74: Rest of Middle East and Africa Photocatalyst Industry Volume (Billion) Forecast, by Application 2020 & 2033
Frequently Asked Questions
1. What is the projected Compound Annual Growth Rate (CAGR) of the Photocatalyst Industry?
The projected CAGR is approximately 9.68%.
2. Which companies are prominent players in the Photocatalyst Industry?
Key companies in the market include Daicel Miraizu Ltd, Green Millennium, Hangzhou Harmony Chemical Co Ltd, ISHIHARA SANGYO KAISHA Ltd, KRONOS Worldwide Inc, Lomon Billions, Nanoptek Corp, SHOWA DENKO KK, TAYCA, The Chemours Company, TitanPE Technologies Inc, Tronox Holdings PLC, Venator Materials PLC*List Not Exhaustive.
3. What are the main segments of the Photocatalyst Industry?
The market segments include Type, Application.
4. Can you provide details about the market size?
The market size is estimated to be USD 2.70 Million as of 2022.
5. What are some drivers contributing to market growth?
Rapidly Growing Demand for Titanium dioxide; Increasing Applications in Water Treatment and Air Purification.
6. What are the notable trends driving market growth?
Increasing Demand from Self Cleaning Application.
7. Are there any restraints impacting market growth?
Rapidly Growing Demand for Titanium dioxide; Increasing Applications in Water Treatment and Air Purification.
8. Can you provide examples of recent developments in the market?
September 2022: Venator has become the first manufacturer and supplier of fiber anatase titanium dioxide (TiO2) to the textile industry to secure an ECO PASSPORT by OEKO-TEX.
9. What pricing options are available for accessing the report?
Pricing options include single-user, multi-user, and enterprise licenses priced at USD 4750, USD 5250, and USD 8750 respectively.
10. Is the market size provided in terms of value or volume?
The market size is provided in terms of value, measured in Million and volume, measured in Billion.
11. Are there any specific market keywords associated with the report?
Yes, the market keyword associated with the report is "Photocatalyst Industry," which aids in identifying and referencing the specific market segment covered.
12. How do I determine which pricing option suits my needs best?
The pricing options vary based on user requirements and access needs. Individual users may opt for single-user licenses, while businesses requiring broader access may choose multi-user or enterprise licenses for cost-effective access to the report.
13. Are there any additional resources or data provided in the Photocatalyst Industry report?
While the report offers comprehensive insights, it's advisable to review the specific contents or supplementary materials provided to ascertain if additional resources or data are available.
14. How can I stay updated on further developments or reports in the Photocatalyst Industry?
To stay informed about further developments, trends, and reports in the Photocatalyst Industry, consider subscribing to industry newsletters, following relevant companies and organizations, or regularly checking reputable industry news sources and publications.
Methodology
Step 1 - Identification of Relevant Samples Size from Population Database


Step 2 - Approaches for Defining Global Market Size (Value, Volume* & Price*)

Note*: In applicable scenarios
Step 3 - Data Sources
Primary Research
- Web Analytics
- Survey Reports
- Research Institute
- Latest Research Reports
- Opinion Leaders
Secondary Research
- Annual Reports
- White Paper
- Latest Press Release
- Industry Association
- Paid Database
- Investor Presentations

Step 4 - Data Triangulation
Involves using different sources of information in order to increase the validity of a study
These sources are likely to be stakeholders in a program - participants, other researchers, program staff, other community members, and so on.
Then we put all data in single framework & apply various statistical tools to find out the dynamic on the market.
During the analysis stage, feedback from the stakeholder groups would be compared to determine areas of agreement as well as areas of divergence