

Key Insights
The global polyether amine market, valued at approximately $9.05 billion in 2025, is projected for significant expansion with a Compound Annual Growth Rate (CAGR) of 13.56% from 2025 to 2033. This growth is fueled by escalating demand for advanced materials across key industries. The increasing implementation of polyurea coatings in infrastructure and automotive sectors, owing to their exceptional durability and rapid curing properties, is a primary market driver. Additionally, the expanding use of polyether amines as fuel additives to enhance engine efficiency and reduce emissions presents a substantial growth avenue. The rising adoption in composite materials for lightweighting in aerospace and automotive industries further bolsters market demand. Demand for advanced adhesives and sealants in construction, electronics, and packaging, seeking superior bonding strength and durability, also contributes to market propulsion.
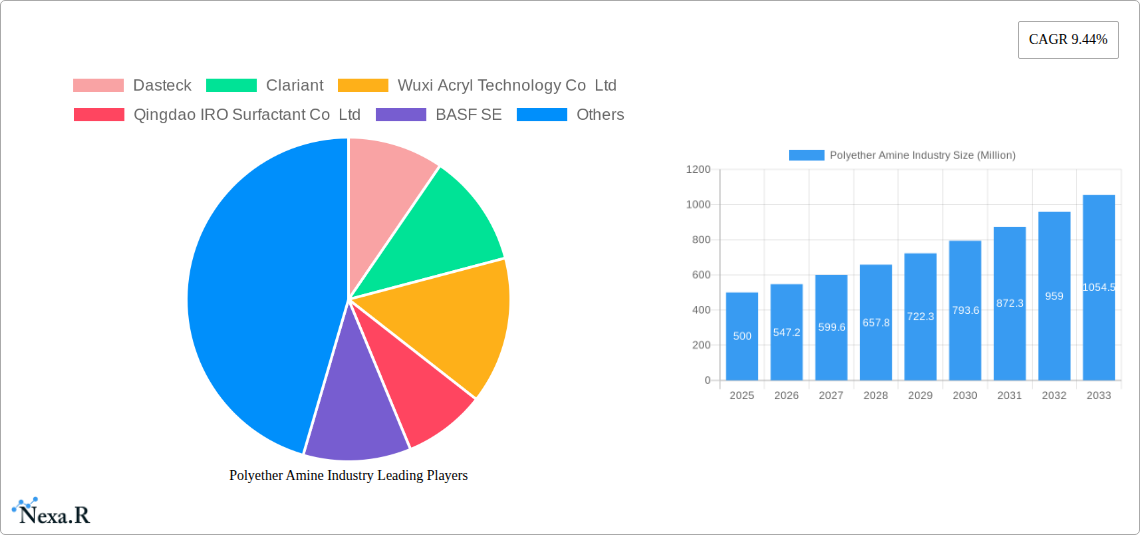
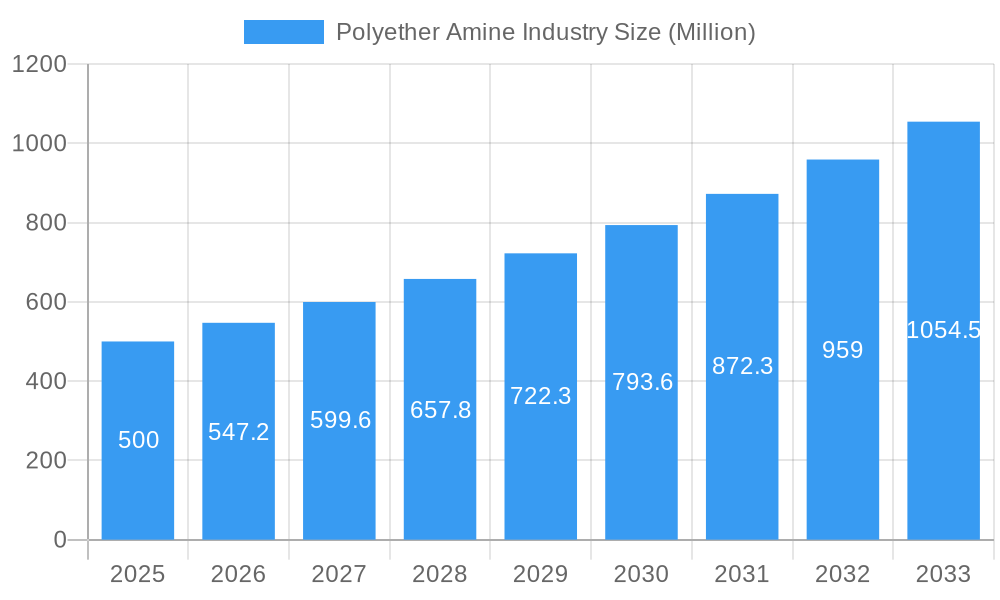
Polyether Amine Industry Market Size (In Billion)
The polyurea application segment is poised to lead the market due to its extensive use in protective coatings and insulation. Among product types, diamine is expected to capture a significant share, driven by its versatility and cost-effectiveness compared to monoamine and triamine. Geographically, the Asia-Pacific region, led by China and India, is projected to dominate, supported by rapid industrialization and extensive infrastructure development. However, stringent environmental regulations concerning volatile organic compound (VOC) emissions may present challenges. Leading players including BASF SE, Huntsman International LLC, and Clariant are actively investing in R&D to develop innovative, high-performance, and eco-friendly formulations, thereby reinforcing their market positions and driving industry innovation to meet evolving market demands.
Polyether Amine Industry Company Market Share
Polyether Amine Industry Market Report: 2019-2033
This comprehensive report provides a detailed analysis of the Polyether Amine industry, encompassing market dynamics, growth trends, regional dominance, product landscape, and key players. The study period covers 2019-2033, with a base year of 2025 and a forecast period of 2025-2033. This report is essential for industry professionals, investors, and strategic decision-makers seeking a thorough understanding of this dynamic market. Market values are presented in Million units.
Polyether Amine Industry Market Dynamics & Structure
The polyether amine market is characterized by moderate concentration, with key players like BASF SE and Huntsman International LLC holding significant market share. Technological innovation, particularly in developing high-performance amines for specific applications, is a major driver. Stringent environmental regulations concerning VOC emissions influence product formulation and manufacturing processes. Competitive substitutes include other types of curing agents and crosslinkers, depending on the application. The end-user demographics are diverse, spanning automotive, construction, and electronics industries. M&A activity has been moderate, with strategic partnerships playing a larger role than outright acquisitions. The market size in 2024 was approximately xx Million.
- Market Concentration: Moderately concentrated, with top 5 players holding approximately 60% market share (estimated).
- Technological Innovation: Focus on enhanced performance (e.g., faster curing, improved durability), bio-based alternatives, and sustainability.
- Regulatory Landscape: Stringent environmental regulations driving adoption of low-VOC formulations.
- Competitive Substitutes: Epoxy resins, isocyanates, and other crosslinking agents.
- M&A Activity: Moderate level of mergers and acquisitions, with strategic alliances more prevalent.
Polyether Amine Industry Growth Trends & Insights
The polyether amine market exhibits steady growth, driven by increasing demand across diverse applications. The historical period (2019-2024) witnessed a CAGR of approximately xx%, with the market size reaching xx Million in 2024. The forecast period (2025-2033) is projected to maintain a healthy CAGR of xx%, fueled by expansion into emerging markets and the growing adoption of polyether amines in high-growth sectors like renewable energy and advanced materials. Market penetration in key applications remains strong, exceeding 70% in some segments. Technological advancements, such as the development of customized polyether amines, cater to specific application requirements, further boosting market growth.
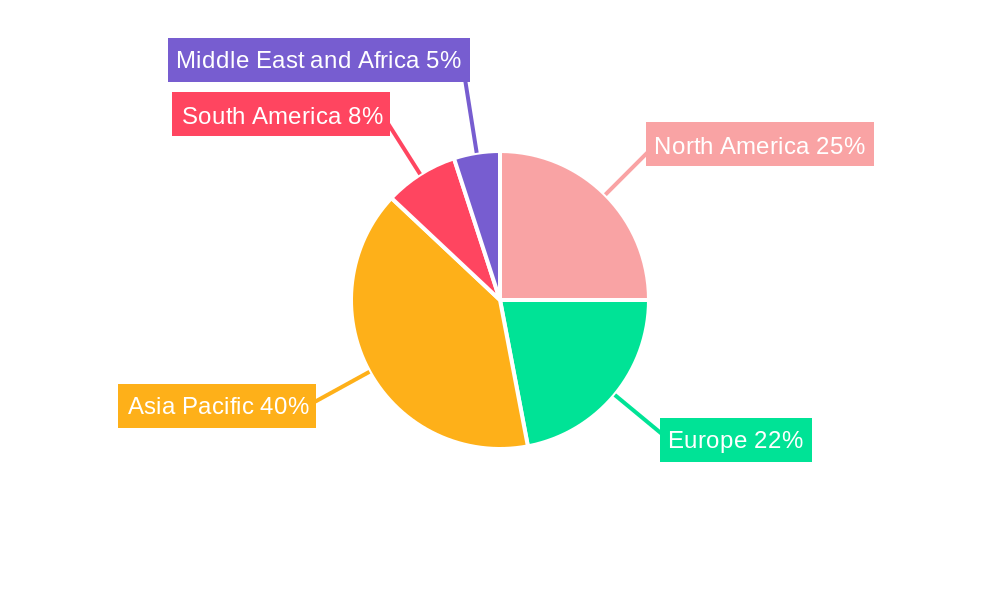
Dominant Regions, Countries, or Segments in Polyether Amine Industry
North America and Europe currently dominate the polyether amine market, driven by robust industrial activity and established infrastructure. Within these regions, the United States and Germany are leading national markets. Among application segments, polyurea coatings and adhesives & sealants exhibit the highest growth rates, driven by rising construction activity and the demand for high-performance bonding solutions. The Diamine segment holds the largest market share within the type segment.
- Key Regional Drivers: Developed infrastructure, robust industrial base, and favorable government policies.
- Leading Application Segments: Polyurea coatings, Adhesives & Sealants, showing the highest growth potential.
- Dominant Type Segment: Diamine segment holds the largest market share due to its versatile properties.
Polyether Amine Industry Product Landscape
Polyether amines are available in various grades, each tailored to specific application requirements. Innovations focus on improving properties like curing speed, adhesion strength, flexibility, and resistance to chemicals and temperature extremes. Many products feature enhanced sustainability profiles, using bio-based feedstocks or incorporating lower-VOC formulations. Unique selling propositions often emphasize performance advantages, cost-effectiveness, and compliance with stringent industry regulations.
Key Drivers, Barriers & Challenges in Polyether Amine Industry
Key Drivers:
- Growing demand from construction and automotive industries.
- Increasing adoption in renewable energy applications.
- Technological advancements leading to improved product performance.
Key Challenges:
- Fluctuations in raw material prices.
- Stringent environmental regulations.
- Intense competition from substitute products. The impact of these challenges is estimated to reduce the market growth by approximately xx% during the forecast period.
Emerging Opportunities in Polyether Amine Industry
Emerging opportunities lie in expanding into high-growth markets in Asia-Pacific and Latin America. The development of bio-based polyether amines offers significant potential for sustainable applications. Furthermore, exploring novel applications in areas like 3D printing and advanced composites represents significant growth avenues.
Growth Accelerators in the Polyether Amine Industry Industry
Strategic partnerships between manufacturers and end-users are accelerating market growth, leading to customized product development and enhanced application support. Technological breakthroughs in catalyst design and process optimization are further improving efficiency and product performance. Expansion into new geographic markets, especially in developing economies with high growth potential, is another crucial accelerator.
Key Players Shaping the Polyether Amine Industry Market
- Dasteck
- Clariant
- Wuxi Acryl Technology Co Ltd
- Qingdao IRO Surfactant Co Ltd
- BASF SE
- Huntsman International LLC
- Shanghai Chenhua International Trade Co Ltd
- Chia Tai New Materials (Zibo Zhengda Polyurethane Co Ltd )
Notable Milestones in Polyether Amine Industry Sector
- June 2022: BASF announced expansion of polyetheramine production capacity at its Geismar site, aiming for mid-2023 on-stream. This expansion significantly increases the supply of Baxxodur brand polyetheramines, positively impacting market availability.
- March 2022: Brenntag partnered with BASF SE as the exclusive distributor for Polyetheramines and Baxxodur in the US and Canada, enhancing market reach and accessibility.
In-Depth Polyether Amine Industry Market Outlook
The polyether amine market is poised for robust growth, driven by ongoing technological advancements, strategic collaborations, and expanding applications across diverse sectors. The focus on sustainability and the development of high-performance, specialized amines will shape future market dynamics. Strategic investments in R&D and expanding into untapped markets will further enhance market potential and create new opportunities for growth and innovation.
Polyether Amine Industry Segmentation
-
1. Type
- 1.1. Monoamine
- 1.2. Diamine
- 1.3. Triamine
-
2. Application
- 2.1. Polyurea
- 2.2. Fuel Additives
- 2.3. Composites
- 2.4. Epoxy Coatings
- 2.5. Adhesives and Sealants
- 2.6. Other Applications
Polyether Amine Industry Segmentation By Geography
-
1. Asia Pacific
- 1.1. China
- 1.2. India
- 1.3. Japan
- 1.4. South Korea
- 1.5. Rest of Asia Pacific
-
2. North America
- 2.1. United States
- 2.2. Canada
- 2.3. Mexico
-
3. Europe
- 3.1. Germany
- 3.2. United Kingdom
- 3.3. Italy
- 3.4. France
- 3.5. Rest of Europe
-
4. South America
- 4.1. Brazil
- 4.2. Argentina
- 4.3. Rest of South America
-
5. Middle East and Africa
- 5.1. Saudi Arabia
- 5.2. South Africa
- 5.3. Rest of Middle East and Africa
Polyether Amine Industry Regional Market Share
Geographic Coverage of Polyether Amine Industry
Polyether Amine Industry REPORT HIGHLIGHTS
| Aspects | Details |
|---|---|
| Study Period | 2020-2034 |
| Base Year | 2025 |
| Estimated Year | 2026 |
| Forecast Period | 2026-2034 |
| Historical Period | 2020-2025 |
| Growth Rate | CAGR of 13.56% from 2020-2034 |
| Segmentation |
|
Table of Contents
- 1. Introduction
- 1.1. Research Scope
- 1.2. Market Segmentation
- 1.3. Research Objective
- 1.4. Definitions and Assumptions
- 2. Executive Summary
- 2.1. Market Snapshot
- 3. Market Dynamics
- 3.1. Market Drivers
- 3.2. Market Restrains
- 3.3. Market Trends
- 3.4. Market Opportunities
- 4. Market Factor Analysis
- 4.1. Porters Five Forces
- 4.1.1. Bargaining Power of Suppliers
- 4.1.2. Bargaining Power of Buyers
- 4.1.3. Threat of New Entrants
- 4.1.4. Threat of Substitutes
- 4.1.5. Competitive Rivalry
- 4.2. PESTEL analysis
- 4.3. BCG Analysis
- 4.3.1. Stars (High Growth, High Market Share)
- 4.3.2. Cash Cows (Low Growth, High Market Share)
- 4.3.3. Question Mark (High Growth, Low Market Share)
- 4.3.4. Dogs (Low Growth, Low Market Share)
- 4.4. Ansoff Matrix Analysis
- 4.5. Supply Chain Analysis
- 4.6. Regulatory Landscape
- 4.7. Current Market Potential and Opportunity Assessment (TAM–SAM–SOM Framework)
- 4.8. NRP Analyst Note
- 4.1. Porters Five Forces
- 5. Market Analysis, Insights and Forecast 2021-2033
- 5.1. Market Analysis, Insights and Forecast - by Type
- 5.1.1. Monoamine
- 5.1.2. Diamine
- 5.1.3. Triamine
- 5.2. Market Analysis, Insights and Forecast - by Application
- 5.2.1. Polyurea
- 5.2.2. Fuel Additives
- 5.2.3. Composites
- 5.2.4. Epoxy Coatings
- 5.2.5. Adhesives and Sealants
- 5.2.6. Other Applications
- 5.3. Market Analysis, Insights and Forecast - by Region
- 5.3.1. Asia Pacific
- 5.3.2. North America
- 5.3.3. Europe
- 5.3.4. South America
- 5.3.5. Middle East and Africa
- 5.1. Market Analysis, Insights and Forecast - by Type
- 6. Global Polyether Amine Industry Analysis, Insights and Forecast, 2021-2033
- 6.1. Market Analysis, Insights and Forecast - by Type
- 6.1.1. Monoamine
- 6.1.2. Diamine
- 6.1.3. Triamine
- 6.2. Market Analysis, Insights and Forecast - by Application
- 6.2.1. Polyurea
- 6.2.2. Fuel Additives
- 6.2.3. Composites
- 6.2.4. Epoxy Coatings
- 6.2.5. Adhesives and Sealants
- 6.2.6. Other Applications
- 6.1. Market Analysis, Insights and Forecast - by Type
- 7. Asia Pacific Polyether Amine Industry Analysis, Insights and Forecast, 2020-2032
- 7.1. Market Analysis, Insights and Forecast - by Type
- 7.1.1. Monoamine
- 7.1.2. Diamine
- 7.1.3. Triamine
- 7.2. Market Analysis, Insights and Forecast - by Application
- 7.2.1. Polyurea
- 7.2.2. Fuel Additives
- 7.2.3. Composites
- 7.2.4. Epoxy Coatings
- 7.2.5. Adhesives and Sealants
- 7.2.6. Other Applications
- 7.1. Market Analysis, Insights and Forecast - by Type
- 8. North America Polyether Amine Industry Analysis, Insights and Forecast, 2020-2032
- 8.1. Market Analysis, Insights and Forecast - by Type
- 8.1.1. Monoamine
- 8.1.2. Diamine
- 8.1.3. Triamine
- 8.2. Market Analysis, Insights and Forecast - by Application
- 8.2.1. Polyurea
- 8.2.2. Fuel Additives
- 8.2.3. Composites
- 8.2.4. Epoxy Coatings
- 8.2.5. Adhesives and Sealants
- 8.2.6. Other Applications
- 8.1. Market Analysis, Insights and Forecast - by Type
- 9. Europe Polyether Amine Industry Analysis, Insights and Forecast, 2020-2032
- 9.1. Market Analysis, Insights and Forecast - by Type
- 9.1.1. Monoamine
- 9.1.2. Diamine
- 9.1.3. Triamine
- 9.2. Market Analysis, Insights and Forecast - by Application
- 9.2.1. Polyurea
- 9.2.2. Fuel Additives
- 9.2.3. Composites
- 9.2.4. Epoxy Coatings
- 9.2.5. Adhesives and Sealants
- 9.2.6. Other Applications
- 9.1. Market Analysis, Insights and Forecast - by Type
- 10. South America Polyether Amine Industry Analysis, Insights and Forecast, 2020-2032
- 10.1. Market Analysis, Insights and Forecast - by Type
- 10.1.1. Monoamine
- 10.1.2. Diamine
- 10.1.3. Triamine
- 10.2. Market Analysis, Insights and Forecast - by Application
- 10.2.1. Polyurea
- 10.2.2. Fuel Additives
- 10.2.3. Composites
- 10.2.4. Epoxy Coatings
- 10.2.5. Adhesives and Sealants
- 10.2.6. Other Applications
- 10.1. Market Analysis, Insights and Forecast - by Type
- 11. Middle East and Africa Polyether Amine Industry Analysis, Insights and Forecast, 2020-2032
- 11.1. Market Analysis, Insights and Forecast - by Type
- 11.1.1. Monoamine
- 11.1.2. Diamine
- 11.1.3. Triamine
- 11.2. Market Analysis, Insights and Forecast - by Application
- 11.2.1. Polyurea
- 11.2.2. Fuel Additives
- 11.2.3. Composites
- 11.2.4. Epoxy Coatings
- 11.2.5. Adhesives and Sealants
- 11.2.6. Other Applications
- 11.1. Market Analysis, Insights and Forecast - by Type
- 12. Competitive Analysis
- 12.1. Company Profiles
- 12.1.1 Dasteck
- 12.1.1.1. Company Overview
- 12.1.1.2. Products
- 12.1.1.3. Company Financials
- 12.1.1.4. SWOT Analysis
- 12.1.2 Clariant
- 12.1.2.1. Company Overview
- 12.1.2.2. Products
- 12.1.2.3. Company Financials
- 12.1.2.4. SWOT Analysis
- 12.1.3 Wuxi Acryl Technology Co Ltd
- 12.1.3.1. Company Overview
- 12.1.3.2. Products
- 12.1.3.3. Company Financials
- 12.1.3.4. SWOT Analysis
- 12.1.4 Qingdao IRO Surfactant Co Ltd
- 12.1.4.1. Company Overview
- 12.1.4.2. Products
- 12.1.4.3. Company Financials
- 12.1.4.4. SWOT Analysis
- 12.1.5 BASF SE
- 12.1.5.1. Company Overview
- 12.1.5.2. Products
- 12.1.5.3. Company Financials
- 12.1.5.4. SWOT Analysis
- 12.1.6 Huntsman International LLC
- 12.1.6.1. Company Overview
- 12.1.6.2. Products
- 12.1.6.3. Company Financials
- 12.1.6.4. SWOT Analysis
- 12.1.7 Shanghai Chenhua International Trade Co Ltd
- 12.1.7.1. Company Overview
- 12.1.7.2. Products
- 12.1.7.3. Company Financials
- 12.1.7.4. SWOT Analysis
- 12.1.8 Chia Tai New Materials (Zibo Zhengda Polyurethane Co Ltd )
- 12.1.8.1. Company Overview
- 12.1.8.2. Products
- 12.1.8.3. Company Financials
- 12.1.8.4. SWOT Analysis
- 12.1.1 Dasteck
- 12.2. Market Entropy
- 12.2.1 Company's Key Areas Served
- 12.2.2 Recent Developments
- 12.3. Company Market Share Analysis 2025
- 12.3.1 Top 5 Companies Market Share Analysis
- 12.3.2 Top 3 Companies Market Share Analysis
- 12.4. List of Potential Customers
- 13. Research Methodology
List of Figures
- Figure 1: Global Polyether Amine Industry Revenue Breakdown (billion, %) by Region 2025 & 2033
- Figure 2: Global Polyether Amine Industry Volume Breakdown (kilotons, %) by Region 2025 & 2033
- Figure 3: Asia Pacific Polyether Amine Industry Revenue (billion), by Type 2025 & 2033
- Figure 4: Asia Pacific Polyether Amine Industry Volume (kilotons), by Type 2025 & 2033
- Figure 5: Asia Pacific Polyether Amine Industry Revenue Share (%), by Type 2025 & 2033
- Figure 6: Asia Pacific Polyether Amine Industry Volume Share (%), by Type 2025 & 2033
- Figure 7: Asia Pacific Polyether Amine Industry Revenue (billion), by Application 2025 & 2033
- Figure 8: Asia Pacific Polyether Amine Industry Volume (kilotons), by Application 2025 & 2033
- Figure 9: Asia Pacific Polyether Amine Industry Revenue Share (%), by Application 2025 & 2033
- Figure 10: Asia Pacific Polyether Amine Industry Volume Share (%), by Application 2025 & 2033
- Figure 11: Asia Pacific Polyether Amine Industry Revenue (billion), by Country 2025 & 2033
- Figure 12: Asia Pacific Polyether Amine Industry Volume (kilotons), by Country 2025 & 2033
- Figure 13: Asia Pacific Polyether Amine Industry Revenue Share (%), by Country 2025 & 2033
- Figure 14: Asia Pacific Polyether Amine Industry Volume Share (%), by Country 2025 & 2033
- Figure 15: North America Polyether Amine Industry Revenue (billion), by Type 2025 & 2033
- Figure 16: North America Polyether Amine Industry Volume (kilotons), by Type 2025 & 2033
- Figure 17: North America Polyether Amine Industry Revenue Share (%), by Type 2025 & 2033
- Figure 18: North America Polyether Amine Industry Volume Share (%), by Type 2025 & 2033
- Figure 19: North America Polyether Amine Industry Revenue (billion), by Application 2025 & 2033
- Figure 20: North America Polyether Amine Industry Volume (kilotons), by Application 2025 & 2033
- Figure 21: North America Polyether Amine Industry Revenue Share (%), by Application 2025 & 2033
- Figure 22: North America Polyether Amine Industry Volume Share (%), by Application 2025 & 2033
- Figure 23: North America Polyether Amine Industry Revenue (billion), by Country 2025 & 2033
- Figure 24: North America Polyether Amine Industry Volume (kilotons), by Country 2025 & 2033
- Figure 25: North America Polyether Amine Industry Revenue Share (%), by Country 2025 & 2033
- Figure 26: North America Polyether Amine Industry Volume Share (%), by Country 2025 & 2033
- Figure 27: Europe Polyether Amine Industry Revenue (billion), by Type 2025 & 2033
- Figure 28: Europe Polyether Amine Industry Volume (kilotons), by Type 2025 & 2033
- Figure 29: Europe Polyether Amine Industry Revenue Share (%), by Type 2025 & 2033
- Figure 30: Europe Polyether Amine Industry Volume Share (%), by Type 2025 & 2033
- Figure 31: Europe Polyether Amine Industry Revenue (billion), by Application 2025 & 2033
- Figure 32: Europe Polyether Amine Industry Volume (kilotons), by Application 2025 & 2033
- Figure 33: Europe Polyether Amine Industry Revenue Share (%), by Application 2025 & 2033
- Figure 34: Europe Polyether Amine Industry Volume Share (%), by Application 2025 & 2033
- Figure 35: Europe Polyether Amine Industry Revenue (billion), by Country 2025 & 2033
- Figure 36: Europe Polyether Amine Industry Volume (kilotons), by Country 2025 & 2033
- Figure 37: Europe Polyether Amine Industry Revenue Share (%), by Country 2025 & 2033
- Figure 38: Europe Polyether Amine Industry Volume Share (%), by Country 2025 & 2033
- Figure 39: South America Polyether Amine Industry Revenue (billion), by Type 2025 & 2033
- Figure 40: South America Polyether Amine Industry Volume (kilotons), by Type 2025 & 2033
- Figure 41: South America Polyether Amine Industry Revenue Share (%), by Type 2025 & 2033
- Figure 42: South America Polyether Amine Industry Volume Share (%), by Type 2025 & 2033
- Figure 43: South America Polyether Amine Industry Revenue (billion), by Application 2025 & 2033
- Figure 44: South America Polyether Amine Industry Volume (kilotons), by Application 2025 & 2033
- Figure 45: South America Polyether Amine Industry Revenue Share (%), by Application 2025 & 2033
- Figure 46: South America Polyether Amine Industry Volume Share (%), by Application 2025 & 2033
- Figure 47: South America Polyether Amine Industry Revenue (billion), by Country 2025 & 2033
- Figure 48: South America Polyether Amine Industry Volume (kilotons), by Country 2025 & 2033
- Figure 49: South America Polyether Amine Industry Revenue Share (%), by Country 2025 & 2033
- Figure 50: South America Polyether Amine Industry Volume Share (%), by Country 2025 & 2033
- Figure 51: Middle East and Africa Polyether Amine Industry Revenue (billion), by Type 2025 & 2033
- Figure 52: Middle East and Africa Polyether Amine Industry Volume (kilotons), by Type 2025 & 2033
- Figure 53: Middle East and Africa Polyether Amine Industry Revenue Share (%), by Type 2025 & 2033
- Figure 54: Middle East and Africa Polyether Amine Industry Volume Share (%), by Type 2025 & 2033
- Figure 55: Middle East and Africa Polyether Amine Industry Revenue (billion), by Application 2025 & 2033
- Figure 56: Middle East and Africa Polyether Amine Industry Volume (kilotons), by Application 2025 & 2033
- Figure 57: Middle East and Africa Polyether Amine Industry Revenue Share (%), by Application 2025 & 2033
- Figure 58: Middle East and Africa Polyether Amine Industry Volume Share (%), by Application 2025 & 2033
- Figure 59: Middle East and Africa Polyether Amine Industry Revenue (billion), by Country 2025 & 2033
- Figure 60: Middle East and Africa Polyether Amine Industry Volume (kilotons), by Country 2025 & 2033
- Figure 61: Middle East and Africa Polyether Amine Industry Revenue Share (%), by Country 2025 & 2033
- Figure 62: Middle East and Africa Polyether Amine Industry Volume Share (%), by Country 2025 & 2033
List of Tables
- Table 1: Global Polyether Amine Industry Revenue billion Forecast, by Type 2020 & 2033
- Table 2: Global Polyether Amine Industry Volume kilotons Forecast, by Type 2020 & 2033
- Table 3: Global Polyether Amine Industry Revenue billion Forecast, by Application 2020 & 2033
- Table 4: Global Polyether Amine Industry Volume kilotons Forecast, by Application 2020 & 2033
- Table 5: Global Polyether Amine Industry Revenue billion Forecast, by Region 2020 & 2033
- Table 6: Global Polyether Amine Industry Volume kilotons Forecast, by Region 2020 & 2033
- Table 7: Global Polyether Amine Industry Revenue billion Forecast, by Type 2020 & 2033
- Table 8: Global Polyether Amine Industry Volume kilotons Forecast, by Type 2020 & 2033
- Table 9: Global Polyether Amine Industry Revenue billion Forecast, by Application 2020 & 2033
- Table 10: Global Polyether Amine Industry Volume kilotons Forecast, by Application 2020 & 2033
- Table 11: Global Polyether Amine Industry Revenue billion Forecast, by Country 2020 & 2033
- Table 12: Global Polyether Amine Industry Volume kilotons Forecast, by Country 2020 & 2033
- Table 13: China Polyether Amine Industry Revenue (billion) Forecast, by Application 2020 & 2033
- Table 14: China Polyether Amine Industry Volume (kilotons) Forecast, by Application 2020 & 2033
- Table 15: India Polyether Amine Industry Revenue (billion) Forecast, by Application 2020 & 2033
- Table 16: India Polyether Amine Industry Volume (kilotons) Forecast, by Application 2020 & 2033
- Table 17: Japan Polyether Amine Industry Revenue (billion) Forecast, by Application 2020 & 2033
- Table 18: Japan Polyether Amine Industry Volume (kilotons) Forecast, by Application 2020 & 2033
- Table 19: South Korea Polyether Amine Industry Revenue (billion) Forecast, by Application 2020 & 2033
- Table 20: South Korea Polyether Amine Industry Volume (kilotons) Forecast, by Application 2020 & 2033
- Table 21: Rest of Asia Pacific Polyether Amine Industry Revenue (billion) Forecast, by Application 2020 & 2033
- Table 22: Rest of Asia Pacific Polyether Amine Industry Volume (kilotons) Forecast, by Application 2020 & 2033
- Table 23: Global Polyether Amine Industry Revenue billion Forecast, by Type 2020 & 2033
- Table 24: Global Polyether Amine Industry Volume kilotons Forecast, by Type 2020 & 2033
- Table 25: Global Polyether Amine Industry Revenue billion Forecast, by Application 2020 & 2033
- Table 26: Global Polyether Amine Industry Volume kilotons Forecast, by Application 2020 & 2033
- Table 27: Global Polyether Amine Industry Revenue billion Forecast, by Country 2020 & 2033
- Table 28: Global Polyether Amine Industry Volume kilotons Forecast, by Country 2020 & 2033
- Table 29: United States Polyether Amine Industry Revenue (billion) Forecast, by Application 2020 & 2033
- Table 30: United States Polyether Amine Industry Volume (kilotons) Forecast, by Application 2020 & 2033
- Table 31: Canada Polyether Amine Industry Revenue (billion) Forecast, by Application 2020 & 2033
- Table 32: Canada Polyether Amine Industry Volume (kilotons) Forecast, by Application 2020 & 2033
- Table 33: Mexico Polyether Amine Industry Revenue (billion) Forecast, by Application 2020 & 2033
- Table 34: Mexico Polyether Amine Industry Volume (kilotons) Forecast, by Application 2020 & 2033
- Table 35: Global Polyether Amine Industry Revenue billion Forecast, by Type 2020 & 2033
- Table 36: Global Polyether Amine Industry Volume kilotons Forecast, by Type 2020 & 2033
- Table 37: Global Polyether Amine Industry Revenue billion Forecast, by Application 2020 & 2033
- Table 38: Global Polyether Amine Industry Volume kilotons Forecast, by Application 2020 & 2033
- Table 39: Global Polyether Amine Industry Revenue billion Forecast, by Country 2020 & 2033
- Table 40: Global Polyether Amine Industry Volume kilotons Forecast, by Country 2020 & 2033
- Table 41: Germany Polyether Amine Industry Revenue (billion) Forecast, by Application 2020 & 2033
- Table 42: Germany Polyether Amine Industry Volume (kilotons) Forecast, by Application 2020 & 2033
- Table 43: United Kingdom Polyether Amine Industry Revenue (billion) Forecast, by Application 2020 & 2033
- Table 44: United Kingdom Polyether Amine Industry Volume (kilotons) Forecast, by Application 2020 & 2033
- Table 45: Italy Polyether Amine Industry Revenue (billion) Forecast, by Application 2020 & 2033
- Table 46: Italy Polyether Amine Industry Volume (kilotons) Forecast, by Application 2020 & 2033
- Table 47: France Polyether Amine Industry Revenue (billion) Forecast, by Application 2020 & 2033
- Table 48: France Polyether Amine Industry Volume (kilotons) Forecast, by Application 2020 & 2033
- Table 49: Rest of Europe Polyether Amine Industry Revenue (billion) Forecast, by Application 2020 & 2033
- Table 50: Rest of Europe Polyether Amine Industry Volume (kilotons) Forecast, by Application 2020 & 2033
- Table 51: Global Polyether Amine Industry Revenue billion Forecast, by Type 2020 & 2033
- Table 52: Global Polyether Amine Industry Volume kilotons Forecast, by Type 2020 & 2033
- Table 53: Global Polyether Amine Industry Revenue billion Forecast, by Application 2020 & 2033
- Table 54: Global Polyether Amine Industry Volume kilotons Forecast, by Application 2020 & 2033
- Table 55: Global Polyether Amine Industry Revenue billion Forecast, by Country 2020 & 2033
- Table 56: Global Polyether Amine Industry Volume kilotons Forecast, by Country 2020 & 2033
- Table 57: Brazil Polyether Amine Industry Revenue (billion) Forecast, by Application 2020 & 2033
- Table 58: Brazil Polyether Amine Industry Volume (kilotons) Forecast, by Application 2020 & 2033
- Table 59: Argentina Polyether Amine Industry Revenue (billion) Forecast, by Application 2020 & 2033
- Table 60: Argentina Polyether Amine Industry Volume (kilotons) Forecast, by Application 2020 & 2033
- Table 61: Rest of South America Polyether Amine Industry Revenue (billion) Forecast, by Application 2020 & 2033
- Table 62: Rest of South America Polyether Amine Industry Volume (kilotons) Forecast, by Application 2020 & 2033
- Table 63: Global Polyether Amine Industry Revenue billion Forecast, by Type 2020 & 2033
- Table 64: Global Polyether Amine Industry Volume kilotons Forecast, by Type 2020 & 2033
- Table 65: Global Polyether Amine Industry Revenue billion Forecast, by Application 2020 & 2033
- Table 66: Global Polyether Amine Industry Volume kilotons Forecast, by Application 2020 & 2033
- Table 67: Global Polyether Amine Industry Revenue billion Forecast, by Country 2020 & 2033
- Table 68: Global Polyether Amine Industry Volume kilotons Forecast, by Country 2020 & 2033
- Table 69: Saudi Arabia Polyether Amine Industry Revenue (billion) Forecast, by Application 2020 & 2033
- Table 70: Saudi Arabia Polyether Amine Industry Volume (kilotons) Forecast, by Application 2020 & 2033
- Table 71: South Africa Polyether Amine Industry Revenue (billion) Forecast, by Application 2020 & 2033
- Table 72: South Africa Polyether Amine Industry Volume (kilotons) Forecast, by Application 2020 & 2033
- Table 73: Rest of Middle East and Africa Polyether Amine Industry Revenue (billion) Forecast, by Application 2020 & 2033
- Table 74: Rest of Middle East and Africa Polyether Amine Industry Volume (kilotons) Forecast, by Application 2020 & 2033
Frequently Asked Questions
1. What is the projected Compound Annual Growth Rate (CAGR) of the Polyether Amine Industry?
The projected CAGR is approximately 13.56%.
2. Which companies are prominent players in the Polyether Amine Industry?
Key companies in the market include Dasteck, Clariant, Wuxi Acryl Technology Co Ltd , Qingdao IRO Surfactant Co Ltd, BASF SE, Huntsman International LLC, Shanghai Chenhua International Trade Co Ltd, Chia Tai New Materials (Zibo Zhengda Polyurethane Co Ltd ).
3. What are the main segments of the Polyether Amine Industry?
The market segments include Type, Application.
4. Can you provide details about the market size?
The market size is estimated to be USD 9.05 billion as of 2022.
5. What are some drivers contributing to market growth?
Increasing Demand from Construction Industry; Growing Trend of Eco-friendly and Renewable Energy Generation; Other Drivers.
6. What are the notable trends driving market growth?
Increasing Demand from Composite Application.
7. Are there any restraints impacting market growth?
Environmental Concern Due to Excessive Use of Polyetheramines; Other Restraints.
8. Can you provide examples of recent developments in the market?
June 2022: BASF made an announcement about the ongoing expansion of production capacity at the Geismar site in North America, with the aim of being on-stream by mid-2023. This expansion will focus on key specialty amines and will enable the production of more polyetheramines marketed under the Baxxodur brand.
9. What pricing options are available for accessing the report?
Pricing options include single-user, multi-user, and enterprise licenses priced at USD 4750, USD 5250, and USD 8750 respectively.
10. Is the market size provided in terms of value or volume?
The market size is provided in terms of value, measured in billion and volume, measured in kilotons.
11. Are there any specific market keywords associated with the report?
Yes, the market keyword associated with the report is "Polyether Amine Industry," which aids in identifying and referencing the specific market segment covered.
12. How do I determine which pricing option suits my needs best?
The pricing options vary based on user requirements and access needs. Individual users may opt for single-user licenses, while businesses requiring broader access may choose multi-user or enterprise licenses for cost-effective access to the report.
13. Are there any additional resources or data provided in the Polyether Amine Industry report?
While the report offers comprehensive insights, it's advisable to review the specific contents or supplementary materials provided to ascertain if additional resources or data are available.
14. How can I stay updated on further developments or reports in the Polyether Amine Industry?
To stay informed about further developments, trends, and reports in the Polyether Amine Industry, consider subscribing to industry newsletters, following relevant companies and organizations, or regularly checking reputable industry news sources and publications.
Methodology
Step 1 - Identification of Relevant Samples Size from Population Database


Step 2 - Approaches for Defining Global Market Size (Value, Volume* & Price*)

Note*: In applicable scenarios
Step 3 - Data Sources
Primary Research
- Web Analytics
- Survey Reports
- Research Institute
- Latest Research Reports
- Opinion Leaders
Secondary Research
- Annual Reports
- White Paper
- Latest Press Release
- Industry Association
- Paid Database
- Investor Presentations

Step 4 - Data Triangulation
Involves using different sources of information in order to increase the validity of a study
These sources are likely to be stakeholders in a program - participants, other researchers, program staff, other community members, and so on.
Then we put all data in single framework & apply various statistical tools to find out the dynamic on the market.
During the analysis stage, feedback from the stakeholder groups would be compared to determine areas of agreement as well as areas of divergence