

Key Insights
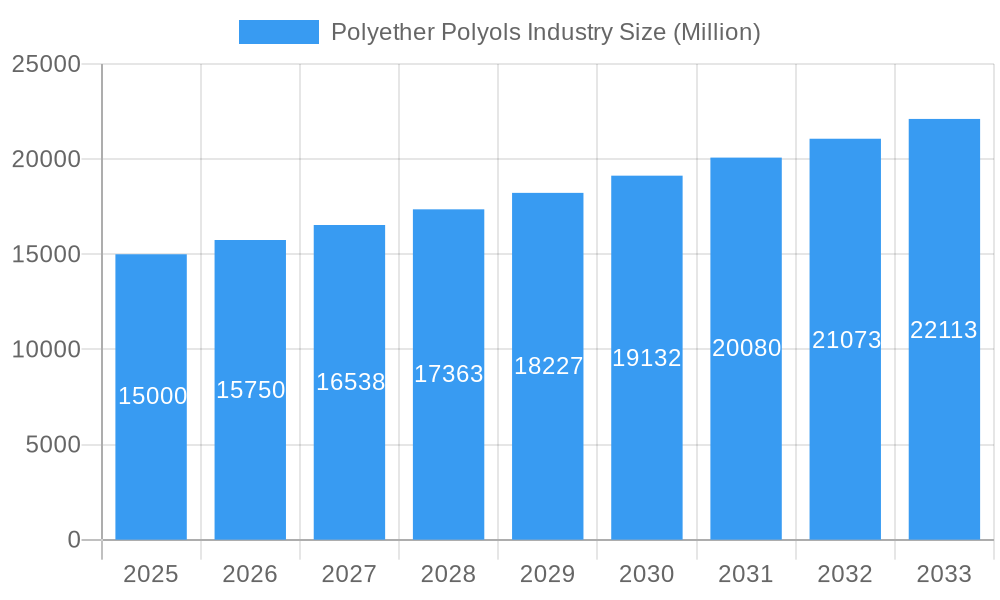
The global polyether polyols market is projected to reach $30 billion by 2033, exhibiting a Compound Annual Growth Rate (CAGR) of 5% from the base year 2025. This robust expansion is driven by key factors including the thriving construction industry, especially in emerging economies, necessitating polyether polyols for insulation and foam applications in furniture and bedding. The automotive sector's demand for lightweight, energy-efficient materials for seating and interiors also fuels growth. Technological innovations enhancing performance characteristics like flame retardancy and thermal insulation further contribute to market expansion. The market is segmented by polyol type (flexible, rigid, others) and end-user industry (furniture & bedding, construction, automotive, electrical & electronics, etc.). While the flexible segment leads in market share, the rigid segment is experiencing accelerated growth due to construction sector demand. The Asia-Pacific region, particularly China and India, demonstrates strong growth fueled by industrialization and urbanization. North America and Europe remain significant markets, albeit with moderated growth rates. Potential restraints include raw material price volatility and environmental concerns. Key market players like BASF, Dow, and Huntsman are focused on innovation, strategic partnerships, and global expansion.
Polyether Polyols Industry Market Size (In Billion)
The forecast period of 2025-2033 offers substantial growth opportunities. Advancements in formulation technologies will yield more sustainable, high-performance polyols, aligning with the demand for eco-friendly products. The increasing emphasis on energy efficiency and sustainable construction practices further bolsters market prospects. The automotive industry's transition to electric vehicles is anticipated to influence demand for polyether polyols in battery components and lightweight interiors. Companies will prioritize R&D for tailored solutions meeting diverse end-user needs. Strategic mergers, acquisitions, and regional expansion are expected to shape the competitive landscape.
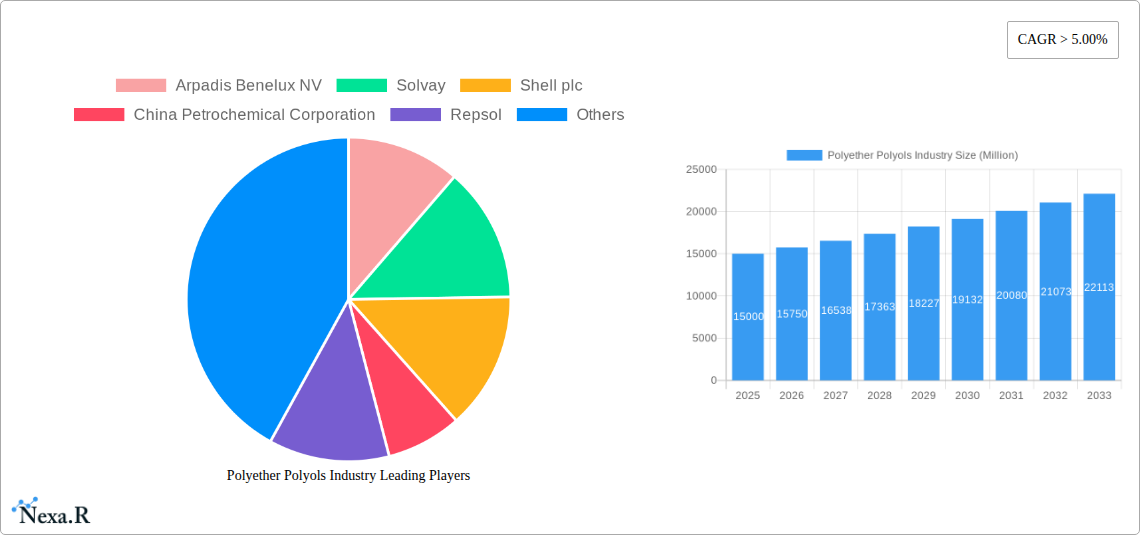
Polyether Polyols Industry Company Market Share
Polyether Polyols Industry Market Report: 2019-2033
This comprehensive report provides an in-depth analysis of the Polyether Polyols industry, encompassing market dynamics, growth trends, regional dominance, product landscape, key players, and future outlook. The study covers the period 2019-2033, with 2025 as the base year and forecasts extending to 2033. The report segments the market by type (flexible, rigid, other types) and end-user industry (furniture and bedding, construction, automotive, electrical and electronics, other end-user industries), offering a granular view of this vital chemical sector. The report is valued at xx Million units.
Polyether Polyols Industry Market Dynamics & Structure
This section analyzes the competitive landscape of the polyether polyols market, examining market concentration, technological advancements, regulatory influences, and industry trends. The report quantifies market share among key players and assesses the impact of mergers and acquisitions (M&A) activities. The market is characterized by a moderately concentrated structure, with several major players holding significant market share. The global market size was valued at xx Million units in 2024.
- Market Concentration: The top 10 players account for approximately xx% of the global market share in 2024.
- Technological Innovation: Continuous innovation in catalyst technology and process optimization drives efficiency and cost reductions. Bio-based polyols are emerging as a significant area of innovation.
- Regulatory Framework: Environmental regulations increasingly influence production processes, pushing for sustainable and eco-friendly solutions.
- Competitive Substitutes: Other polyol types and alternative materials compete with polyether polyols depending on the application.
- End-User Demographics: Growth is driven by increasing demand from the construction, automotive, and furniture industries.
- M&A Trends: Recent years have seen significant M&A activity, reflecting consolidation and expansion strategies among key players. The total value of M&A deals in the sector from 2019-2024 is estimated at xx Million units.
Polyether Polyols Industry Growth Trends & Insights
The global polyether polyols market is experiencing steady growth, driven by increasing demand across various end-use sectors. This section details market size evolution, adoption rates, technological disruptions, and shifting consumer preferences. Factors such as rising disposable incomes, urbanization, and infrastructure development contribute to the market's expansion. The market exhibited a CAGR of xx% during the historical period (2019-2024) and is projected to maintain a CAGR of xx% during the forecast period (2025-2033). Market penetration in key regions is analyzed, highlighting areas of high growth potential and saturation. Specific details on technological advancements such as the development of bio-based polyols and their impact on market adoption rates are included.
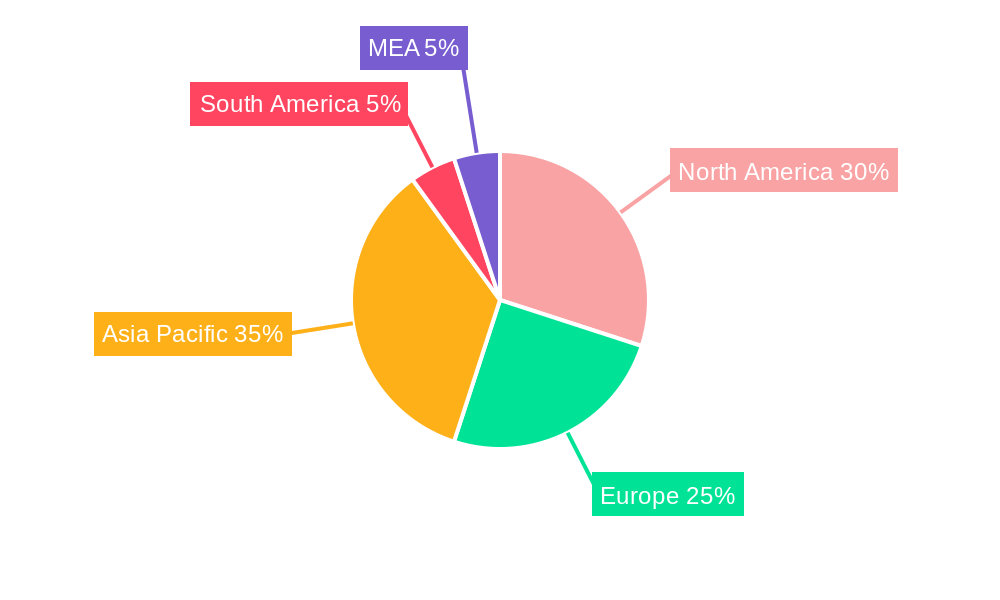
Dominant Regions, Countries, or Segments in Polyether Polyols Industry
This section identifies the leading regions, countries, and market segments driving growth. Asia-Pacific is projected to maintain its position as the dominant region, fueled by rapid industrialization and infrastructural development in countries like China and India. The construction industry is a key growth driver in this region. In terms of product type, flexible polyether polyols hold the largest market share due to their widespread application in various sectors.
- Asia-Pacific: Strong growth driven by robust construction, automotive, and furniture industries.
- North America: Mature market with stable growth driven by replacement demand and technological advancements.
- Europe: Growth is influenced by stringent environmental regulations and increasing adoption of sustainable materials.
- Flexible Polyols: Largest market share due to their versatility and wide range of applications.
- Construction Sector: Significant growth driver owing to increasing infrastructure development globally.
Polyether Polyols Industry Product Landscape
The polyether polyols market offers a diverse range of products tailored to specific applications. Innovations focus on improving properties such as flexibility, rigidity, and biodegradability. Advances in catalyst technology enable the production of polyols with enhanced performance characteristics and reduced environmental impact. Unique selling propositions include customized formulations to meet specific customer requirements and the development of sustainable, bio-based polyols.
Key Drivers, Barriers & Challenges in Polyether Polyols Industry
Key Drivers: Increasing demand from the construction, automotive, and furniture industries; technological advancements leading to improved product performance and cost efficiency; rising disposable incomes and urbanization; favorable government policies promoting infrastructure development.
Key Challenges: Fluctuations in raw material prices; stringent environmental regulations; intense competition among established players and emerging entrants; supply chain disruptions; geopolitical uncertainties. The impact of these challenges is quantified based on their potential to affect market growth in 2025 and beyond.
Emerging Opportunities in Polyether Polyols Industry
Emerging opportunities include the growing demand for bio-based and sustainable polyols; expansion into new applications in renewable energy and 3D printing; development of high-performance polyols for specialized applications in aerospace and medical devices; tapping into emerging markets in developing economies.
Growth Accelerators in the Polyether Polyols Industry
Long-term growth will be driven by the continuous innovation in catalyst technology and process optimization; strategic partnerships and collaborations to expand market reach and product offerings; investments in research and development to develop advanced polyols with improved properties; exploration of new applications and market segments; expansion into developing economies.
Key Players Shaping the Polyether Polyols Industry Market
- Arpadis Benelux NV
- Solvay
- Shell plc
- China Petrochemical Corporation
- Repsol
- BASF SE
- Huntsman International LLC
- Dow
- Covestro AG
- PCC Group
- Purinova Sp z o o
Notable Milestones in Polyether Polyols Industry Sector
- December 2021: PCC Group expands production capacity and product range, including biodegradable products.
- February 2021: Repsol licenses agreement to build propylene oxide (PO), styrene monomer (SM), and polyol plants in China (125,000 tonnes/year capacity).
- January 2021: Stepan Company acquires INVISTA's aromatic polyester polyol business.
In-Depth Polyether Polyols Industry Market Outlook
The polyether polyols market is poised for continued growth, driven by strong demand from key end-use sectors and ongoing innovation in product development and manufacturing processes. Strategic partnerships, expansion into emerging markets, and a focus on sustainability will be crucial for success. The market is expected to reach xx Million units by 2033, presenting significant opportunities for both established players and new entrants.
Polyether Polyols Industry Segmentation
-
1. Type
- 1.1. Flexible
- 1.2. Rigid
- 1.3. Other Types
-
2. End-user Industry
- 2.1. Furniture and Bedding
- 2.2. Construction
- 2.3. Automotive
- 2.4. Electrical and Electronics
- 2.5. Other End-user Industries
Polyether Polyols Industry Segmentation By Geography
-
1. Asia Pacific
- 1.1. China
- 1.2. India
- 1.3. Japan
- 1.4. South Korea
- 1.5. Rest of Asia Pacific
-
2. North America
- 2.1. United States
- 2.2. Canada
- 2.3. Mexico
-
3. Europe
- 3.1. Germany
- 3.2. United Kingdom
- 3.3. Italy
- 3.4. France
- 3.5. Rest of Europe
-
4. South America
- 4.1. Brazil
- 4.2. Argentina
- 4.3. Rest of South America
-
5. Middle East and Africa
- 5.1. Saudi Arabia
- 5.2. South Africa
- 5.3. Rest of Middle East and Africa
Polyether Polyols Industry Regional Market Share
Geographic Coverage of Polyether Polyols Industry
Polyether Polyols Industry REPORT HIGHLIGHTS
| Aspects | Details |
|---|---|
| Study Period | 2020-2034 |
| Base Year | 2025 |
| Estimated Year | 2026 |
| Forecast Period | 2026-2034 |
| Historical Period | 2020-2025 |
| Growth Rate | CAGR of 5% from 2020-2034 |
| Segmentation |
|
Table of Contents
- 1. Introduction
- 1.1. Research Scope
- 1.2. Market Segmentation
- 1.3. Research Objective
- 1.4. Definitions and Assumptions
- 2. Executive Summary
- 2.1. Market Snapshot
- 3. Market Dynamics
- 3.1. Market Drivers
- 3.2. Market Restrains
- 3.3. Market Trends
- 3.4. Market Opportunities
- 4. Market Factor Analysis
- 4.1. Porters Five Forces
- 4.1.1. Bargaining Power of Suppliers
- 4.1.2. Bargaining Power of Buyers
- 4.1.3. Threat of New Entrants
- 4.1.4. Threat of Substitutes
- 4.1.5. Competitive Rivalry
- 4.2. PESTEL analysis
- 4.3. BCG Analysis
- 4.3.1. Stars (High Growth, High Market Share)
- 4.3.2. Cash Cows (Low Growth, High Market Share)
- 4.3.3. Question Mark (High Growth, Low Market Share)
- 4.3.4. Dogs (Low Growth, Low Market Share)
- 4.4. Ansoff Matrix Analysis
- 4.5. Supply Chain Analysis
- 4.6. Regulatory Landscape
- 4.7. Current Market Potential and Opportunity Assessment (TAM–SAM–SOM Framework)
- 4.8. NRP Analyst Note
- 4.1. Porters Five Forces
- 5. Market Analysis, Insights and Forecast 2021-2033
- 5.1. Market Analysis, Insights and Forecast - by Type
- 5.1.1. Flexible
- 5.1.2. Rigid
- 5.1.3. Other Types
- 5.2. Market Analysis, Insights and Forecast - by End-user Industry
- 5.2.1. Furniture and Bedding
- 5.2.2. Construction
- 5.2.3. Automotive
- 5.2.4. Electrical and Electronics
- 5.2.5. Other End-user Industries
- 5.3. Market Analysis, Insights and Forecast - by Region
- 5.3.1. Asia Pacific
- 5.3.2. North America
- 5.3.3. Europe
- 5.3.4. South America
- 5.3.5. Middle East and Africa
- 5.1. Market Analysis, Insights and Forecast - by Type
- 6. Global Polyether Polyols Industry Analysis, Insights and Forecast, 2021-2033
- 6.1. Market Analysis, Insights and Forecast - by Type
- 6.1.1. Flexible
- 6.1.2. Rigid
- 6.1.3. Other Types
- 6.2. Market Analysis, Insights and Forecast - by End-user Industry
- 6.2.1. Furniture and Bedding
- 6.2.2. Construction
- 6.2.3. Automotive
- 6.2.4. Electrical and Electronics
- 6.2.5. Other End-user Industries
- 6.1. Market Analysis, Insights and Forecast - by Type
- 7. Asia Pacific Polyether Polyols Industry Analysis, Insights and Forecast, 2020-2032
- 7.1. Market Analysis, Insights and Forecast - by Type
- 7.1.1. Flexible
- 7.1.2. Rigid
- 7.1.3. Other Types
- 7.2. Market Analysis, Insights and Forecast - by End-user Industry
- 7.2.1. Furniture and Bedding
- 7.2.2. Construction
- 7.2.3. Automotive
- 7.2.4. Electrical and Electronics
- 7.2.5. Other End-user Industries
- 7.1. Market Analysis, Insights and Forecast - by Type
- 8. North America Polyether Polyols Industry Analysis, Insights and Forecast, 2020-2032
- 8.1. Market Analysis, Insights and Forecast - by Type
- 8.1.1. Flexible
- 8.1.2. Rigid
- 8.1.3. Other Types
- 8.2. Market Analysis, Insights and Forecast - by End-user Industry
- 8.2.1. Furniture and Bedding
- 8.2.2. Construction
- 8.2.3. Automotive
- 8.2.4. Electrical and Electronics
- 8.2.5. Other End-user Industries
- 8.1. Market Analysis, Insights and Forecast - by Type
- 9. Europe Polyether Polyols Industry Analysis, Insights and Forecast, 2020-2032
- 9.1. Market Analysis, Insights and Forecast - by Type
- 9.1.1. Flexible
- 9.1.2. Rigid
- 9.1.3. Other Types
- 9.2. Market Analysis, Insights and Forecast - by End-user Industry
- 9.2.1. Furniture and Bedding
- 9.2.2. Construction
- 9.2.3. Automotive
- 9.2.4. Electrical and Electronics
- 9.2.5. Other End-user Industries
- 9.1. Market Analysis, Insights and Forecast - by Type
- 10. South America Polyether Polyols Industry Analysis, Insights and Forecast, 2020-2032
- 10.1. Market Analysis, Insights and Forecast - by Type
- 10.1.1. Flexible
- 10.1.2. Rigid
- 10.1.3. Other Types
- 10.2. Market Analysis, Insights and Forecast - by End-user Industry
- 10.2.1. Furniture and Bedding
- 10.2.2. Construction
- 10.2.3. Automotive
- 10.2.4. Electrical and Electronics
- 10.2.5. Other End-user Industries
- 10.1. Market Analysis, Insights and Forecast - by Type
- 11. Middle East and Africa Polyether Polyols Industry Analysis, Insights and Forecast, 2020-2032
- 11.1. Market Analysis, Insights and Forecast - by Type
- 11.1.1. Flexible
- 11.1.2. Rigid
- 11.1.3. Other Types
- 11.2. Market Analysis, Insights and Forecast - by End-user Industry
- 11.2.1. Furniture and Bedding
- 11.2.2. Construction
- 11.2.3. Automotive
- 11.2.4. Electrical and Electronics
- 11.2.5. Other End-user Industries
- 11.1. Market Analysis, Insights and Forecast - by Type
- 12. Competitive Analysis
- 12.1. Company Profiles
- 12.1.1 Arpadis Benelux NV
- 12.1.1.1. Company Overview
- 12.1.1.2. Products
- 12.1.1.3. Company Financials
- 12.1.1.4. SWOT Analysis
- 12.1.2 Solvay
- 12.1.2.1. Company Overview
- 12.1.2.2. Products
- 12.1.2.3. Company Financials
- 12.1.2.4. SWOT Analysis
- 12.1.3 Shell plc
- 12.1.3.1. Company Overview
- 12.1.3.2. Products
- 12.1.3.3. Company Financials
- 12.1.3.4. SWOT Analysis
- 12.1.4 China Petrochemical Corporation
- 12.1.4.1. Company Overview
- 12.1.4.2. Products
- 12.1.4.3. Company Financials
- 12.1.4.4. SWOT Analysis
- 12.1.5 Repsol
- 12.1.5.1. Company Overview
- 12.1.5.2. Products
- 12.1.5.3. Company Financials
- 12.1.5.4. SWOT Analysis
- 12.1.6 BASF SE
- 12.1.6.1. Company Overview
- 12.1.6.2. Products
- 12.1.6.3. Company Financials
- 12.1.6.4. SWOT Analysis
- 12.1.7 Huntsman International LLC
- 12.1.7.1. Company Overview
- 12.1.7.2. Products
- 12.1.7.3. Company Financials
- 12.1.7.4. SWOT Analysis
- 12.1.8 Dow
- 12.1.8.1. Company Overview
- 12.1.8.2. Products
- 12.1.8.3. Company Financials
- 12.1.8.4. SWOT Analysis
- 12.1.9 Covestro AG
- 12.1.9.1. Company Overview
- 12.1.9.2. Products
- 12.1.9.3. Company Financials
- 12.1.9.4. SWOT Analysis
- 12.1.10 PCC Group
- 12.1.10.1. Company Overview
- 12.1.10.2. Products
- 12.1.10.3. Company Financials
- 12.1.10.4. SWOT Analysis
- 12.1.11 Purinova Sp z o o
- 12.1.11.1. Company Overview
- 12.1.11.2. Products
- 12.1.11.3. Company Financials
- 12.1.11.4. SWOT Analysis
- 12.1.1 Arpadis Benelux NV
- 12.2. Market Entropy
- 12.2.1 Company's Key Areas Served
- 12.2.2 Recent Developments
- 12.3. Company Market Share Analysis 2025
- 12.3.1 Top 5 Companies Market Share Analysis
- 12.3.2 Top 3 Companies Market Share Analysis
- 12.4. List of Potential Customers
- 13. Research Methodology
List of Figures
- Figure 1: Global Polyether Polyols Industry Revenue Breakdown (billion, %) by Region 2025 & 2033
- Figure 2: Global Polyether Polyols Industry Volume Breakdown (K Tons, %) by Region 2025 & 2033
- Figure 3: Asia Pacific Polyether Polyols Industry Revenue (billion), by Type 2025 & 2033
- Figure 4: Asia Pacific Polyether Polyols Industry Volume (K Tons), by Type 2025 & 2033
- Figure 5: Asia Pacific Polyether Polyols Industry Revenue Share (%), by Type 2025 & 2033
- Figure 6: Asia Pacific Polyether Polyols Industry Volume Share (%), by Type 2025 & 2033
- Figure 7: Asia Pacific Polyether Polyols Industry Revenue (billion), by End-user Industry 2025 & 2033
- Figure 8: Asia Pacific Polyether Polyols Industry Volume (K Tons), by End-user Industry 2025 & 2033
- Figure 9: Asia Pacific Polyether Polyols Industry Revenue Share (%), by End-user Industry 2025 & 2033
- Figure 10: Asia Pacific Polyether Polyols Industry Volume Share (%), by End-user Industry 2025 & 2033
- Figure 11: Asia Pacific Polyether Polyols Industry Revenue (billion), by Country 2025 & 2033
- Figure 12: Asia Pacific Polyether Polyols Industry Volume (K Tons), by Country 2025 & 2033
- Figure 13: Asia Pacific Polyether Polyols Industry Revenue Share (%), by Country 2025 & 2033
- Figure 14: Asia Pacific Polyether Polyols Industry Volume Share (%), by Country 2025 & 2033
- Figure 15: North America Polyether Polyols Industry Revenue (billion), by Type 2025 & 2033
- Figure 16: North America Polyether Polyols Industry Volume (K Tons), by Type 2025 & 2033
- Figure 17: North America Polyether Polyols Industry Revenue Share (%), by Type 2025 & 2033
- Figure 18: North America Polyether Polyols Industry Volume Share (%), by Type 2025 & 2033
- Figure 19: North America Polyether Polyols Industry Revenue (billion), by End-user Industry 2025 & 2033
- Figure 20: North America Polyether Polyols Industry Volume (K Tons), by End-user Industry 2025 & 2033
- Figure 21: North America Polyether Polyols Industry Revenue Share (%), by End-user Industry 2025 & 2033
- Figure 22: North America Polyether Polyols Industry Volume Share (%), by End-user Industry 2025 & 2033
- Figure 23: North America Polyether Polyols Industry Revenue (billion), by Country 2025 & 2033
- Figure 24: North America Polyether Polyols Industry Volume (K Tons), by Country 2025 & 2033
- Figure 25: North America Polyether Polyols Industry Revenue Share (%), by Country 2025 & 2033
- Figure 26: North America Polyether Polyols Industry Volume Share (%), by Country 2025 & 2033
- Figure 27: Europe Polyether Polyols Industry Revenue (billion), by Type 2025 & 2033
- Figure 28: Europe Polyether Polyols Industry Volume (K Tons), by Type 2025 & 2033
- Figure 29: Europe Polyether Polyols Industry Revenue Share (%), by Type 2025 & 2033
- Figure 30: Europe Polyether Polyols Industry Volume Share (%), by Type 2025 & 2033
- Figure 31: Europe Polyether Polyols Industry Revenue (billion), by End-user Industry 2025 & 2033
- Figure 32: Europe Polyether Polyols Industry Volume (K Tons), by End-user Industry 2025 & 2033
- Figure 33: Europe Polyether Polyols Industry Revenue Share (%), by End-user Industry 2025 & 2033
- Figure 34: Europe Polyether Polyols Industry Volume Share (%), by End-user Industry 2025 & 2033
- Figure 35: Europe Polyether Polyols Industry Revenue (billion), by Country 2025 & 2033
- Figure 36: Europe Polyether Polyols Industry Volume (K Tons), by Country 2025 & 2033
- Figure 37: Europe Polyether Polyols Industry Revenue Share (%), by Country 2025 & 2033
- Figure 38: Europe Polyether Polyols Industry Volume Share (%), by Country 2025 & 2033
- Figure 39: South America Polyether Polyols Industry Revenue (billion), by Type 2025 & 2033
- Figure 40: South America Polyether Polyols Industry Volume (K Tons), by Type 2025 & 2033
- Figure 41: South America Polyether Polyols Industry Revenue Share (%), by Type 2025 & 2033
- Figure 42: South America Polyether Polyols Industry Volume Share (%), by Type 2025 & 2033
- Figure 43: South America Polyether Polyols Industry Revenue (billion), by End-user Industry 2025 & 2033
- Figure 44: South America Polyether Polyols Industry Volume (K Tons), by End-user Industry 2025 & 2033
- Figure 45: South America Polyether Polyols Industry Revenue Share (%), by End-user Industry 2025 & 2033
- Figure 46: South America Polyether Polyols Industry Volume Share (%), by End-user Industry 2025 & 2033
- Figure 47: South America Polyether Polyols Industry Revenue (billion), by Country 2025 & 2033
- Figure 48: South America Polyether Polyols Industry Volume (K Tons), by Country 2025 & 2033
- Figure 49: South America Polyether Polyols Industry Revenue Share (%), by Country 2025 & 2033
- Figure 50: South America Polyether Polyols Industry Volume Share (%), by Country 2025 & 2033
- Figure 51: Middle East and Africa Polyether Polyols Industry Revenue (billion), by Type 2025 & 2033
- Figure 52: Middle East and Africa Polyether Polyols Industry Volume (K Tons), by Type 2025 & 2033
- Figure 53: Middle East and Africa Polyether Polyols Industry Revenue Share (%), by Type 2025 & 2033
- Figure 54: Middle East and Africa Polyether Polyols Industry Volume Share (%), by Type 2025 & 2033
- Figure 55: Middle East and Africa Polyether Polyols Industry Revenue (billion), by End-user Industry 2025 & 2033
- Figure 56: Middle East and Africa Polyether Polyols Industry Volume (K Tons), by End-user Industry 2025 & 2033
- Figure 57: Middle East and Africa Polyether Polyols Industry Revenue Share (%), by End-user Industry 2025 & 2033
- Figure 58: Middle East and Africa Polyether Polyols Industry Volume Share (%), by End-user Industry 2025 & 2033
- Figure 59: Middle East and Africa Polyether Polyols Industry Revenue (billion), by Country 2025 & 2033
- Figure 60: Middle East and Africa Polyether Polyols Industry Volume (K Tons), by Country 2025 & 2033
- Figure 61: Middle East and Africa Polyether Polyols Industry Revenue Share (%), by Country 2025 & 2033
- Figure 62: Middle East and Africa Polyether Polyols Industry Volume Share (%), by Country 2025 & 2033
List of Tables
- Table 1: Global Polyether Polyols Industry Revenue billion Forecast, by Type 2020 & 2033
- Table 2: Global Polyether Polyols Industry Volume K Tons Forecast, by Type 2020 & 2033
- Table 3: Global Polyether Polyols Industry Revenue billion Forecast, by End-user Industry 2020 & 2033
- Table 4: Global Polyether Polyols Industry Volume K Tons Forecast, by End-user Industry 2020 & 2033
- Table 5: Global Polyether Polyols Industry Revenue billion Forecast, by Region 2020 & 2033
- Table 6: Global Polyether Polyols Industry Volume K Tons Forecast, by Region 2020 & 2033
- Table 7: Global Polyether Polyols Industry Revenue billion Forecast, by Type 2020 & 2033
- Table 8: Global Polyether Polyols Industry Volume K Tons Forecast, by Type 2020 & 2033
- Table 9: Global Polyether Polyols Industry Revenue billion Forecast, by End-user Industry 2020 & 2033
- Table 10: Global Polyether Polyols Industry Volume K Tons Forecast, by End-user Industry 2020 & 2033
- Table 11: Global Polyether Polyols Industry Revenue billion Forecast, by Country 2020 & 2033
- Table 12: Global Polyether Polyols Industry Volume K Tons Forecast, by Country 2020 & 2033
- Table 13: China Polyether Polyols Industry Revenue (billion) Forecast, by Application 2020 & 2033
- Table 14: China Polyether Polyols Industry Volume (K Tons) Forecast, by Application 2020 & 2033
- Table 15: India Polyether Polyols Industry Revenue (billion) Forecast, by Application 2020 & 2033
- Table 16: India Polyether Polyols Industry Volume (K Tons) Forecast, by Application 2020 & 2033
- Table 17: Japan Polyether Polyols Industry Revenue (billion) Forecast, by Application 2020 & 2033
- Table 18: Japan Polyether Polyols Industry Volume (K Tons) Forecast, by Application 2020 & 2033
- Table 19: South Korea Polyether Polyols Industry Revenue (billion) Forecast, by Application 2020 & 2033
- Table 20: South Korea Polyether Polyols Industry Volume (K Tons) Forecast, by Application 2020 & 2033
- Table 21: Rest of Asia Pacific Polyether Polyols Industry Revenue (billion) Forecast, by Application 2020 & 2033
- Table 22: Rest of Asia Pacific Polyether Polyols Industry Volume (K Tons) Forecast, by Application 2020 & 2033
- Table 23: Global Polyether Polyols Industry Revenue billion Forecast, by Type 2020 & 2033
- Table 24: Global Polyether Polyols Industry Volume K Tons Forecast, by Type 2020 & 2033
- Table 25: Global Polyether Polyols Industry Revenue billion Forecast, by End-user Industry 2020 & 2033
- Table 26: Global Polyether Polyols Industry Volume K Tons Forecast, by End-user Industry 2020 & 2033
- Table 27: Global Polyether Polyols Industry Revenue billion Forecast, by Country 2020 & 2033
- Table 28: Global Polyether Polyols Industry Volume K Tons Forecast, by Country 2020 & 2033
- Table 29: United States Polyether Polyols Industry Revenue (billion) Forecast, by Application 2020 & 2033
- Table 30: United States Polyether Polyols Industry Volume (K Tons) Forecast, by Application 2020 & 2033
- Table 31: Canada Polyether Polyols Industry Revenue (billion) Forecast, by Application 2020 & 2033
- Table 32: Canada Polyether Polyols Industry Volume (K Tons) Forecast, by Application 2020 & 2033
- Table 33: Mexico Polyether Polyols Industry Revenue (billion) Forecast, by Application 2020 & 2033
- Table 34: Mexico Polyether Polyols Industry Volume (K Tons) Forecast, by Application 2020 & 2033
- Table 35: Global Polyether Polyols Industry Revenue billion Forecast, by Type 2020 & 2033
- Table 36: Global Polyether Polyols Industry Volume K Tons Forecast, by Type 2020 & 2033
- Table 37: Global Polyether Polyols Industry Revenue billion Forecast, by End-user Industry 2020 & 2033
- Table 38: Global Polyether Polyols Industry Volume K Tons Forecast, by End-user Industry 2020 & 2033
- Table 39: Global Polyether Polyols Industry Revenue billion Forecast, by Country 2020 & 2033
- Table 40: Global Polyether Polyols Industry Volume K Tons Forecast, by Country 2020 & 2033
- Table 41: Germany Polyether Polyols Industry Revenue (billion) Forecast, by Application 2020 & 2033
- Table 42: Germany Polyether Polyols Industry Volume (K Tons) Forecast, by Application 2020 & 2033
- Table 43: United Kingdom Polyether Polyols Industry Revenue (billion) Forecast, by Application 2020 & 2033
- Table 44: United Kingdom Polyether Polyols Industry Volume (K Tons) Forecast, by Application 2020 & 2033
- Table 45: Italy Polyether Polyols Industry Revenue (billion) Forecast, by Application 2020 & 2033
- Table 46: Italy Polyether Polyols Industry Volume (K Tons) Forecast, by Application 2020 & 2033
- Table 47: France Polyether Polyols Industry Revenue (billion) Forecast, by Application 2020 & 2033
- Table 48: France Polyether Polyols Industry Volume (K Tons) Forecast, by Application 2020 & 2033
- Table 49: Rest of Europe Polyether Polyols Industry Revenue (billion) Forecast, by Application 2020 & 2033
- Table 50: Rest of Europe Polyether Polyols Industry Volume (K Tons) Forecast, by Application 2020 & 2033
- Table 51: Global Polyether Polyols Industry Revenue billion Forecast, by Type 2020 & 2033
- Table 52: Global Polyether Polyols Industry Volume K Tons Forecast, by Type 2020 & 2033
- Table 53: Global Polyether Polyols Industry Revenue billion Forecast, by End-user Industry 2020 & 2033
- Table 54: Global Polyether Polyols Industry Volume K Tons Forecast, by End-user Industry 2020 & 2033
- Table 55: Global Polyether Polyols Industry Revenue billion Forecast, by Country 2020 & 2033
- Table 56: Global Polyether Polyols Industry Volume K Tons Forecast, by Country 2020 & 2033
- Table 57: Brazil Polyether Polyols Industry Revenue (billion) Forecast, by Application 2020 & 2033
- Table 58: Brazil Polyether Polyols Industry Volume (K Tons) Forecast, by Application 2020 & 2033
- Table 59: Argentina Polyether Polyols Industry Revenue (billion) Forecast, by Application 2020 & 2033
- Table 60: Argentina Polyether Polyols Industry Volume (K Tons) Forecast, by Application 2020 & 2033
- Table 61: Rest of South America Polyether Polyols Industry Revenue (billion) Forecast, by Application 2020 & 2033
- Table 62: Rest of South America Polyether Polyols Industry Volume (K Tons) Forecast, by Application 2020 & 2033
- Table 63: Global Polyether Polyols Industry Revenue billion Forecast, by Type 2020 & 2033
- Table 64: Global Polyether Polyols Industry Volume K Tons Forecast, by Type 2020 & 2033
- Table 65: Global Polyether Polyols Industry Revenue billion Forecast, by End-user Industry 2020 & 2033
- Table 66: Global Polyether Polyols Industry Volume K Tons Forecast, by End-user Industry 2020 & 2033
- Table 67: Global Polyether Polyols Industry Revenue billion Forecast, by Country 2020 & 2033
- Table 68: Global Polyether Polyols Industry Volume K Tons Forecast, by Country 2020 & 2033
- Table 69: Saudi Arabia Polyether Polyols Industry Revenue (billion) Forecast, by Application 2020 & 2033
- Table 70: Saudi Arabia Polyether Polyols Industry Volume (K Tons) Forecast, by Application 2020 & 2033
- Table 71: South Africa Polyether Polyols Industry Revenue (billion) Forecast, by Application 2020 & 2033
- Table 72: South Africa Polyether Polyols Industry Volume (K Tons) Forecast, by Application 2020 & 2033
- Table 73: Rest of Middle East and Africa Polyether Polyols Industry Revenue (billion) Forecast, by Application 2020 & 2033
- Table 74: Rest of Middle East and Africa Polyether Polyols Industry Volume (K Tons) Forecast, by Application 2020 & 2033
Frequently Asked Questions
1. What is the projected Compound Annual Growth Rate (CAGR) of the Polyether Polyols Industry?
The projected CAGR is approximately 5%.
2. Which companies are prominent players in the Polyether Polyols Industry?
Key companies in the market include Arpadis Benelux NV, Solvay, Shell plc, China Petrochemical Corporation, Repsol, BASF SE, Huntsman International LLC, Dow, Covestro AG, PCC Group, Purinova Sp z o o.
3. What are the main segments of the Polyether Polyols Industry?
The market segments include Type, End-user Industry.
4. Can you provide details about the market size?
The market size is estimated to be USD 30 billion as of 2022.
5. What are some drivers contributing to market growth?
Rising Demand for Flexible and Rigid Polyurethane Foam; Growth of Automotive Industry; Rising Demand from Construction Industry.
6. What are the notable trends driving market growth?
Rising Demand from Construction Industry.
7. Are there any restraints impacting market growth?
Volatile Prices of Raw Materials; Stringent Government Regulations on Polyurethane Foam Manufacturing.
8. Can you provide examples of recent developments in the market?
In December 2021, PCC Group has expanded its production capacity and the range of manufactured products. The installation is to produce a range of ethoxylates, polyether polyols, and other ethoxylated products, including biodegradable products.
9. What pricing options are available for accessing the report?
Pricing options include single-user, multi-user, and enterprise licenses priced at USD 4750, USD 5250, and USD 8750 respectively.
10. Is the market size provided in terms of value or volume?
The market size is provided in terms of value, measured in billion and volume, measured in K Tons.
11. Are there any specific market keywords associated with the report?
Yes, the market keyword associated with the report is "Polyether Polyols Industry," which aids in identifying and referencing the specific market segment covered.
12. How do I determine which pricing option suits my needs best?
The pricing options vary based on user requirements and access needs. Individual users may opt for single-user licenses, while businesses requiring broader access may choose multi-user or enterprise licenses for cost-effective access to the report.
13. Are there any additional resources or data provided in the Polyether Polyols Industry report?
While the report offers comprehensive insights, it's advisable to review the specific contents or supplementary materials provided to ascertain if additional resources or data are available.
14. How can I stay updated on further developments or reports in the Polyether Polyols Industry?
To stay informed about further developments, trends, and reports in the Polyether Polyols Industry, consider subscribing to industry newsletters, following relevant companies and organizations, or regularly checking reputable industry news sources and publications.
Methodology
Step 1 - Identification of Relevant Samples Size from Population Database


Step 2 - Approaches for Defining Global Market Size (Value, Volume* & Price*)

Note*: In applicable scenarios
Step 3 - Data Sources
Primary Research
- Web Analytics
- Survey Reports
- Research Institute
- Latest Research Reports
- Opinion Leaders
Secondary Research
- Annual Reports
- White Paper
- Latest Press Release
- Industry Association
- Paid Database
- Investor Presentations

Step 4 - Data Triangulation
Involves using different sources of information in order to increase the validity of a study
These sources are likely to be stakeholders in a program - participants, other researchers, program staff, other community members, and so on.
Then we put all data in single framework & apply various statistical tools to find out the dynamic on the market.
During the analysis stage, feedback from the stakeholder groups would be compared to determine areas of agreement as well as areas of divergence