

Key Insights
The global polystyrene (PS) market, valued at approximately $50.99 billion in 2025, is projected for robust expansion with a Compound Annual Growth Rate (CAGR) of 4.6% from 2025 to 2033. Key growth drivers include the escalating demand within the packaging sector, particularly for food and consumer goods, where PS's lightweight, adaptable, and cost-effective properties are highly valued. The construction industry also contributes significantly, utilizing PS foams for insulation and other building applications. Advancements in PS formulations, enhancing properties like impact resistance (HIPS) and thermal insulation (EPS), further stimulate market growth. However, environmental concerns surrounding PS's non-biodegradability and rising recycling costs present challenges, prompting a shift towards sustainable alternatives and driving innovation in PS recycling technologies. The market is segmented by resin type (GPPS, HIPS, EPS), form type (foams, films, sheets, injection molding), and end-user industry (packaging, building & construction, electrical & electronics, consumer goods). Asia Pacific, led by China and India, holds a substantial market share owing to rapid economic growth and heightened consumption, while North America and Europe maintain significant positions due to established manufacturing bases and consistent demand.
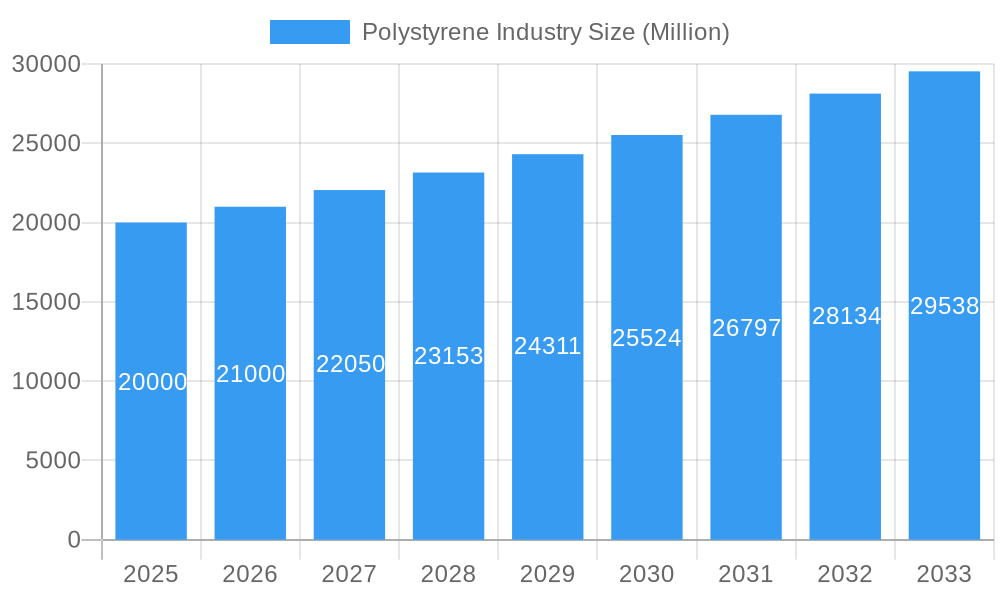
Polystyrene Industry Market Size (In Billion)
The competitive landscape features major multinational corporations such as BASF, INEOS Styrolution, and SABIC, alongside key regional players. These entities are actively pursuing strategic partnerships, mergers and acquisitions, and capacity expansions to solidify their market standing. The market outlook remains favorable, contingent upon addressing environmental concerns through enhanced recycling technologies and the development of biodegradable PS alternatives. The growing demand for sustainable packaging solutions will profoundly influence market dynamics, compelling industry participants to prioritize eco-friendly production and product offerings. Market segmentation analysis confirms packaging as the leading end-use sector, followed by building and construction, both expected to fuel significant polystyrene market expansion throughout the forecast period.
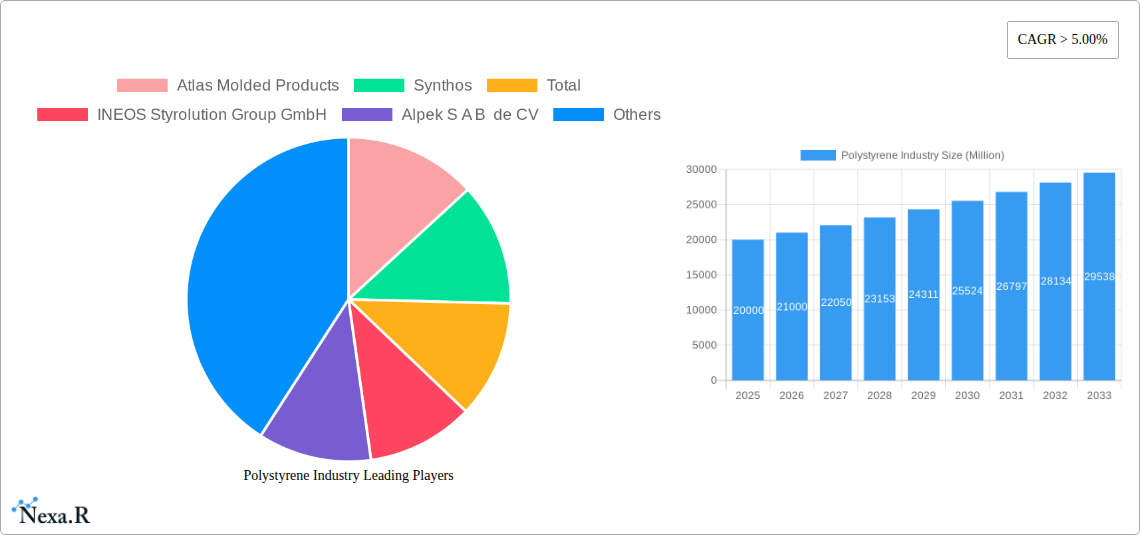
Polystyrene Industry Company Market Share
Polystyrene Industry Market Report: 2019-2033
This comprehensive report provides an in-depth analysis of the Polystyrene industry, encompassing market dynamics, growth trends, regional segmentation, product landscape, and key players. The study period covers 2019-2033, with 2025 as the base and estimated year. This report is essential for industry professionals, investors, and stakeholders seeking a comprehensive understanding of this dynamic market. The report's detailed analysis, including quantitative data and qualitative insights, empowers informed decision-making and strategic planning within the Polystyrene sector and its parent and child markets.
Keywords: Polystyrene, GPPS, HIPS, EPS, Foams, Films, Sheets, Injection Molding, Packaging, Building & Construction, Electrical & Electronics, Consumer Goods, Atlas Molded Products, Synthos, Total, INEOS Styrolution, Alpek, Versalis, KUMHO PETROCHEMICAL, CHIMEI, BASF, SABIC, Trinseo, LG Chem, Innova, AmSty, Formosa Chemicals, Market Size, Market Share, CAGR, Market Growth, Industry Analysis, Competitive Landscape, Market Forecast.
Polystyrene Industry Market Dynamics & Structure
The Polystyrene market is characterized by a moderately concentrated structure with key players like INEOS Styrolution, BASF, SABIC, and Total holding significant market share. Market concentration is estimated to be around xx% in 2025. Technological innovation, driven by the need for sustainable and high-performance materials, is a major driver. Stringent environmental regulations, particularly concerning plastic waste, are shaping the industry landscape, pushing innovation towards recycled and bio-based Polystyrene. The market witnesses continuous M&A activity as companies seek to expand their market reach and product portfolios. The volume of M&A deals in the last five years is estimated to be xx. Competitive substitutes like other plastics and bioplastics present challenges, particularly in packaging applications.
- Market Concentration: xx% in 2025 (estimated)
- Key Innovation Drivers: Sustainability, Performance Enhancement
- Regulatory Landscape: Increasingly stringent environmental regulations
- Competitive Substitutes: Bioplastics, other plastics
- M&A Activity: xx deals in the last 5 years (estimated)
- End-User Demographics: Shifting consumer preferences towards sustainable products
Polystyrene Industry Growth Trends & Insights
The global Polystyrene market experienced significant growth during the historical period (2019-2024), driven by robust demand from packaging, building and construction, and consumer goods sectors. The market size reached xx Million units in 2024. The adoption rate of Polystyrene in various applications has been consistently high, fueled by its versatility, cost-effectiveness, and ease of processing. However, growing environmental concerns regarding plastic waste are impacting growth, leading to increased focus on recycling and the development of bio-based alternatives. Technological advancements in polymer chemistry and processing techniques are further shaping the market. Consumer behavior is increasingly shifting towards sustainable products, impacting demand for recycled and bio-attributed Polystyrene. The market is expected to exhibit a CAGR of xx% during the forecast period (2025-2033), reaching xx Million units by 2033. Market penetration in emerging economies is expected to drive this growth.
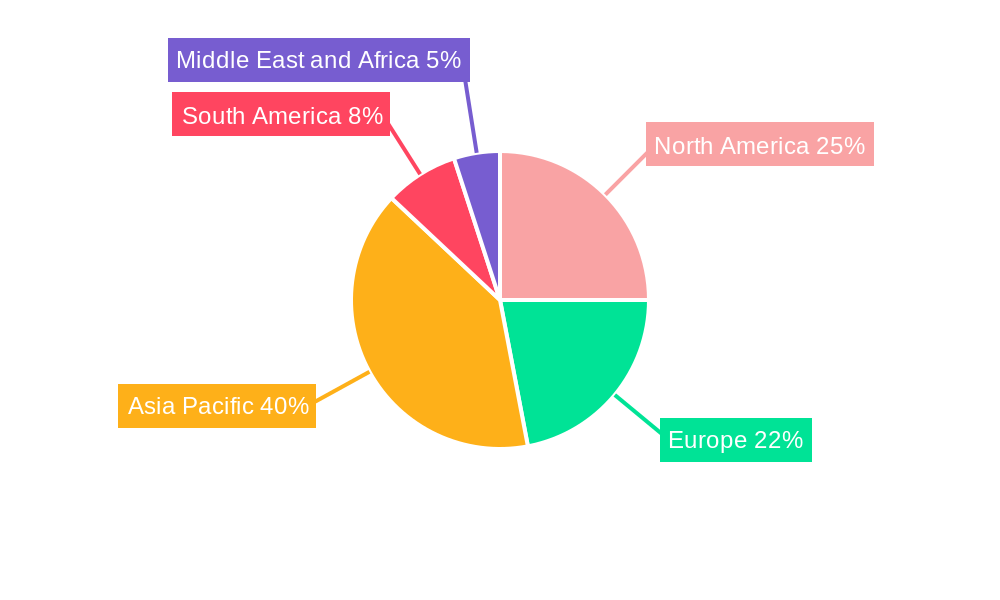
Dominant Regions, Countries, or Segments in Polystyrene Industry
The Asia-Pacific region dominated the Polystyrene market in 2024, accounting for approximately xx% of the global market share, driven by rapid economic growth, increasing infrastructure development, and rising consumption in countries like China and India. Within the product segments, Expandable Polystyrene (EPS) and High Impact Polystyrene (HIPS) showed robust growth, driven by high demand in packaging and construction. Injection molding remains the dominant form type, capturing a significant market share.
- Leading Region: Asia-Pacific (xx% market share in 2024)
- Key Growth Drivers:
- Rapid economic growth in developing countries
- Increasing infrastructure development
- High demand from Packaging and Building & Construction sectors.
- Dominant Segments:
- Resin Type: HIPS and EPS
- Form Type: Injection Molding
- Growth Potential: High in emerging economies
Polystyrene Industry Product Landscape
The Polystyrene product landscape is evolving with a focus on sustainable and high-performance materials. Innovations include bio-attributed Polystyrene from renewable sources and enhanced recycling solutions. These advancements are addressing environmental concerns and expanding application possibilities. Product differentiation is driven by improved impact resistance, thermal properties, and barrier characteristics. Unique selling propositions include lightweight design, cost-effectiveness, and versatile processing capabilities.
Key Drivers, Barriers & Challenges in Polystyrene Industry
Key Drivers:
- Growing demand from packaging and construction sectors
- Increasing disposable income in emerging economies
- Technological advancements leading to enhanced product performance
Key Challenges:
- Environmental concerns related to plastic waste (xx% reduction target by 2030 in some regions)
- Fluctuating raw material prices (estimated xx% price volatility in 2024)
- Stringent environmental regulations impacting production
Emerging Opportunities in Polystyrene Industry
- Growing demand for sustainable and recyclable Polystyrene
- Expanding applications in medical and healthcare industries
- Increased use in advanced packaging solutions
Growth Accelerators in the Polystyrene Industry
Technological breakthroughs in bio-based Polystyrene and advanced recycling technologies are driving significant long-term growth. Strategic partnerships between manufacturers and recyclers are enhancing the circularity of the Polystyrene value chain. Market expansion strategies focused on emerging economies are further fueling growth.
Key Players Shaping the Polystyrene Industry Market
- Atlas Molded Products
- Synthos
- TotalEnergies
- INEOS Styrolution Group GmbH
- Alpek S.A.B. de C.V.
- Versalis SpA
- KUMHO PETROCHEMICAL
- CHIMEI
- BASF SE
- SABIC
- Trinseo
- LG Chem
- Innova
- Americas Styrenics LLC (AmSty)
- Formosa Chemicals & Fibre Corp
Notable Milestones in Polystyrene Industry Sector
- September 2022: INEOS Styrolution introduced bio-attributed polystyrene and recycling solutions.
- April 2022: SABIC announced the manufacturing of circular polymers in Europe.
In-Depth Polystyrene Industry Market Outlook
The Polystyrene industry is poised for continued growth, driven by innovation in sustainable materials and expanding applications. Strategic opportunities lie in developing and commercializing bio-based and recycled Polystyrene, strengthening supply chain resilience, and expanding into high-growth markets. The focus on circular economy principles and sustainable practices will be crucial for long-term success in this dynamic market.
Polystyrene Industry Segmentation
-
1. Resin Type
- 1.1. General Purpose Polystyrene (GPPS)
- 1.2. High Impact Polystyrene (HIPS)
- 1.3. Expandable Polystyrene (EPS)
-
2. Form Type
- 2.1. Foams
- 2.2. Films and Sheets
- 2.3. Injection Molding
- 2.4. Other Form Types
-
3. End-user Industry
- 3.1. Packaging
- 3.2. Building and Construction
- 3.3. Electrical and Electronics
- 3.4. Consumer Goods
- 3.5. Other End-user Industries
Polystyrene Industry Segmentation By Geography
-
1. Asia Pacific
- 1.1. China
- 1.2. India
- 1.3. Japan
- 1.4. South Korea
- 1.5. Rest of Asia Pacific
-
2. North America
- 2.1. United States
- 2.2. Canada
- 2.3. Mexico
-
3. Europe
- 3.1. Germany
- 3.2. United Kingdom
- 3.3. France
- 3.4. Italy
- 3.5. Spain
- 3.6. Rest of Europe
-
4. South America
- 4.1. Brazil
- 4.2. Argentina
- 4.3. Rest of South America
-
5. Middle East and Africa
- 5.1. Saudi Arabia
- 5.2. South Africa
- 5.3. UAE
- 5.4. Rest of Middle East and Africa
Polystyrene Industry Regional Market Share
Geographic Coverage of Polystyrene Industry
Polystyrene Industry REPORT HIGHLIGHTS
| Aspects | Details |
|---|---|
| Study Period | 2020-2034 |
| Base Year | 2025 |
| Estimated Year | 2026 |
| Forecast Period | 2026-2034 |
| Historical Period | 2020-2025 |
| Growth Rate | CAGR of 4.6% from 2020-2034 |
| Segmentation |
|
Table of Contents
- 1. Introduction
- 1.1. Research Scope
- 1.2. Market Segmentation
- 1.3. Research Methodology
- 1.4. Definitions and Assumptions
- 2. Executive Summary
- 2.1. Introduction
- 3. Market Dynamics
- 3.1. Introduction
- 3.2. Market Drivers
- 3.2.1. Recycling in the Polystyrene Industry; Growing Consumer Electronics Market
- 3.3. Market Restrains
- 3.3.1. Increasing Ban on Polystyrene across North America and Europe; Availability of High-performance Substitutes
- 3.4. Market Trends
- 3.4.1. High Impact Polystyrene (HIPS) Type to Dominate the Market
- 4. Market Factor Analysis
- 4.1. Porters Five Forces
- 4.2. Supply/Value Chain
- 4.3. PESTEL analysis
- 4.4. Market Entropy
- 4.5. Patent/Trademark Analysis
- 5. Global Polystyrene Industry Analysis, Insights and Forecast, 2020-2032
- 5.1. Market Analysis, Insights and Forecast - by Resin Type
- 5.1.1. General Purpose Polystyrene (GPPS)
- 5.1.2. High Impact Polystyrene (HIPS)
- 5.1.3. Expandable Polystyrene (EPS)
- 5.2. Market Analysis, Insights and Forecast - by Form Type
- 5.2.1. Foams
- 5.2.2. Films and Sheets
- 5.2.3. Injection Molding
- 5.2.4. Other Form Types
- 5.3. Market Analysis, Insights and Forecast - by End-user Industry
- 5.3.1. Packaging
- 5.3.2. Building and Construction
- 5.3.3. Electrical and Electronics
- 5.3.4. Consumer Goods
- 5.3.5. Other End-user Industries
- 5.4. Market Analysis, Insights and Forecast - by Region
- 5.4.1. Asia Pacific
- 5.4.2. North America
- 5.4.3. Europe
- 5.4.4. South America
- 5.4.5. Middle East and Africa
- 5.1. Market Analysis, Insights and Forecast - by Resin Type
- 6. Asia Pacific Polystyrene Industry Analysis, Insights and Forecast, 2020-2032
- 6.1. Market Analysis, Insights and Forecast - by Resin Type
- 6.1.1. General Purpose Polystyrene (GPPS)
- 6.1.2. High Impact Polystyrene (HIPS)
- 6.1.3. Expandable Polystyrene (EPS)
- 6.2. Market Analysis, Insights and Forecast - by Form Type
- 6.2.1. Foams
- 6.2.2. Films and Sheets
- 6.2.3. Injection Molding
- 6.2.4. Other Form Types
- 6.3. Market Analysis, Insights and Forecast - by End-user Industry
- 6.3.1. Packaging
- 6.3.2. Building and Construction
- 6.3.3. Electrical and Electronics
- 6.3.4. Consumer Goods
- 6.3.5. Other End-user Industries
- 6.1. Market Analysis, Insights and Forecast - by Resin Type
- 7. North America Polystyrene Industry Analysis, Insights and Forecast, 2020-2032
- 7.1. Market Analysis, Insights and Forecast - by Resin Type
- 7.1.1. General Purpose Polystyrene (GPPS)
- 7.1.2. High Impact Polystyrene (HIPS)
- 7.1.3. Expandable Polystyrene (EPS)
- 7.2. Market Analysis, Insights and Forecast - by Form Type
- 7.2.1. Foams
- 7.2.2. Films and Sheets
- 7.2.3. Injection Molding
- 7.2.4. Other Form Types
- 7.3. Market Analysis, Insights and Forecast - by End-user Industry
- 7.3.1. Packaging
- 7.3.2. Building and Construction
- 7.3.3. Electrical and Electronics
- 7.3.4. Consumer Goods
- 7.3.5. Other End-user Industries
- 7.1. Market Analysis, Insights and Forecast - by Resin Type
- 8. Europe Polystyrene Industry Analysis, Insights and Forecast, 2020-2032
- 8.1. Market Analysis, Insights and Forecast - by Resin Type
- 8.1.1. General Purpose Polystyrene (GPPS)
- 8.1.2. High Impact Polystyrene (HIPS)
- 8.1.3. Expandable Polystyrene (EPS)
- 8.2. Market Analysis, Insights and Forecast - by Form Type
- 8.2.1. Foams
- 8.2.2. Films and Sheets
- 8.2.3. Injection Molding
- 8.2.4. Other Form Types
- 8.3. Market Analysis, Insights and Forecast - by End-user Industry
- 8.3.1. Packaging
- 8.3.2. Building and Construction
- 8.3.3. Electrical and Electronics
- 8.3.4. Consumer Goods
- 8.3.5. Other End-user Industries
- 8.1. Market Analysis, Insights and Forecast - by Resin Type
- 9. South America Polystyrene Industry Analysis, Insights and Forecast, 2020-2032
- 9.1. Market Analysis, Insights and Forecast - by Resin Type
- 9.1.1. General Purpose Polystyrene (GPPS)
- 9.1.2. High Impact Polystyrene (HIPS)
- 9.1.3. Expandable Polystyrene (EPS)
- 9.2. Market Analysis, Insights and Forecast - by Form Type
- 9.2.1. Foams
- 9.2.2. Films and Sheets
- 9.2.3. Injection Molding
- 9.2.4. Other Form Types
- 9.3. Market Analysis, Insights and Forecast - by End-user Industry
- 9.3.1. Packaging
- 9.3.2. Building and Construction
- 9.3.3. Electrical and Electronics
- 9.3.4. Consumer Goods
- 9.3.5. Other End-user Industries
- 9.1. Market Analysis, Insights and Forecast - by Resin Type
- 10. Middle East and Africa Polystyrene Industry Analysis, Insights and Forecast, 2020-2032
- 10.1. Market Analysis, Insights and Forecast - by Resin Type
- 10.1.1. General Purpose Polystyrene (GPPS)
- 10.1.2. High Impact Polystyrene (HIPS)
- 10.1.3. Expandable Polystyrene (EPS)
- 10.2. Market Analysis, Insights and Forecast - by Form Type
- 10.2.1. Foams
- 10.2.2. Films and Sheets
- 10.2.3. Injection Molding
- 10.2.4. Other Form Types
- 10.3. Market Analysis, Insights and Forecast - by End-user Industry
- 10.3.1. Packaging
- 10.3.2. Building and Construction
- 10.3.3. Electrical and Electronics
- 10.3.4. Consumer Goods
- 10.3.5. Other End-user Industries
- 10.1. Market Analysis, Insights and Forecast - by Resin Type
- 11. Competitive Analysis
- 11.1. Global Market Share Analysis 2025
- 11.2. Company Profiles
- 11.2.1 Atlas Molded Products
- 11.2.1.1. Overview
- 11.2.1.2. Products
- 11.2.1.3. SWOT Analysis
- 11.2.1.4. Recent Developments
- 11.2.1.5. Financials (Based on Availability)
- 11.2.2 Synthos
- 11.2.2.1. Overview
- 11.2.2.2. Products
- 11.2.2.3. SWOT Analysis
- 11.2.2.4. Recent Developments
- 11.2.2.5. Financials (Based on Availability)
- 11.2.3 Total
- 11.2.3.1. Overview
- 11.2.3.2. Products
- 11.2.3.3. SWOT Analysis
- 11.2.3.4. Recent Developments
- 11.2.3.5. Financials (Based on Availability)
- 11.2.4 INEOS Styrolution Group GmbH
- 11.2.4.1. Overview
- 11.2.4.2. Products
- 11.2.4.3. SWOT Analysis
- 11.2.4.4. Recent Developments
- 11.2.4.5. Financials (Based on Availability)
- 11.2.5 Alpek S A B de CV
- 11.2.5.1. Overview
- 11.2.5.2. Products
- 11.2.5.3. SWOT Analysis
- 11.2.5.4. Recent Developments
- 11.2.5.5. Financials (Based on Availability)
- 11.2.6 Versalis SpA
- 11.2.6.1. Overview
- 11.2.6.2. Products
- 11.2.6.3. SWOT Analysis
- 11.2.6.4. Recent Developments
- 11.2.6.5. Financials (Based on Availability)
- 11.2.7 KUMHO PETROCHEMICAL
- 11.2.7.1. Overview
- 11.2.7.2. Products
- 11.2.7.3. SWOT Analysis
- 11.2.7.4. Recent Developments
- 11.2.7.5. Financials (Based on Availability)
- 11.2.8 CHIMEI
- 11.2.8.1. Overview
- 11.2.8.2. Products
- 11.2.8.3. SWOT Analysis
- 11.2.8.4. Recent Developments
- 11.2.8.5. Financials (Based on Availability)
- 11.2.9 BASF SE
- 11.2.9.1. Overview
- 11.2.9.2. Products
- 11.2.9.3. SWOT Analysis
- 11.2.9.4. Recent Developments
- 11.2.9.5. Financials (Based on Availability)
- 11.2.10 SABIC
- 11.2.10.1. Overview
- 11.2.10.2. Products
- 11.2.10.3. SWOT Analysis
- 11.2.10.4. Recent Developments
- 11.2.10.5. Financials (Based on Availability)
- 11.2.11 Trinseo
- 11.2.11.1. Overview
- 11.2.11.2. Products
- 11.2.11.3. SWOT Analysis
- 11.2.11.4. Recent Developments
- 11.2.11.5. Financials (Based on Availability)
- 11.2.12 LG Chem
- 11.2.12.1. Overview
- 11.2.12.2. Products
- 11.2.12.3. SWOT Analysis
- 11.2.12.4. Recent Developments
- 11.2.12.5. Financials (Based on Availability)
- 11.2.13 Innova
- 11.2.13.1. Overview
- 11.2.13.2. Products
- 11.2.13.3. SWOT Analysis
- 11.2.13.4. Recent Developments
- 11.2.13.5. Financials (Based on Availability)
- 11.2.14 Americas Styrenics LLC (AmSty)
- 11.2.14.1. Overview
- 11.2.14.2. Products
- 11.2.14.3. SWOT Analysis
- 11.2.14.4. Recent Developments
- 11.2.14.5. Financials (Based on Availability)
- 11.2.15 Formosa Chemicals & Fibre Corp
- 11.2.15.1. Overview
- 11.2.15.2. Products
- 11.2.15.3. SWOT Analysis
- 11.2.15.4. Recent Developments
- 11.2.15.5. Financials (Based on Availability)
- 11.2.1 Atlas Molded Products
List of Figures
- Figure 1: Global Polystyrene Industry Revenue Breakdown (billion, %) by Region 2025 & 2033
- Figure 2: Global Polystyrene Industry Volume Breakdown (K Tons, %) by Region 2025 & 2033
- Figure 3: Asia Pacific Polystyrene Industry Revenue (billion), by Resin Type 2025 & 2033
- Figure 4: Asia Pacific Polystyrene Industry Volume (K Tons), by Resin Type 2025 & 2033
- Figure 5: Asia Pacific Polystyrene Industry Revenue Share (%), by Resin Type 2025 & 2033
- Figure 6: Asia Pacific Polystyrene Industry Volume Share (%), by Resin Type 2025 & 2033
- Figure 7: Asia Pacific Polystyrene Industry Revenue (billion), by Form Type 2025 & 2033
- Figure 8: Asia Pacific Polystyrene Industry Volume (K Tons), by Form Type 2025 & 2033
- Figure 9: Asia Pacific Polystyrene Industry Revenue Share (%), by Form Type 2025 & 2033
- Figure 10: Asia Pacific Polystyrene Industry Volume Share (%), by Form Type 2025 & 2033
- Figure 11: Asia Pacific Polystyrene Industry Revenue (billion), by End-user Industry 2025 & 2033
- Figure 12: Asia Pacific Polystyrene Industry Volume (K Tons), by End-user Industry 2025 & 2033
- Figure 13: Asia Pacific Polystyrene Industry Revenue Share (%), by End-user Industry 2025 & 2033
- Figure 14: Asia Pacific Polystyrene Industry Volume Share (%), by End-user Industry 2025 & 2033
- Figure 15: Asia Pacific Polystyrene Industry Revenue (billion), by Country 2025 & 2033
- Figure 16: Asia Pacific Polystyrene Industry Volume (K Tons), by Country 2025 & 2033
- Figure 17: Asia Pacific Polystyrene Industry Revenue Share (%), by Country 2025 & 2033
- Figure 18: Asia Pacific Polystyrene Industry Volume Share (%), by Country 2025 & 2033
- Figure 19: North America Polystyrene Industry Revenue (billion), by Resin Type 2025 & 2033
- Figure 20: North America Polystyrene Industry Volume (K Tons), by Resin Type 2025 & 2033
- Figure 21: North America Polystyrene Industry Revenue Share (%), by Resin Type 2025 & 2033
- Figure 22: North America Polystyrene Industry Volume Share (%), by Resin Type 2025 & 2033
- Figure 23: North America Polystyrene Industry Revenue (billion), by Form Type 2025 & 2033
- Figure 24: North America Polystyrene Industry Volume (K Tons), by Form Type 2025 & 2033
- Figure 25: North America Polystyrene Industry Revenue Share (%), by Form Type 2025 & 2033
- Figure 26: North America Polystyrene Industry Volume Share (%), by Form Type 2025 & 2033
- Figure 27: North America Polystyrene Industry Revenue (billion), by End-user Industry 2025 & 2033
- Figure 28: North America Polystyrene Industry Volume (K Tons), by End-user Industry 2025 & 2033
- Figure 29: North America Polystyrene Industry Revenue Share (%), by End-user Industry 2025 & 2033
- Figure 30: North America Polystyrene Industry Volume Share (%), by End-user Industry 2025 & 2033
- Figure 31: North America Polystyrene Industry Revenue (billion), by Country 2025 & 2033
- Figure 32: North America Polystyrene Industry Volume (K Tons), by Country 2025 & 2033
- Figure 33: North America Polystyrene Industry Revenue Share (%), by Country 2025 & 2033
- Figure 34: North America Polystyrene Industry Volume Share (%), by Country 2025 & 2033
- Figure 35: Europe Polystyrene Industry Revenue (billion), by Resin Type 2025 & 2033
- Figure 36: Europe Polystyrene Industry Volume (K Tons), by Resin Type 2025 & 2033
- Figure 37: Europe Polystyrene Industry Revenue Share (%), by Resin Type 2025 & 2033
- Figure 38: Europe Polystyrene Industry Volume Share (%), by Resin Type 2025 & 2033
- Figure 39: Europe Polystyrene Industry Revenue (billion), by Form Type 2025 & 2033
- Figure 40: Europe Polystyrene Industry Volume (K Tons), by Form Type 2025 & 2033
- Figure 41: Europe Polystyrene Industry Revenue Share (%), by Form Type 2025 & 2033
- Figure 42: Europe Polystyrene Industry Volume Share (%), by Form Type 2025 & 2033
- Figure 43: Europe Polystyrene Industry Revenue (billion), by End-user Industry 2025 & 2033
- Figure 44: Europe Polystyrene Industry Volume (K Tons), by End-user Industry 2025 & 2033
- Figure 45: Europe Polystyrene Industry Revenue Share (%), by End-user Industry 2025 & 2033
- Figure 46: Europe Polystyrene Industry Volume Share (%), by End-user Industry 2025 & 2033
- Figure 47: Europe Polystyrene Industry Revenue (billion), by Country 2025 & 2033
- Figure 48: Europe Polystyrene Industry Volume (K Tons), by Country 2025 & 2033
- Figure 49: Europe Polystyrene Industry Revenue Share (%), by Country 2025 & 2033
- Figure 50: Europe Polystyrene Industry Volume Share (%), by Country 2025 & 2033
- Figure 51: South America Polystyrene Industry Revenue (billion), by Resin Type 2025 & 2033
- Figure 52: South America Polystyrene Industry Volume (K Tons), by Resin Type 2025 & 2033
- Figure 53: South America Polystyrene Industry Revenue Share (%), by Resin Type 2025 & 2033
- Figure 54: South America Polystyrene Industry Volume Share (%), by Resin Type 2025 & 2033
- Figure 55: South America Polystyrene Industry Revenue (billion), by Form Type 2025 & 2033
- Figure 56: South America Polystyrene Industry Volume (K Tons), by Form Type 2025 & 2033
- Figure 57: South America Polystyrene Industry Revenue Share (%), by Form Type 2025 & 2033
- Figure 58: South America Polystyrene Industry Volume Share (%), by Form Type 2025 & 2033
- Figure 59: South America Polystyrene Industry Revenue (billion), by End-user Industry 2025 & 2033
- Figure 60: South America Polystyrene Industry Volume (K Tons), by End-user Industry 2025 & 2033
- Figure 61: South America Polystyrene Industry Revenue Share (%), by End-user Industry 2025 & 2033
- Figure 62: South America Polystyrene Industry Volume Share (%), by End-user Industry 2025 & 2033
- Figure 63: South America Polystyrene Industry Revenue (billion), by Country 2025 & 2033
- Figure 64: South America Polystyrene Industry Volume (K Tons), by Country 2025 & 2033
- Figure 65: South America Polystyrene Industry Revenue Share (%), by Country 2025 & 2033
- Figure 66: South America Polystyrene Industry Volume Share (%), by Country 2025 & 2033
- Figure 67: Middle East and Africa Polystyrene Industry Revenue (billion), by Resin Type 2025 & 2033
- Figure 68: Middle East and Africa Polystyrene Industry Volume (K Tons), by Resin Type 2025 & 2033
- Figure 69: Middle East and Africa Polystyrene Industry Revenue Share (%), by Resin Type 2025 & 2033
- Figure 70: Middle East and Africa Polystyrene Industry Volume Share (%), by Resin Type 2025 & 2033
- Figure 71: Middle East and Africa Polystyrene Industry Revenue (billion), by Form Type 2025 & 2033
- Figure 72: Middle East and Africa Polystyrene Industry Volume (K Tons), by Form Type 2025 & 2033
- Figure 73: Middle East and Africa Polystyrene Industry Revenue Share (%), by Form Type 2025 & 2033
- Figure 74: Middle East and Africa Polystyrene Industry Volume Share (%), by Form Type 2025 & 2033
- Figure 75: Middle East and Africa Polystyrene Industry Revenue (billion), by End-user Industry 2025 & 2033
- Figure 76: Middle East and Africa Polystyrene Industry Volume (K Tons), by End-user Industry 2025 & 2033
- Figure 77: Middle East and Africa Polystyrene Industry Revenue Share (%), by End-user Industry 2025 & 2033
- Figure 78: Middle East and Africa Polystyrene Industry Volume Share (%), by End-user Industry 2025 & 2033
- Figure 79: Middle East and Africa Polystyrene Industry Revenue (billion), by Country 2025 & 2033
- Figure 80: Middle East and Africa Polystyrene Industry Volume (K Tons), by Country 2025 & 2033
- Figure 81: Middle East and Africa Polystyrene Industry Revenue Share (%), by Country 2025 & 2033
- Figure 82: Middle East and Africa Polystyrene Industry Volume Share (%), by Country 2025 & 2033
List of Tables
- Table 1: Global Polystyrene Industry Revenue billion Forecast, by Resin Type 2020 & 2033
- Table 2: Global Polystyrene Industry Volume K Tons Forecast, by Resin Type 2020 & 2033
- Table 3: Global Polystyrene Industry Revenue billion Forecast, by Form Type 2020 & 2033
- Table 4: Global Polystyrene Industry Volume K Tons Forecast, by Form Type 2020 & 2033
- Table 5: Global Polystyrene Industry Revenue billion Forecast, by End-user Industry 2020 & 2033
- Table 6: Global Polystyrene Industry Volume K Tons Forecast, by End-user Industry 2020 & 2033
- Table 7: Global Polystyrene Industry Revenue billion Forecast, by Region 2020 & 2033
- Table 8: Global Polystyrene Industry Volume K Tons Forecast, by Region 2020 & 2033
- Table 9: Global Polystyrene Industry Revenue billion Forecast, by Resin Type 2020 & 2033
- Table 10: Global Polystyrene Industry Volume K Tons Forecast, by Resin Type 2020 & 2033
- Table 11: Global Polystyrene Industry Revenue billion Forecast, by Form Type 2020 & 2033
- Table 12: Global Polystyrene Industry Volume K Tons Forecast, by Form Type 2020 & 2033
- Table 13: Global Polystyrene Industry Revenue billion Forecast, by End-user Industry 2020 & 2033
- Table 14: Global Polystyrene Industry Volume K Tons Forecast, by End-user Industry 2020 & 2033
- Table 15: Global Polystyrene Industry Revenue billion Forecast, by Country 2020 & 2033
- Table 16: Global Polystyrene Industry Volume K Tons Forecast, by Country 2020 & 2033
- Table 17: China Polystyrene Industry Revenue (billion) Forecast, by Application 2020 & 2033
- Table 18: China Polystyrene Industry Volume (K Tons) Forecast, by Application 2020 & 2033
- Table 19: India Polystyrene Industry Revenue (billion) Forecast, by Application 2020 & 2033
- Table 20: India Polystyrene Industry Volume (K Tons) Forecast, by Application 2020 & 2033
- Table 21: Japan Polystyrene Industry Revenue (billion) Forecast, by Application 2020 & 2033
- Table 22: Japan Polystyrene Industry Volume (K Tons) Forecast, by Application 2020 & 2033
- Table 23: South Korea Polystyrene Industry Revenue (billion) Forecast, by Application 2020 & 2033
- Table 24: South Korea Polystyrene Industry Volume (K Tons) Forecast, by Application 2020 & 2033
- Table 25: Rest of Asia Pacific Polystyrene Industry Revenue (billion) Forecast, by Application 2020 & 2033
- Table 26: Rest of Asia Pacific Polystyrene Industry Volume (K Tons) Forecast, by Application 2020 & 2033
- Table 27: Global Polystyrene Industry Revenue billion Forecast, by Resin Type 2020 & 2033
- Table 28: Global Polystyrene Industry Volume K Tons Forecast, by Resin Type 2020 & 2033
- Table 29: Global Polystyrene Industry Revenue billion Forecast, by Form Type 2020 & 2033
- Table 30: Global Polystyrene Industry Volume K Tons Forecast, by Form Type 2020 & 2033
- Table 31: Global Polystyrene Industry Revenue billion Forecast, by End-user Industry 2020 & 2033
- Table 32: Global Polystyrene Industry Volume K Tons Forecast, by End-user Industry 2020 & 2033
- Table 33: Global Polystyrene Industry Revenue billion Forecast, by Country 2020 & 2033
- Table 34: Global Polystyrene Industry Volume K Tons Forecast, by Country 2020 & 2033
- Table 35: United States Polystyrene Industry Revenue (billion) Forecast, by Application 2020 & 2033
- Table 36: United States Polystyrene Industry Volume (K Tons) Forecast, by Application 2020 & 2033
- Table 37: Canada Polystyrene Industry Revenue (billion) Forecast, by Application 2020 & 2033
- Table 38: Canada Polystyrene Industry Volume (K Tons) Forecast, by Application 2020 & 2033
- Table 39: Mexico Polystyrene Industry Revenue (billion) Forecast, by Application 2020 & 2033
- Table 40: Mexico Polystyrene Industry Volume (K Tons) Forecast, by Application 2020 & 2033
- Table 41: Global Polystyrene Industry Revenue billion Forecast, by Resin Type 2020 & 2033
- Table 42: Global Polystyrene Industry Volume K Tons Forecast, by Resin Type 2020 & 2033
- Table 43: Global Polystyrene Industry Revenue billion Forecast, by Form Type 2020 & 2033
- Table 44: Global Polystyrene Industry Volume K Tons Forecast, by Form Type 2020 & 2033
- Table 45: Global Polystyrene Industry Revenue billion Forecast, by End-user Industry 2020 & 2033
- Table 46: Global Polystyrene Industry Volume K Tons Forecast, by End-user Industry 2020 & 2033
- Table 47: Global Polystyrene Industry Revenue billion Forecast, by Country 2020 & 2033
- Table 48: Global Polystyrene Industry Volume K Tons Forecast, by Country 2020 & 2033
- Table 49: Germany Polystyrene Industry Revenue (billion) Forecast, by Application 2020 & 2033
- Table 50: Germany Polystyrene Industry Volume (K Tons) Forecast, by Application 2020 & 2033
- Table 51: United Kingdom Polystyrene Industry Revenue (billion) Forecast, by Application 2020 & 2033
- Table 52: United Kingdom Polystyrene Industry Volume (K Tons) Forecast, by Application 2020 & 2033
- Table 53: France Polystyrene Industry Revenue (billion) Forecast, by Application 2020 & 2033
- Table 54: France Polystyrene Industry Volume (K Tons) Forecast, by Application 2020 & 2033
- Table 55: Italy Polystyrene Industry Revenue (billion) Forecast, by Application 2020 & 2033
- Table 56: Italy Polystyrene Industry Volume (K Tons) Forecast, by Application 2020 & 2033
- Table 57: Spain Polystyrene Industry Revenue (billion) Forecast, by Application 2020 & 2033
- Table 58: Spain Polystyrene Industry Volume (K Tons) Forecast, by Application 2020 & 2033
- Table 59: Rest of Europe Polystyrene Industry Revenue (billion) Forecast, by Application 2020 & 2033
- Table 60: Rest of Europe Polystyrene Industry Volume (K Tons) Forecast, by Application 2020 & 2033
- Table 61: Global Polystyrene Industry Revenue billion Forecast, by Resin Type 2020 & 2033
- Table 62: Global Polystyrene Industry Volume K Tons Forecast, by Resin Type 2020 & 2033
- Table 63: Global Polystyrene Industry Revenue billion Forecast, by Form Type 2020 & 2033
- Table 64: Global Polystyrene Industry Volume K Tons Forecast, by Form Type 2020 & 2033
- Table 65: Global Polystyrene Industry Revenue billion Forecast, by End-user Industry 2020 & 2033
- Table 66: Global Polystyrene Industry Volume K Tons Forecast, by End-user Industry 2020 & 2033
- Table 67: Global Polystyrene Industry Revenue billion Forecast, by Country 2020 & 2033
- Table 68: Global Polystyrene Industry Volume K Tons Forecast, by Country 2020 & 2033
- Table 69: Brazil Polystyrene Industry Revenue (billion) Forecast, by Application 2020 & 2033
- Table 70: Brazil Polystyrene Industry Volume (K Tons) Forecast, by Application 2020 & 2033
- Table 71: Argentina Polystyrene Industry Revenue (billion) Forecast, by Application 2020 & 2033
- Table 72: Argentina Polystyrene Industry Volume (K Tons) Forecast, by Application 2020 & 2033
- Table 73: Rest of South America Polystyrene Industry Revenue (billion) Forecast, by Application 2020 & 2033
- Table 74: Rest of South America Polystyrene Industry Volume (K Tons) Forecast, by Application 2020 & 2033
- Table 75: Global Polystyrene Industry Revenue billion Forecast, by Resin Type 2020 & 2033
- Table 76: Global Polystyrene Industry Volume K Tons Forecast, by Resin Type 2020 & 2033
- Table 77: Global Polystyrene Industry Revenue billion Forecast, by Form Type 2020 & 2033
- Table 78: Global Polystyrene Industry Volume K Tons Forecast, by Form Type 2020 & 2033
- Table 79: Global Polystyrene Industry Revenue billion Forecast, by End-user Industry 2020 & 2033
- Table 80: Global Polystyrene Industry Volume K Tons Forecast, by End-user Industry 2020 & 2033
- Table 81: Global Polystyrene Industry Revenue billion Forecast, by Country 2020 & 2033
- Table 82: Global Polystyrene Industry Volume K Tons Forecast, by Country 2020 & 2033
- Table 83: Saudi Arabia Polystyrene Industry Revenue (billion) Forecast, by Application 2020 & 2033
- Table 84: Saudi Arabia Polystyrene Industry Volume (K Tons) Forecast, by Application 2020 & 2033
- Table 85: South Africa Polystyrene Industry Revenue (billion) Forecast, by Application 2020 & 2033
- Table 86: South Africa Polystyrene Industry Volume (K Tons) Forecast, by Application 2020 & 2033
- Table 87: UAE Polystyrene Industry Revenue (billion) Forecast, by Application 2020 & 2033
- Table 88: UAE Polystyrene Industry Volume (K Tons) Forecast, by Application 2020 & 2033
- Table 89: Rest of Middle East and Africa Polystyrene Industry Revenue (billion) Forecast, by Application 2020 & 2033
- Table 90: Rest of Middle East and Africa Polystyrene Industry Volume (K Tons) Forecast, by Application 2020 & 2033
Frequently Asked Questions
1. What is the projected Compound Annual Growth Rate (CAGR) of the Polystyrene Industry?
The projected CAGR is approximately 4.6%.
2. Which companies are prominent players in the Polystyrene Industry?
Key companies in the market include Atlas Molded Products, Synthos, Total, INEOS Styrolution Group GmbH, Alpek S A B de CV, Versalis SpA, KUMHO PETROCHEMICAL, CHIMEI, BASF SE, SABIC, Trinseo, LG Chem, Innova, Americas Styrenics LLC (AmSty), Formosa Chemicals & Fibre Corp.
3. What are the main segments of the Polystyrene Industry?
The market segments include Resin Type, Form Type, End-user Industry.
4. Can you provide details about the market size?
The market size is estimated to be USD 50.99 billion as of 2022.
5. What are some drivers contributing to market growth?
Recycling in the Polystyrene Industry; Growing Consumer Electronics Market.
6. What are the notable trends driving market growth?
High Impact Polystyrene (HIPS) Type to Dominate the Market.
7. Are there any restraints impacting market growth?
Increasing Ban on Polystyrene across North America and Europe; Availability of High-performance Substitutes.
8. Can you provide examples of recent developments in the market?
September 2022: INEOS Styrolution introduced the bio attributed polystyrene, which is manufactured from renewable ISCC-certified feedstock, and recycling solutions for polystyrene that make downcycling unnecessary.
9. What pricing options are available for accessing the report?
Pricing options include single-user, multi-user, and enterprise licenses priced at USD 4750, USD 5250, and USD 8750 respectively.
10. Is the market size provided in terms of value or volume?
The market size is provided in terms of value, measured in billion and volume, measured in K Tons.
11. Are there any specific market keywords associated with the report?
Yes, the market keyword associated with the report is "Polystyrene Industry," which aids in identifying and referencing the specific market segment covered.
12. How do I determine which pricing option suits my needs best?
The pricing options vary based on user requirements and access needs. Individual users may opt for single-user licenses, while businesses requiring broader access may choose multi-user or enterprise licenses for cost-effective access to the report.
13. Are there any additional resources or data provided in the Polystyrene Industry report?
While the report offers comprehensive insights, it's advisable to review the specific contents or supplementary materials provided to ascertain if additional resources or data are available.
14. How can I stay updated on further developments or reports in the Polystyrene Industry?
To stay informed about further developments, trends, and reports in the Polystyrene Industry, consider subscribing to industry newsletters, following relevant companies and organizations, or regularly checking reputable industry news sources and publications.
Methodology
Step 1 - Identification of Relevant Samples Size from Population Database


Step 2 - Approaches for Defining Global Market Size (Value, Volume* & Price*)

Note*: In applicable scenarios
Step 3 - Data Sources
Primary Research
- Web Analytics
- Survey Reports
- Research Institute
- Latest Research Reports
- Opinion Leaders
Secondary Research
- Annual Reports
- White Paper
- Latest Press Release
- Industry Association
- Paid Database
- Investor Presentations

Step 4 - Data Triangulation
Involves using different sources of information in order to increase the validity of a study
These sources are likely to be stakeholders in a program - participants, other researchers, program staff, other community members, and so on.
Then we put all data in single framework & apply various statistical tools to find out the dynamic on the market.
During the analysis stage, feedback from the stakeholder groups would be compared to determine areas of agreement as well as areas of divergence