

Key Insights
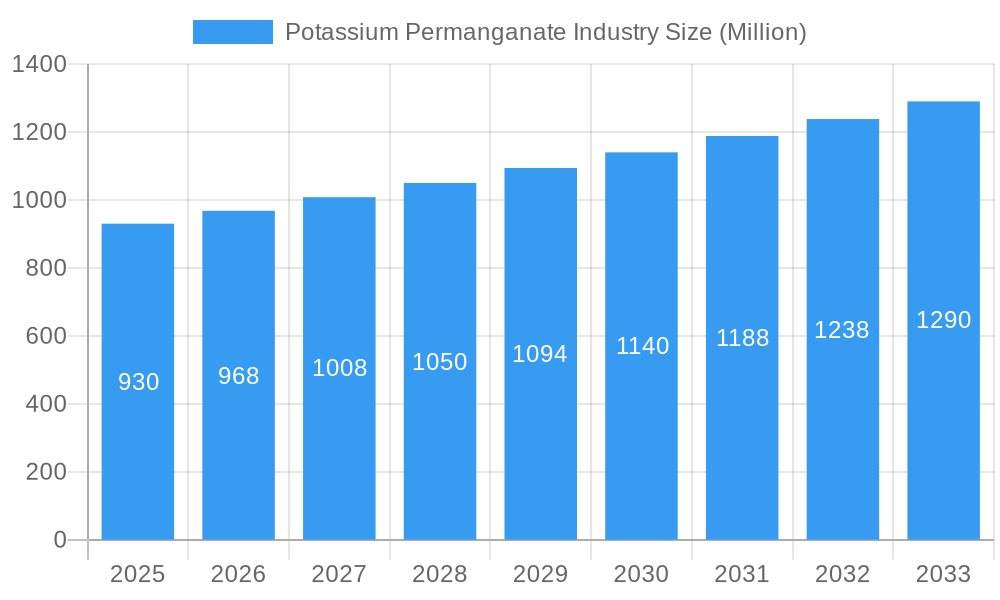
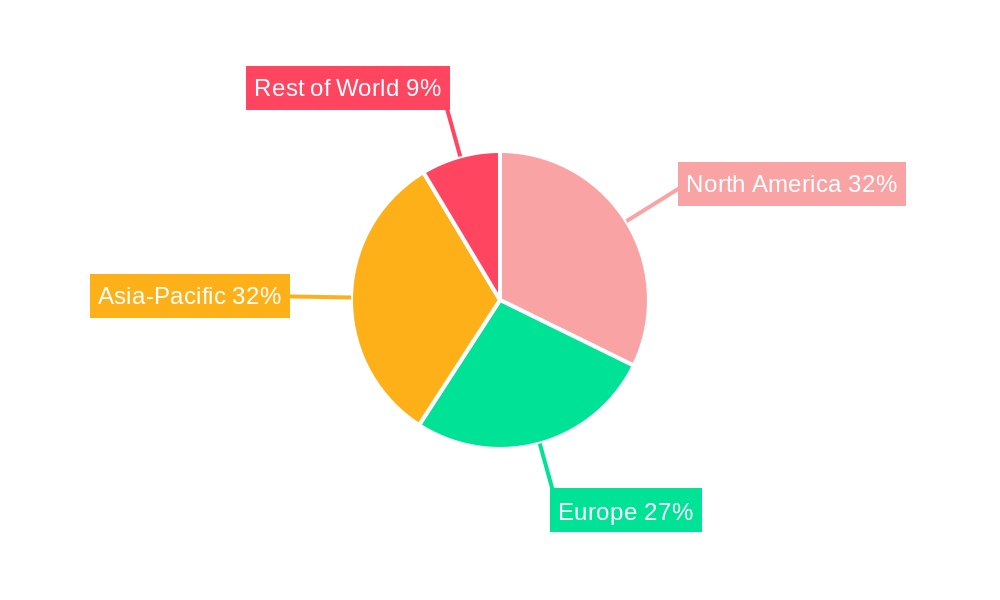
The potassium permanganate market, valued at $0.93 billion in 2025, is projected to experience steady growth, driven by its diverse applications across various industries. The compound annual growth rate (CAGR) of 4.11% from 2025 to 2033 signifies a promising outlook, fueled primarily by increasing demand from the water treatment sector, where its strong oxidizing properties are crucial for disinfection and purification. Furthermore, its use in the chemical industry as an oxidant and in various other applications, including medicine (antiseptic and disinfectant) and textiles (bleaching agent), contributes significantly to market expansion. While specific regional data is unavailable, a geographically diversified market is expected, with regions like North America and Europe potentially holding larger shares due to established industries and stringent environmental regulations. Potential restraints could include price fluctuations of raw materials like manganese dioxide, stringent regulations surrounding its handling and disposal, and the emergence of alternative disinfectants and oxidants. However, ongoing research and development efforts focused on improving its efficiency and safety profiles are likely to mitigate these challenges.
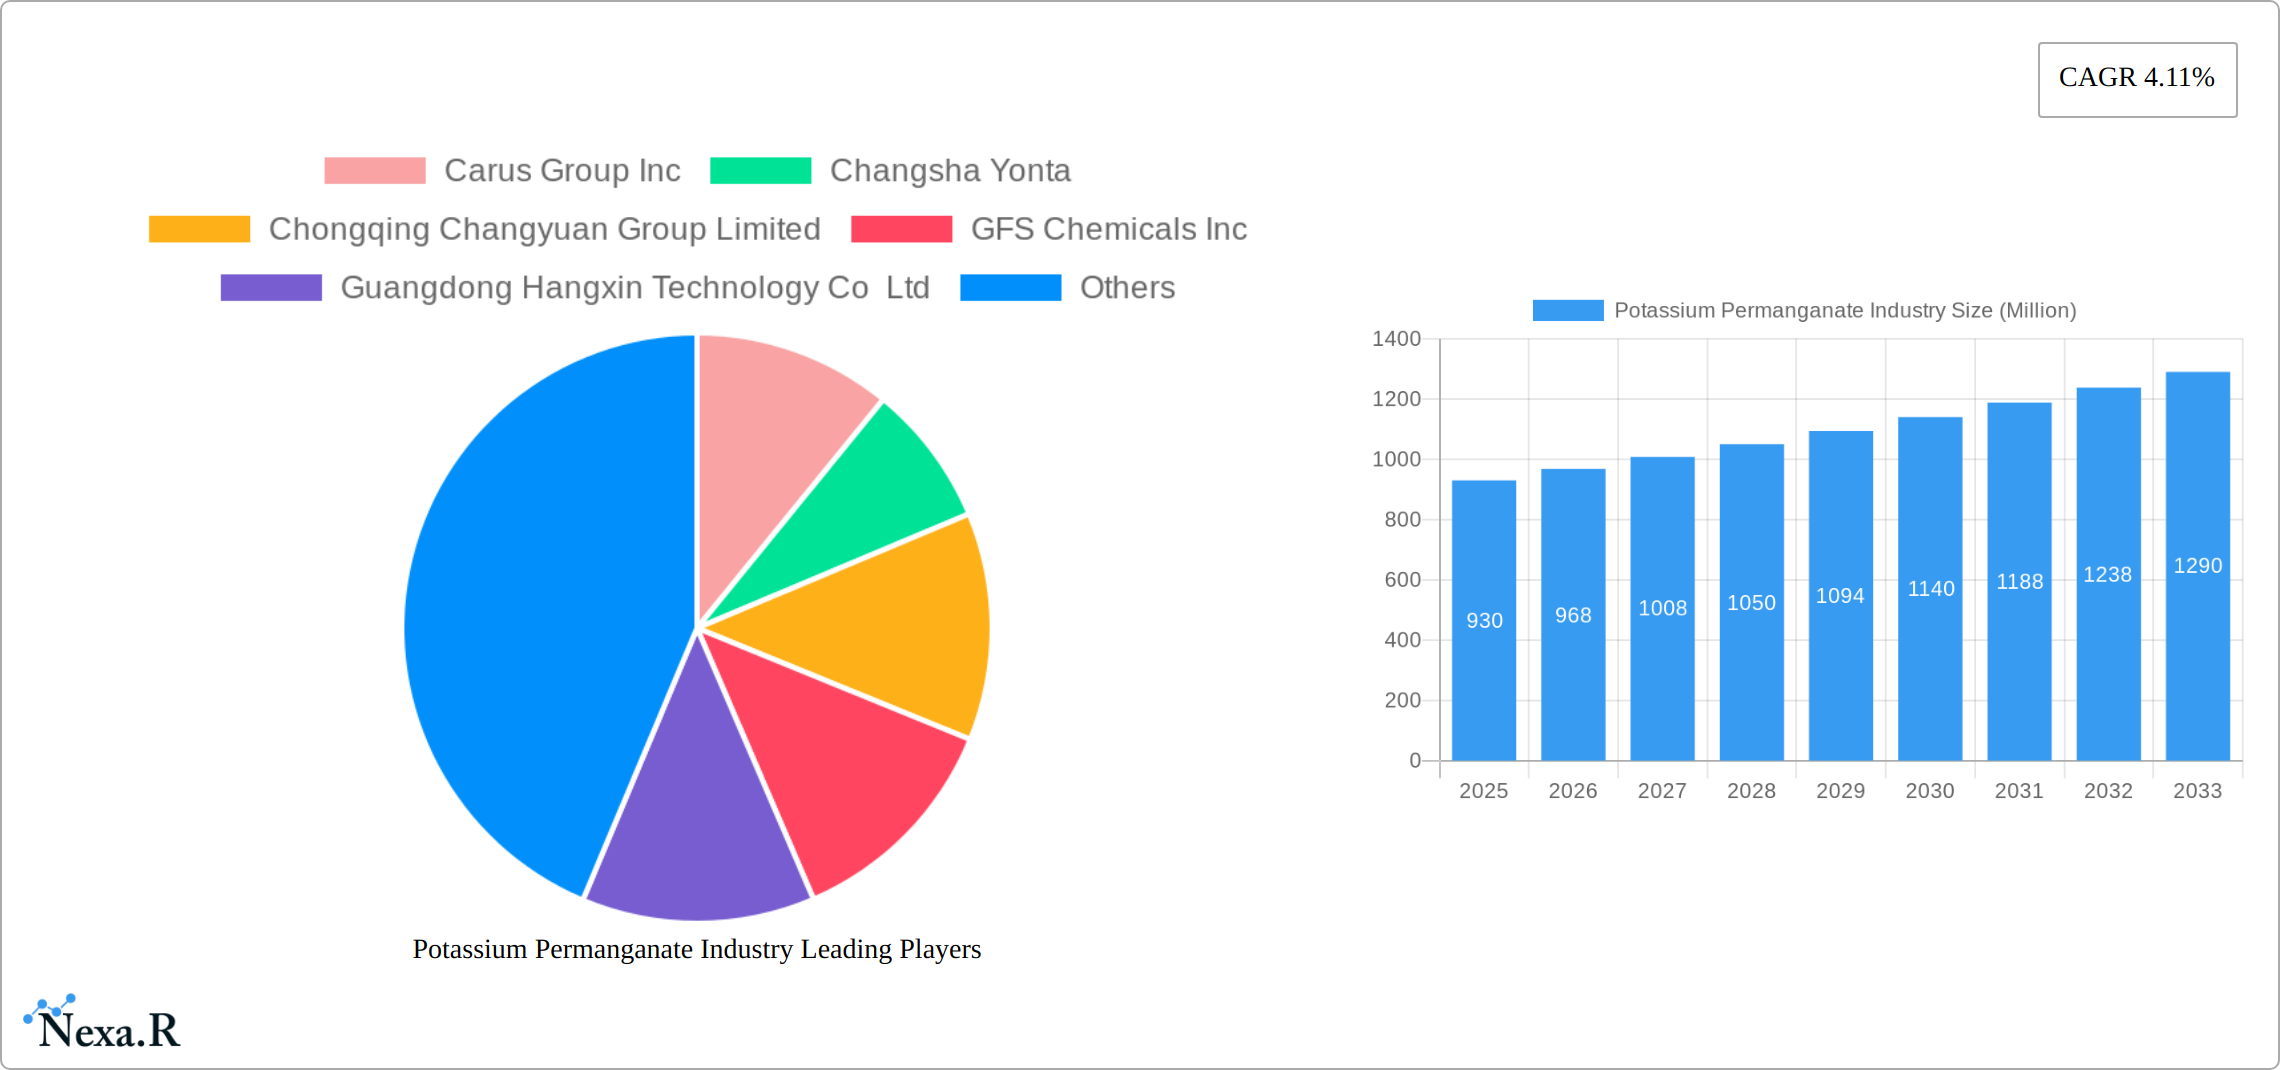
Potassium Permanganate Industry Market Size (In Million)
The competitive landscape is moderately fragmented, featuring both established players like Carus Group Inc., Nippon Chemical Industrial CO LTD, and Univar Solutions Inc., and regional manufacturers such as those in India and China. These companies are actively engaged in strategic initiatives including capacity expansions, technological advancements, and geographic expansion to maintain their market positions and cater to the growing demand. The market's future trajectory will depend significantly on technological advancements that enhance production efficiency and reduce environmental impact, as well as the evolution of regulatory frameworks governing its use across different sectors. Continued growth is anticipated, driven by increasing global industrialization, the rising need for effective water treatment solutions, and the expanding application of potassium permanganate in niche sectors.
Potassium Permanganate Industry Company Market Share
Potassium Permanganate Industry Market Report: 2019-2033
This comprehensive report provides an in-depth analysis of the Potassium Permanganate industry, offering invaluable insights for industry professionals, investors, and strategic decision-makers. The report covers the period from 2019 to 2033, with a base year of 2025 and a forecast period from 2025 to 2033. The analysis delves into market dynamics, growth trends, regional performance, product landscape, and key players, equipping readers with the knowledge to navigate this evolving market effectively. The report utilizes data measured in Million units.
Potassium Permanganate Industry Market Dynamics & Structure
This section dives deep into the competitive arena of the Potassium Permanganate market, dissecting its concentration, the pulse of technological innovation, the influence of regulatory landscapes, the presence of competitive substitutes, the characteristics of end-user demographics, and the strategic currents of mergers and acquisitions (M&A). The global Potassium Permanganate market is characterized by a moderate level of fragmentation, with a number of significant players actively competing for market share.
- Market Concentration: The market is estimated to exhibit a Herfindahl-Hirschman Index (HHI) of [Insert specific HHI value here] in 2025, signifying a moderately concentrated market. This suggests that while a few larger players hold significant portions, there's still room for competition and growth for smaller entities.
- Technological Innovation: Research and development efforts are continuously aimed at optimizing production efficiencies and uncovering novel applications for Potassium Permanganate. Key challenges in this domain include the substantial capital investment required for advanced manufacturing and the imperative to adhere to increasingly rigorous environmental regulations.
- Regulatory Framework: Stringent environmental mandates significantly influence production methodologies and waste disposal practices, thereby impacting operational expenditures. The geographical variations in these regulations further amplify the complexity for international market participants.
- Competitive Product Substitutes: While direct substitutes for Potassium Permanganate are scarce, alternative chemicals can fulfill specific functions in certain applications, presenting a nuanced competitive challenge that requires strategic consideration.
- End-User Demographics: The primary demand drivers for Potassium Permanganate originate from the water treatment, textile, pharmaceutical, and chemical manufacturing sectors. The growth trajectories and evolving needs of these industries are pivotal in shaping the overall market's demand patterns.
- M&A Trends: Between 2019 and 2024, the Potassium Permanganate industry witnessed approximately [Insert specific number of M&A deals here] merger and acquisition transactions. These activities were primarily fueled by strategic objectives such as expanding market reach and acquiring cutting-edge technologies.
The intricate interplay of these factors collectively sculpts the overarching market dynamics, presenting a landscape rich with both opportunities and challenges for entities operating within this sector. The report offers a granular quantitative and qualitative evaluation of these elements, providing strategic intelligence essential for informed decision-making and future planning.
Potassium Permanganate Industry Growth Trends & Insights
Drawing upon a robust foundation of extensive market research data, this section offers a comprehensive analysis of the Potassium Permanganate market's historical size evolution, adoption rates of new technologies, the impact of technological disruptions, and discernible shifts in consumer behavior. The market experienced a Compound Annual Growth Rate (CAGR) of [Insert historical CAGR value here]% during the historical period spanning from 2019 to 2024. Projections indicate a sustained CAGR of [Insert forecast CAGR value here]% throughout the forecast period from 2025 to 2033. This anticipated growth is predominantly propelled by the escalating demand from the water treatment and textile industries, complemented by ongoing advancements in production methodologies. Furthermore, the report meticulously examines the influence of various macroeconomic factors on market expansion, including economic fluctuations and evolving governmental policies. A detailed breakdown of market penetration rates across key geographical regions and end-use segments is also provided, enabling a granular understanding of prevailing market trends and their strategic implications.
Dominant Regions, Countries, or Segments in Potassium Permanganate Industry
This section identifies the leading regions, countries, and segments driving Potassium Permanganate market growth. The report highlights the key factors contributing to this dominance, including market share, growth potential, economic policies, and infrastructure development.
- Dominant Regions: Asia-Pacific is anticipated to be the largest market region, driven by the robust growth in the water treatment and chemical industries in countries like China and India.
- Key Drivers:
- Strong economic growth in emerging economies.
- Increasing investment in water infrastructure projects.
- Growing demand from various industries like textiles and pharmaceuticals.
- Growth Potential: Significant opportunities exist in developing economies with expanding industrialization and urbanization, which directly influence the need for water treatment and other applications of Potassium Permanganate.
The report provides a deep dive into the market dynamics of each region, offering detailed analysis of market size, growth rate, and key influencing factors. This enables readers to identify promising markets and strategic investment opportunities.
Potassium Permanganate Industry Product Landscape
The Potassium Permanganate market is distinguished by a diverse array of products, offered in varying purity levels and tailored formulations to meet the specific demands of distinct applications. Recent innovations have notably concentrated on enhancing product purity and pioneering specialized formulations for niche market segments. This includes the development of more efficient and ecologically responsible production processes. These technological advancements collectively contribute to improved product performance, thereby broadening its appeal to a wider customer base and acting as a catalyst for further market growth. The report meticulously details the specifications and performance metrics associated with each distinct product category.
Key Drivers, Barriers & Challenges in Potassium Permanganate Industry
Key Drivers:
- Growing demand from the water treatment sector.
- Expanding applications in the textile and pharmaceutical industries.
- Technological advancements in production methods.
Key Challenges & Restraints:
- Fluctuations in raw material prices, which directly affect production costs.
- Stringent environmental regulations and disposal challenges.
- Intense competition from other chemical manufacturers.
Emerging Opportunities in Potassium Permanganate Industry
Emerging opportunities exist in untapped markets, especially in developing economies with expanding infrastructure projects. Further opportunities lie in the development of innovative applications of Potassium Permanganate in areas like environmental remediation and advanced oxidation processes. Exploring novel formulations and improving product delivery methods also present promising avenues for market expansion.
Growth Accelerators in the Potassium Permanganate Industry Industry
Long-term growth will be fueled by technological advancements that increase production efficiency and reduce environmental impact. Strategic partnerships and acquisitions are also expected to play a significant role in accelerating market expansion, providing access to new technologies and markets. The expanding applications of Potassium Permanganate in emerging sectors such as advanced materials manufacturing offer substantial potential for future growth.
Key Players Shaping the Potassium Permanganate Industry Market
- Carus Group Inc
- Changsha Yonta
- Chongqing Changyuan Group Limited
- GFS Chemicals Inc
- Guangdong Hangxin Technology Co Ltd
- Libox Chem (India) Pvt Ltd
- Magnesia
- Milport Enterprises Inc
- Nippon Chemical Industrial CO LTD
- Otto Chemie Pvt Ltd
- Univar Solutions Inc
- Universal Chemicals & Industries Pvt Ltd
- List Not Exhaustive
Notable Milestones in Potassium Permanganate Industry Sector
- 2022: A prominent industry player introduced a groundbreaking, environmentally sustainable production process, achieving a remarkable [Insert specific percentage]% reduction in carbon emissions.
- 2023: A significant merger and acquisition transaction was successfully concluded, substantially expanding the market reach and operational footprint of a leading company in the sector.
- 2024: The market saw the launch of a new high-purity Potassium Permanganate product, specifically engineered for demanding pharmaceutical applications, addressing a critical need for enhanced quality and performance.
- Additional comprehensive details on recent pivotal developments will be extensively elaborated within the complete market report.
In-Depth Potassium Permanganate Industry Market Outlook
The Potassium Permanganate industry is strategically positioned for substantial growth over the forthcoming forecast period. This optimistic outlook is underpinned by continuous technological advancements in production methodologies, the expanding spectrum of applications across diverse industrial sectors, and the escalating demand emanating from emerging economies. Strategic alliances and focused investments in research and development initiatives are anticipated to further bolster market expansion and reinforce the competitive standing of key industry players. The inherent potential for innovative applications and the ongoing drive towards sustainable production methods collectively paint a promising and dynamic future for this vital industry.
Potassium Permanganate Industry Segmentation
-
1. End-user Industry
- 1.1. Pharmaceutical
- 1.2. Water Treatment
- 1.3. Food and Beverage
- 1.4. Agriculture
- 1.5. Other End-user Industries
Potassium Permanganate Industry Segmentation By Geography
-
1. Asia Pacific
- 1.1. China
- 1.2. India
- 1.3. Japan
- 1.4. South Korea
- 1.5. Rest of Asia Pacific
-
2. North America
- 2.1. United States
- 2.2. Canada
- 2.3. Mexico
-
3. Europe
- 3.1. Germany
- 3.2. United Kingdom
- 3.3. France
- 3.4. Italy
- 3.5. Rest of Europe
-
4. South America
- 4.1. Brazil
- 4.2. Argentina
- 4.3. Rest of South America
-
5. Middle East and Africa
- 5.1. Saudi Arabia
- 5.2. South Africa
- 5.3. Rest of Middle East and Africa
Potassium Permanganate Industry Regional Market Share
Geographic Coverage of Potassium Permanganate Industry
Potassium Permanganate Industry REPORT HIGHLIGHTS
| Aspects | Details |
|---|---|
| Study Period | 2020-2034 |
| Base Year | 2025 |
| Estimated Year | 2026 |
| Forecast Period | 2026-2034 |
| Historical Period | 2020-2025 |
| Growth Rate | CAGR of 4.11% from 2020-2034 |
| Segmentation |
|
Table of Contents
- 1. Introduction
- 1.1. Research Scope
- 1.2. Market Segmentation
- 1.3. Research Objective
- 1.4. Definitions and Assumptions
- 2. Executive Summary
- 2.1. Market Snapshot
- 3. Market Dynamics
- 3.1. Market Drivers
- 3.2. Market Restrains
- 3.3. Market Trends
- 3.4. Market Opportunities
- 4. Market Factor Analysis
- 4.1. Porters Five Forces
- 4.1.1. Bargaining Power of Suppliers
- 4.1.2. Bargaining Power of Buyers
- 4.1.3. Threat of New Entrants
- 4.1.4. Threat of Substitutes
- 4.1.5. Competitive Rivalry
- 4.2. PESTEL analysis
- 4.3. BCG Analysis
- 4.3.1. Stars (High Growth, High Market Share)
- 4.3.2. Cash Cows (Low Growth, High Market Share)
- 4.3.3. Question Mark (High Growth, Low Market Share)
- 4.3.4. Dogs (Low Growth, Low Market Share)
- 4.4. Ansoff Matrix Analysis
- 4.5. Supply Chain Analysis
- 4.6. Regulatory Landscape
- 4.7. Current Market Potential and Opportunity Assessment (TAM–SAM–SOM Framework)
- 4.8. NRP Analyst Note
- 4.1. Porters Five Forces
- 5. Market Analysis, Insights and Forecast 2021-2033
- 5.1. Market Analysis, Insights and Forecast - by End-user Industry
- 5.1.1. Pharmaceutical
- 5.1.2. Water Treatment
- 5.1.3. Food and Beverage
- 5.1.4. Agriculture
- 5.1.5. Other End-user Industries
- 5.2. Market Analysis, Insights and Forecast - by Region
- 5.2.1. Asia Pacific
- 5.2.2. North America
- 5.2.3. Europe
- 5.2.4. South America
- 5.2.5. Middle East and Africa
- 5.1. Market Analysis, Insights and Forecast - by End-user Industry
- 6. Global Potassium Permanganate Industry Analysis, Insights and Forecast, 2021-2033
- 6.1. Market Analysis, Insights and Forecast - by End-user Industry
- 6.1.1. Pharmaceutical
- 6.1.2. Water Treatment
- 6.1.3. Food and Beverage
- 6.1.4. Agriculture
- 6.1.5. Other End-user Industries
- 6.1. Market Analysis, Insights and Forecast - by End-user Industry
- 7. Asia Pacific Potassium Permanganate Industry Analysis, Insights and Forecast, 2020-2032
- 7.1. Market Analysis, Insights and Forecast - by End-user Industry
- 7.1.1. Pharmaceutical
- 7.1.2. Water Treatment
- 7.1.3. Food and Beverage
- 7.1.4. Agriculture
- 7.1.5. Other End-user Industries
- 7.1. Market Analysis, Insights and Forecast - by End-user Industry
- 8. North America Potassium Permanganate Industry Analysis, Insights and Forecast, 2020-2032
- 8.1. Market Analysis, Insights and Forecast - by End-user Industry
- 8.1.1. Pharmaceutical
- 8.1.2. Water Treatment
- 8.1.3. Food and Beverage
- 8.1.4. Agriculture
- 8.1.5. Other End-user Industries
- 8.1. Market Analysis, Insights and Forecast - by End-user Industry
- 9. Europe Potassium Permanganate Industry Analysis, Insights and Forecast, 2020-2032
- 9.1. Market Analysis, Insights and Forecast - by End-user Industry
- 9.1.1. Pharmaceutical
- 9.1.2. Water Treatment
- 9.1.3. Food and Beverage
- 9.1.4. Agriculture
- 9.1.5. Other End-user Industries
- 9.1. Market Analysis, Insights and Forecast - by End-user Industry
- 10. South America Potassium Permanganate Industry Analysis, Insights and Forecast, 2020-2032
- 10.1. Market Analysis, Insights and Forecast - by End-user Industry
- 10.1.1. Pharmaceutical
- 10.1.2. Water Treatment
- 10.1.3. Food and Beverage
- 10.1.4. Agriculture
- 10.1.5. Other End-user Industries
- 10.1. Market Analysis, Insights and Forecast - by End-user Industry
- 11. Middle East and Africa Potassium Permanganate Industry Analysis, Insights and Forecast, 2020-2032
- 11.1. Market Analysis, Insights and Forecast - by End-user Industry
- 11.1.1. Pharmaceutical
- 11.1.2. Water Treatment
- 11.1.3. Food and Beverage
- 11.1.4. Agriculture
- 11.1.5. Other End-user Industries
- 11.1. Market Analysis, Insights and Forecast - by End-user Industry
- 12. Competitive Analysis
- 12.1. Company Profiles
- 12.1.1 Carus Group Inc
- 12.1.1.1. Company Overview
- 12.1.1.2. Products
- 12.1.1.3. Company Financials
- 12.1.1.4. SWOT Analysis
- 12.1.2 Changsha Yonta
- 12.1.2.1. Company Overview
- 12.1.2.2. Products
- 12.1.2.3. Company Financials
- 12.1.2.4. SWOT Analysis
- 12.1.3 Chongqing Changyuan Group Limited
- 12.1.3.1. Company Overview
- 12.1.3.2. Products
- 12.1.3.3. Company Financials
- 12.1.3.4. SWOT Analysis
- 12.1.4 GFS Chemicals Inc
- 12.1.4.1. Company Overview
- 12.1.4.2. Products
- 12.1.4.3. Company Financials
- 12.1.4.4. SWOT Analysis
- 12.1.5 Guangdong Hangxin Technology Co Ltd
- 12.1.5.1. Company Overview
- 12.1.5.2. Products
- 12.1.5.3. Company Financials
- 12.1.5.4. SWOT Analysis
- 12.1.6 Libox Chem (India) Pvt Ltd
- 12.1.6.1. Company Overview
- 12.1.6.2. Products
- 12.1.6.3. Company Financials
- 12.1.6.4. SWOT Analysis
- 12.1.7 Magnesia
- 12.1.7.1. Company Overview
- 12.1.7.2. Products
- 12.1.7.3. Company Financials
- 12.1.7.4. SWOT Analysis
- 12.1.8 Milport Enterprises Inc
- 12.1.8.1. Company Overview
- 12.1.8.2. Products
- 12.1.8.3. Company Financials
- 12.1.8.4. SWOT Analysis
- 12.1.9 Nippon Chemical Industrial CO LTD
- 12.1.9.1. Company Overview
- 12.1.9.2. Products
- 12.1.9.3. Company Financials
- 12.1.9.4. SWOT Analysis
- 12.1.10 Otto Chemie Pvt Ltd
- 12.1.10.1. Company Overview
- 12.1.10.2. Products
- 12.1.10.3. Company Financials
- 12.1.10.4. SWOT Analysis
- 12.1.11 Univar Solutions Inc
- 12.1.11.1. Company Overview
- 12.1.11.2. Products
- 12.1.11.3. Company Financials
- 12.1.11.4. SWOT Analysis
- 12.1.12 Universal Chemicals & Industries Pvt Ltd *List Not Exhaustive
- 12.1.12.1. Company Overview
- 12.1.12.2. Products
- 12.1.12.3. Company Financials
- 12.1.12.4. SWOT Analysis
- 12.1.1 Carus Group Inc
- 12.2. Market Entropy
- 12.2.1 Company's Key Areas Served
- 12.2.2 Recent Developments
- 12.3. Company Market Share Analysis 2025
- 12.3.1 Top 5 Companies Market Share Analysis
- 12.3.2 Top 3 Companies Market Share Analysis
- 12.4. List of Potential Customers
- 13. Research Methodology
List of Figures
- Figure 1: Global Potassium Permanganate Industry Revenue Breakdown (Million, %) by Region 2025 & 2033
- Figure 2: Global Potassium Permanganate Industry Volume Breakdown (Billion, %) by Region 2025 & 2033
- Figure 3: Asia Pacific Potassium Permanganate Industry Revenue (Million), by End-user Industry 2025 & 2033
- Figure 4: Asia Pacific Potassium Permanganate Industry Volume (Billion), by End-user Industry 2025 & 2033
- Figure 5: Asia Pacific Potassium Permanganate Industry Revenue Share (%), by End-user Industry 2025 & 2033
- Figure 6: Asia Pacific Potassium Permanganate Industry Volume Share (%), by End-user Industry 2025 & 2033
- Figure 7: Asia Pacific Potassium Permanganate Industry Revenue (Million), by Country 2025 & 2033
- Figure 8: Asia Pacific Potassium Permanganate Industry Volume (Billion), by Country 2025 & 2033
- Figure 9: Asia Pacific Potassium Permanganate Industry Revenue Share (%), by Country 2025 & 2033
- Figure 10: Asia Pacific Potassium Permanganate Industry Volume Share (%), by Country 2025 & 2033
- Figure 11: North America Potassium Permanganate Industry Revenue (Million), by End-user Industry 2025 & 2033
- Figure 12: North America Potassium Permanganate Industry Volume (Billion), by End-user Industry 2025 & 2033
- Figure 13: North America Potassium Permanganate Industry Revenue Share (%), by End-user Industry 2025 & 2033
- Figure 14: North America Potassium Permanganate Industry Volume Share (%), by End-user Industry 2025 & 2033
- Figure 15: North America Potassium Permanganate Industry Revenue (Million), by Country 2025 & 2033
- Figure 16: North America Potassium Permanganate Industry Volume (Billion), by Country 2025 & 2033
- Figure 17: North America Potassium Permanganate Industry Revenue Share (%), by Country 2025 & 2033
- Figure 18: North America Potassium Permanganate Industry Volume Share (%), by Country 2025 & 2033
- Figure 19: Europe Potassium Permanganate Industry Revenue (Million), by End-user Industry 2025 & 2033
- Figure 20: Europe Potassium Permanganate Industry Volume (Billion), by End-user Industry 2025 & 2033
- Figure 21: Europe Potassium Permanganate Industry Revenue Share (%), by End-user Industry 2025 & 2033
- Figure 22: Europe Potassium Permanganate Industry Volume Share (%), by End-user Industry 2025 & 2033
- Figure 23: Europe Potassium Permanganate Industry Revenue (Million), by Country 2025 & 2033
- Figure 24: Europe Potassium Permanganate Industry Volume (Billion), by Country 2025 & 2033
- Figure 25: Europe Potassium Permanganate Industry Revenue Share (%), by Country 2025 & 2033
- Figure 26: Europe Potassium Permanganate Industry Volume Share (%), by Country 2025 & 2033
- Figure 27: South America Potassium Permanganate Industry Revenue (Million), by End-user Industry 2025 & 2033
- Figure 28: South America Potassium Permanganate Industry Volume (Billion), by End-user Industry 2025 & 2033
- Figure 29: South America Potassium Permanganate Industry Revenue Share (%), by End-user Industry 2025 & 2033
- Figure 30: South America Potassium Permanganate Industry Volume Share (%), by End-user Industry 2025 & 2033
- Figure 31: South America Potassium Permanganate Industry Revenue (Million), by Country 2025 & 2033
- Figure 32: South America Potassium Permanganate Industry Volume (Billion), by Country 2025 & 2033
- Figure 33: South America Potassium Permanganate Industry Revenue Share (%), by Country 2025 & 2033
- Figure 34: South America Potassium Permanganate Industry Volume Share (%), by Country 2025 & 2033
- Figure 35: Middle East and Africa Potassium Permanganate Industry Revenue (Million), by End-user Industry 2025 & 2033
- Figure 36: Middle East and Africa Potassium Permanganate Industry Volume (Billion), by End-user Industry 2025 & 2033
- Figure 37: Middle East and Africa Potassium Permanganate Industry Revenue Share (%), by End-user Industry 2025 & 2033
- Figure 38: Middle East and Africa Potassium Permanganate Industry Volume Share (%), by End-user Industry 2025 & 2033
- Figure 39: Middle East and Africa Potassium Permanganate Industry Revenue (Million), by Country 2025 & 2033
- Figure 40: Middle East and Africa Potassium Permanganate Industry Volume (Billion), by Country 2025 & 2033
- Figure 41: Middle East and Africa Potassium Permanganate Industry Revenue Share (%), by Country 2025 & 2033
- Figure 42: Middle East and Africa Potassium Permanganate Industry Volume Share (%), by Country 2025 & 2033
List of Tables
- Table 1: Global Potassium Permanganate Industry Revenue Million Forecast, by End-user Industry 2020 & 2033
- Table 2: Global Potassium Permanganate Industry Volume Billion Forecast, by End-user Industry 2020 & 2033
- Table 3: Global Potassium Permanganate Industry Revenue Million Forecast, by Region 2020 & 2033
- Table 4: Global Potassium Permanganate Industry Volume Billion Forecast, by Region 2020 & 2033
- Table 5: Global Potassium Permanganate Industry Revenue Million Forecast, by End-user Industry 2020 & 2033
- Table 6: Global Potassium Permanganate Industry Volume Billion Forecast, by End-user Industry 2020 & 2033
- Table 7: Global Potassium Permanganate Industry Revenue Million Forecast, by Country 2020 & 2033
- Table 8: Global Potassium Permanganate Industry Volume Billion Forecast, by Country 2020 & 2033
- Table 9: China Potassium Permanganate Industry Revenue (Million) Forecast, by Application 2020 & 2033
- Table 10: China Potassium Permanganate Industry Volume (Billion) Forecast, by Application 2020 & 2033
- Table 11: India Potassium Permanganate Industry Revenue (Million) Forecast, by Application 2020 & 2033
- Table 12: India Potassium Permanganate Industry Volume (Billion) Forecast, by Application 2020 & 2033
- Table 13: Japan Potassium Permanganate Industry Revenue (Million) Forecast, by Application 2020 & 2033
- Table 14: Japan Potassium Permanganate Industry Volume (Billion) Forecast, by Application 2020 & 2033
- Table 15: South Korea Potassium Permanganate Industry Revenue (Million) Forecast, by Application 2020 & 2033
- Table 16: South Korea Potassium Permanganate Industry Volume (Billion) Forecast, by Application 2020 & 2033
- Table 17: Rest of Asia Pacific Potassium Permanganate Industry Revenue (Million) Forecast, by Application 2020 & 2033
- Table 18: Rest of Asia Pacific Potassium Permanganate Industry Volume (Billion) Forecast, by Application 2020 & 2033
- Table 19: Global Potassium Permanganate Industry Revenue Million Forecast, by End-user Industry 2020 & 2033
- Table 20: Global Potassium Permanganate Industry Volume Billion Forecast, by End-user Industry 2020 & 2033
- Table 21: Global Potassium Permanganate Industry Revenue Million Forecast, by Country 2020 & 2033
- Table 22: Global Potassium Permanganate Industry Volume Billion Forecast, by Country 2020 & 2033
- Table 23: United States Potassium Permanganate Industry Revenue (Million) Forecast, by Application 2020 & 2033
- Table 24: United States Potassium Permanganate Industry Volume (Billion) Forecast, by Application 2020 & 2033
- Table 25: Canada Potassium Permanganate Industry Revenue (Million) Forecast, by Application 2020 & 2033
- Table 26: Canada Potassium Permanganate Industry Volume (Billion) Forecast, by Application 2020 & 2033
- Table 27: Mexico Potassium Permanganate Industry Revenue (Million) Forecast, by Application 2020 & 2033
- Table 28: Mexico Potassium Permanganate Industry Volume (Billion) Forecast, by Application 2020 & 2033
- Table 29: Global Potassium Permanganate Industry Revenue Million Forecast, by End-user Industry 2020 & 2033
- Table 30: Global Potassium Permanganate Industry Volume Billion Forecast, by End-user Industry 2020 & 2033
- Table 31: Global Potassium Permanganate Industry Revenue Million Forecast, by Country 2020 & 2033
- Table 32: Global Potassium Permanganate Industry Volume Billion Forecast, by Country 2020 & 2033
- Table 33: Germany Potassium Permanganate Industry Revenue (Million) Forecast, by Application 2020 & 2033
- Table 34: Germany Potassium Permanganate Industry Volume (Billion) Forecast, by Application 2020 & 2033
- Table 35: United Kingdom Potassium Permanganate Industry Revenue (Million) Forecast, by Application 2020 & 2033
- Table 36: United Kingdom Potassium Permanganate Industry Volume (Billion) Forecast, by Application 2020 & 2033
- Table 37: France Potassium Permanganate Industry Revenue (Million) Forecast, by Application 2020 & 2033
- Table 38: France Potassium Permanganate Industry Volume (Billion) Forecast, by Application 2020 & 2033
- Table 39: Italy Potassium Permanganate Industry Revenue (Million) Forecast, by Application 2020 & 2033
- Table 40: Italy Potassium Permanganate Industry Volume (Billion) Forecast, by Application 2020 & 2033
- Table 41: Rest of Europe Potassium Permanganate Industry Revenue (Million) Forecast, by Application 2020 & 2033
- Table 42: Rest of Europe Potassium Permanganate Industry Volume (Billion) Forecast, by Application 2020 & 2033
- Table 43: Global Potassium Permanganate Industry Revenue Million Forecast, by End-user Industry 2020 & 2033
- Table 44: Global Potassium Permanganate Industry Volume Billion Forecast, by End-user Industry 2020 & 2033
- Table 45: Global Potassium Permanganate Industry Revenue Million Forecast, by Country 2020 & 2033
- Table 46: Global Potassium Permanganate Industry Volume Billion Forecast, by Country 2020 & 2033
- Table 47: Brazil Potassium Permanganate Industry Revenue (Million) Forecast, by Application 2020 & 2033
- Table 48: Brazil Potassium Permanganate Industry Volume (Billion) Forecast, by Application 2020 & 2033
- Table 49: Argentina Potassium Permanganate Industry Revenue (Million) Forecast, by Application 2020 & 2033
- Table 50: Argentina Potassium Permanganate Industry Volume (Billion) Forecast, by Application 2020 & 2033
- Table 51: Rest of South America Potassium Permanganate Industry Revenue (Million) Forecast, by Application 2020 & 2033
- Table 52: Rest of South America Potassium Permanganate Industry Volume (Billion) Forecast, by Application 2020 & 2033
- Table 53: Global Potassium Permanganate Industry Revenue Million Forecast, by End-user Industry 2020 & 2033
- Table 54: Global Potassium Permanganate Industry Volume Billion Forecast, by End-user Industry 2020 & 2033
- Table 55: Global Potassium Permanganate Industry Revenue Million Forecast, by Country 2020 & 2033
- Table 56: Global Potassium Permanganate Industry Volume Billion Forecast, by Country 2020 & 2033
- Table 57: Saudi Arabia Potassium Permanganate Industry Revenue (Million) Forecast, by Application 2020 & 2033
- Table 58: Saudi Arabia Potassium Permanganate Industry Volume (Billion) Forecast, by Application 2020 & 2033
- Table 59: South Africa Potassium Permanganate Industry Revenue (Million) Forecast, by Application 2020 & 2033
- Table 60: South Africa Potassium Permanganate Industry Volume (Billion) Forecast, by Application 2020 & 2033
- Table 61: Rest of Middle East and Africa Potassium Permanganate Industry Revenue (Million) Forecast, by Application 2020 & 2033
- Table 62: Rest of Middle East and Africa Potassium Permanganate Industry Volume (Billion) Forecast, by Application 2020 & 2033
Frequently Asked Questions
1. What is the projected Compound Annual Growth Rate (CAGR) of the Potassium Permanganate Industry?
The projected CAGR is approximately 4.11%.
2. Which companies are prominent players in the Potassium Permanganate Industry?
Key companies in the market include Carus Group Inc, Changsha Yonta, Chongqing Changyuan Group Limited, GFS Chemicals Inc, Guangdong Hangxin Technology Co Ltd, Libox Chem (India) Pvt Ltd, Magnesia, Milport Enterprises Inc, Nippon Chemical Industrial CO LTD, Otto Chemie Pvt Ltd, Univar Solutions Inc, Universal Chemicals & Industries Pvt Ltd *List Not Exhaustive.
3. What are the main segments of the Potassium Permanganate Industry?
The market segments include End-user Industry.
4. Can you provide details about the market size?
The market size is estimated to be USD 0.93 Million as of 2022.
5. What are some drivers contributing to market growth?
Growing Need for High-Quality Water Treatment; Increasing Usage in the Pharmaceutical Industry; Other Drivers.
6. What are the notable trends driving market growth?
Growing Demand from Pharmaceutical Industry.
7. Are there any restraints impacting market growth?
Growing Need for High-Quality Water Treatment; Increasing Usage in the Pharmaceutical Industry; Other Drivers.
8. Can you provide examples of recent developments in the market?
Recent developments in the market studied will be covered in the complete report.
9. What pricing options are available for accessing the report?
Pricing options include single-user, multi-user, and enterprise licenses priced at USD 4750, USD 5250, and USD 8750 respectively.
10. Is the market size provided in terms of value or volume?
The market size is provided in terms of value, measured in Million and volume, measured in Billion.
11. Are there any specific market keywords associated with the report?
Yes, the market keyword associated with the report is "Potassium Permanganate Industry," which aids in identifying and referencing the specific market segment covered.
12. How do I determine which pricing option suits my needs best?
The pricing options vary based on user requirements and access needs. Individual users may opt for single-user licenses, while businesses requiring broader access may choose multi-user or enterprise licenses for cost-effective access to the report.
13. Are there any additional resources or data provided in the Potassium Permanganate Industry report?
While the report offers comprehensive insights, it's advisable to review the specific contents or supplementary materials provided to ascertain if additional resources or data are available.
14. How can I stay updated on further developments or reports in the Potassium Permanganate Industry?
To stay informed about further developments, trends, and reports in the Potassium Permanganate Industry, consider subscribing to industry newsletters, following relevant companies and organizations, or regularly checking reputable industry news sources and publications.
Methodology
Step 1 - Identification of Relevant Samples Size from Population Database


Step 2 - Approaches for Defining Global Market Size (Value, Volume* & Price*)

Note*: In applicable scenarios
Step 3 - Data Sources
Primary Research
- Web Analytics
- Survey Reports
- Research Institute
- Latest Research Reports
- Opinion Leaders
Secondary Research
- Annual Reports
- White Paper
- Latest Press Release
- Industry Association
- Paid Database
- Investor Presentations

Step 4 - Data Triangulation
Involves using different sources of information in order to increase the validity of a study
These sources are likely to be stakeholders in a program - participants, other researchers, program staff, other community members, and so on.
Then we put all data in single framework & apply various statistical tools to find out the dynamic on the market.
During the analysis stage, feedback from the stakeholder groups would be compared to determine areas of agreement as well as areas of divergence