

Key Insights
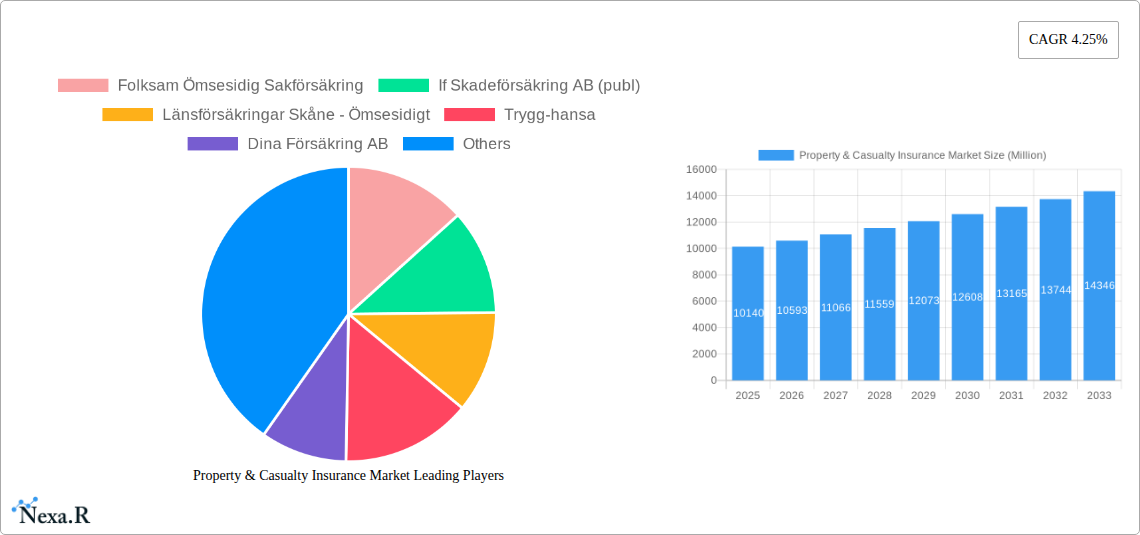
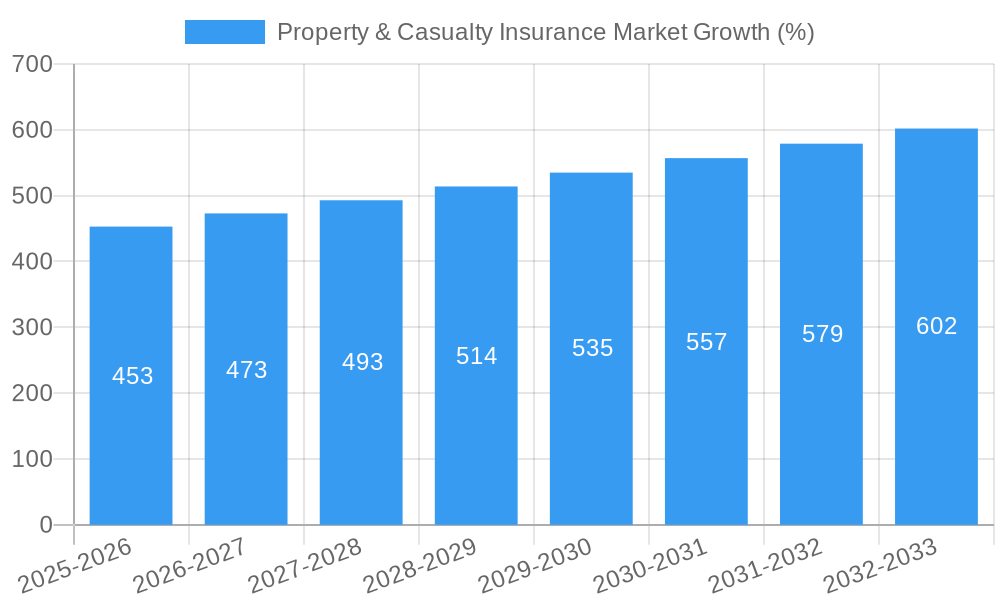
The Swedish Property & Casualty (P&C) insurance market, valued at approximately €10.14 billion in 2025, is projected to experience steady growth, exhibiting a Compound Annual Growth Rate (CAGR) of 4.25% from 2025 to 2033. This growth is driven by several factors. Increasing urbanization and the concentration of assets in densely populated areas heighten vulnerability to property damage from natural disasters and other events, fueling demand for comprehensive coverage. Furthermore, rising awareness of the financial implications of uninsured losses, coupled with increasingly stringent regulatory requirements, encourages greater insurance adoption among both individuals and businesses. Technological advancements, such as the use of telematics and AI in risk assessment and claims processing, contribute to efficiency gains and improved customer experience, further supporting market expansion. Competitive pressures among established players like Folksam, If Skadeförsäkring, and Länsförsäkringar, alongside the emergence of new digital insurers, will likely drive innovation and price competitiveness within the market.
However, the market faces some challenges. Economic fluctuations and potential shifts in government policies could influence consumer spending on insurance. The increasing frequency and severity of climate-related events pose significant risks to insurers, necessitating robust risk management strategies and potentially leading to increased premiums. Successfully navigating these challenges will require insurers to leverage data analytics, develop innovative product offerings tailored to evolving customer needs, and strengthen their risk assessment capabilities to maintain profitability and sustainable growth in the coming years. The market's segmentation is likely diverse, encompassing personal lines (homeowner's, auto), commercial lines (business interruption, liability), and specialized insurance products catered to unique risks within the Swedish context. Further granular market segment analysis would provide more specific insights into growth opportunities within this sector.
Property & Casualty Insurance Market: A Comprehensive Report (2019-2033)
This in-depth report provides a comprehensive analysis of the Property & Casualty (P&C) insurance market, encompassing market dynamics, growth trends, key players, and future outlook. The study period spans from 2019 to 2033, with 2025 serving as the base and estimated year. The report utilizes data from 2019-2024 (historical period) to project market trends from 2025-2033 (forecast period). Values are presented in millions.
Property & Casualty Insurance Market Dynamics & Structure
The P&C insurance market is characterized by a moderately concentrated landscape, with a few major players commanding significant market share. The market structure is influenced by stringent regulatory frameworks, technological advancements (particularly in data analytics and AI), and the presence of competitive product substitutes, such as self-insurance options for certain risks. End-user demographics, particularly the growing middle class in emerging economies and changing risk profiles due to climate change, are shaping demand. M&A activity is significant, with strategic acquisitions driving consolidation and expansion.
- Market Concentration: The top 5 players hold approximately xx% of the market share in 2024, indicating a moderately concentrated market.
- Technological Innovation: Adoption of AI and machine learning for risk assessment and fraud detection is accelerating, although integration challenges and data security concerns remain barriers.
- Regulatory Frameworks: Stringent regulations concerning data privacy, consumer protection, and solvency requirements influence market dynamics significantly. Changes in these regulations can lead to a major shift in the overall market dynamics.
- M&A Trends: The number of M&A deals in the P&C insurance sector averaged xx deals per year between 2019 and 2024, with a total deal value of approximately xx million.
Property & Casualty Insurance Market Growth Trends & Insights
The P&C insurance market witnessed robust growth from 2019 to 2024, with a Compound Annual Growth Rate (CAGR) of xx%. Market size in 2024 is estimated at xx million. This growth can be attributed to increasing urbanization, economic development driving higher insured asset values, and rising awareness of the need for risk mitigation, especially in the context of extreme weather events. Technological advancements, such as telematics and IoT-based insurance solutions, are driving adoption rates and impacting consumer behavior, creating opportunities for personalized offerings. However, economic downturns and increasing competition are influencing market penetration, especially in saturated markets. The forecast period (2025-2033) projects a CAGR of xx%, reaching a market size of xx million by 2033. Consumer behavior shifts towards digital interactions and demand for customized products are key influencing factors in the changing landscape.
Dominant Regions, Countries, or Segments in Property & Casualty Insurance Market
The [Specify Region/Country - e.g., Western Europe] region is currently the dominant market for P&C insurance, accounting for approximately xx% of the global market share in 2024. This dominance is due to several factors:
- High insurance penetration: Existing high level of insurance penetration in Western Europe and developed markets.
- Strong economic growth: Stable economies and robust financial markets support the insurance industry’s growth.
- Developed infrastructure: Robust infrastructure facilitates efficient insurance operations and claims processing.
- Supportive regulatory environment: Established regulatory frameworks ensure market stability and consumer protection.
The [Specify Sub-Segment, e.g., Commercial Property Insurance] segment is also a key growth driver, exhibiting higher growth rates compared to other segments due to increased infrastructural investments, business expansion, and heightened awareness of property risks.
Property & Casualty Insurance Market Product Landscape
The P&C insurance market offers a diverse range of products catering to various customer needs and risk profiles. Recent product innovations focus on personalized risk assessment through telematics and IoT data integration. Usage-based insurance models and bundled solutions are gaining traction, enhancing customer experience and offering customized pricing. Technological advancements, such as AI-powered claims processing and fraud detection, are improving efficiency and reducing operational costs, leading to enhanced customer satisfaction and improved profitability.
Key Drivers, Barriers & Challenges in Property & Casualty Insurance Market
Key Drivers:
- Increasing frequency and severity of natural disasters are driving demand for disaster insurance.
- Growing awareness of cyber risks and data breaches.
- Expansion of the middle class in developing economies.
Key Challenges:
- Intense competition from established and emerging players.
- Regulatory hurdles and compliance requirements.
- Climate change and its impact on insurance pricing and risk assessment (e.g., increased frequency of extreme weather events leading to higher claims payouts).
Emerging Opportunities in Property & Casualty Insurance Market
- Untapped markets: Expanding into underdeveloped markets with low insurance penetration offers substantial growth potential.
- Insurtech: Collaboration with technology companies to develop innovative insurance solutions like parametric insurance.
- Microinsurance: Targeting low-income populations with affordable insurance products.
Growth Accelerators in the Property & Casualty Insurance Market Industry
Technological breakthroughs, such as AI-powered risk assessment and fraud detection, are driving operational efficiency and market expansion. Strategic partnerships between insurance companies and technology providers are fostering innovation and enhancing customer experience. Market expansion into emerging economies through strategic alliances and acquisitions is also expected to accelerate market growth.
Key Players Shaping the Property & Casualty Insurance Market Market
- Folksam Ömsesidig Sakförsäkring
- If Skadeförsäkring AB (publ)
- Länsförsäkringar Skåne - Ömsesidigt
- Trygg-hansa
- Dina Försäkring AB
- Sirius International Försäkrings AB (publ)
- Sveriges Ångfartygs Assurans Förening
- Solid Försäkrings AB
- Stockholms Stads Brandförsäkringskontor
- S:t Erik Försäkring AB
Notable Milestones in Property & Casualty Insurance Market Sector
- September 2022: Trygg Hansa launched animal insurance, expanding its product portfolio and targeting a new customer segment.
- March 2023: Gallagher's acquisition of Brim significantly expanded its presence in the Scandinavian and international P&C insurance markets, particularly in specialized areas like credit and political risk insurance.
In-Depth Property & Casualty Insurance Market Market Outlook
The P&C insurance market is poised for continued growth over the forecast period, driven by technological innovation, expanding product offerings, and penetration into untapped markets. Strategic partnerships and M&A activity will further consolidate the market and create opportunities for industry players to leverage new technologies and expand their reach. The focus on personalized insurance solutions, risk management, and enhanced customer experience will be key to success in the future.
Property & Casualty Insurance Market Segmentation
-
1. Insurance Type
- 1.1. Home Insurance
- 1.2. Auto Insurance
- 1.3. Other Insurance Types
-
2. Distribution Channel
- 2.1. Direct
- 2.2. Agencies
- 2.3. Banks
- 2.4. Other Distribution Channels
Property & Casualty Insurance Market Segmentation By Geography
-
1. North America
- 1.1. United States
- 1.2. Canada
- 1.3. Mexico
-
2. South America
- 2.1. Brazil
- 2.2. Argentina
- 2.3. Rest of South America
-
3. Europe
- 3.1. United Kingdom
- 3.2. Germany
- 3.3. France
- 3.4. Italy
- 3.5. Spain
- 3.6. Russia
- 3.7. Benelux
- 3.8. Nordics
- 3.9. Rest of Europe
-
4. Middle East & Africa
- 4.1. Turkey
- 4.2. Israel
- 4.3. GCC
- 4.4. North Africa
- 4.5. South Africa
- 4.6. Rest of Middle East & Africa
-
5. Asia Pacific
- 5.1. China
- 5.2. India
- 5.3. Japan
- 5.4. South Korea
- 5.5. ASEAN
- 5.6. Oceania
- 5.7. Rest of Asia Pacific
Property & Casualty Insurance Market REPORT HIGHLIGHTS
| Aspects | Details |
|---|---|
| Study Period | 2019-2033 |
| Base Year | 2024 |
| Estimated Year | 2025 |
| Forecast Period | 2025-2033 |
| Historical Period | 2019-2024 |
| Growth Rate | CAGR of 4.25% from 2019-2033 |
| Segmentation |
|
Table of Contents
- 1. Introduction
- 1.1. Research Scope
- 1.2. Market Segmentation
- 1.3. Research Methodology
- 1.4. Definitions and Assumptions
- 2. Executive Summary
- 2.1. Introduction
- 3. Market Dynamics
- 3.1. Introduction
- 3.2. Market Drivers
- 3.3. Market Restrains
- 3.4. Market Trends
- 3.4.1. Motor Insurance Dominates the Non Life Insurance Segment in Sweden
- 4. Market Factor Analysis
- 4.1. Porters Five Forces
- 4.2. Supply/Value Chain
- 4.3. PESTEL analysis
- 4.4. Market Entropy
- 4.5. Patent/Trademark Analysis
- 5. Global Property & Casualty Insurance Market Analysis, Insights and Forecast, 2019-2031
- 5.1. Market Analysis, Insights and Forecast - by Insurance Type
- 5.1.1. Home Insurance
- 5.1.2. Auto Insurance
- 5.1.3. Other Insurance Types
- 5.2. Market Analysis, Insights and Forecast - by Distribution Channel
- 5.2.1. Direct
- 5.2.2. Agencies
- 5.2.3. Banks
- 5.2.4. Other Distribution Channels
- 5.3. Market Analysis, Insights and Forecast - by Region
- 5.3.1. North America
- 5.3.2. South America
- 5.3.3. Europe
- 5.3.4. Middle East & Africa
- 5.3.5. Asia Pacific
- 5.1. Market Analysis, Insights and Forecast - by Insurance Type
- 6. North America Property & Casualty Insurance Market Analysis, Insights and Forecast, 2019-2031
- 6.1. Market Analysis, Insights and Forecast - by Insurance Type
- 6.1.1. Home Insurance
- 6.1.2. Auto Insurance
- 6.1.3. Other Insurance Types
- 6.2. Market Analysis, Insights and Forecast - by Distribution Channel
- 6.2.1. Direct
- 6.2.2. Agencies
- 6.2.3. Banks
- 6.2.4. Other Distribution Channels
- 6.1. Market Analysis, Insights and Forecast - by Insurance Type
- 7. South America Property & Casualty Insurance Market Analysis, Insights and Forecast, 2019-2031
- 7.1. Market Analysis, Insights and Forecast - by Insurance Type
- 7.1.1. Home Insurance
- 7.1.2. Auto Insurance
- 7.1.3. Other Insurance Types
- 7.2. Market Analysis, Insights and Forecast - by Distribution Channel
- 7.2.1. Direct
- 7.2.2. Agencies
- 7.2.3. Banks
- 7.2.4. Other Distribution Channels
- 7.1. Market Analysis, Insights and Forecast - by Insurance Type
- 8. Europe Property & Casualty Insurance Market Analysis, Insights and Forecast, 2019-2031
- 8.1. Market Analysis, Insights and Forecast - by Insurance Type
- 8.1.1. Home Insurance
- 8.1.2. Auto Insurance
- 8.1.3. Other Insurance Types
- 8.2. Market Analysis, Insights and Forecast - by Distribution Channel
- 8.2.1. Direct
- 8.2.2. Agencies
- 8.2.3. Banks
- 8.2.4. Other Distribution Channels
- 8.1. Market Analysis, Insights and Forecast - by Insurance Type
- 9. Middle East & Africa Property & Casualty Insurance Market Analysis, Insights and Forecast, 2019-2031
- 9.1. Market Analysis, Insights and Forecast - by Insurance Type
- 9.1.1. Home Insurance
- 9.1.2. Auto Insurance
- 9.1.3. Other Insurance Types
- 9.2. Market Analysis, Insights and Forecast - by Distribution Channel
- 9.2.1. Direct
- 9.2.2. Agencies
- 9.2.3. Banks
- 9.2.4. Other Distribution Channels
- 9.1. Market Analysis, Insights and Forecast - by Insurance Type
- 10. Asia Pacific Property & Casualty Insurance Market Analysis, Insights and Forecast, 2019-2031
- 10.1. Market Analysis, Insights and Forecast - by Insurance Type
- 10.1.1. Home Insurance
- 10.1.2. Auto Insurance
- 10.1.3. Other Insurance Types
- 10.2. Market Analysis, Insights and Forecast - by Distribution Channel
- 10.2.1. Direct
- 10.2.2. Agencies
- 10.2.3. Banks
- 10.2.4. Other Distribution Channels
- 10.1. Market Analysis, Insights and Forecast - by Insurance Type
- 11. Competitive Analysis
- 11.1. Global Market Share Analysis 2024
- 11.2. Company Profiles
- 11.2.1 Folksam Ömsesidig Sakförsäkring
- 11.2.1.1. Overview
- 11.2.1.2. Products
- 11.2.1.3. SWOT Analysis
- 11.2.1.4. Recent Developments
- 11.2.1.5. Financials (Based on Availability)
- 11.2.2 If Skadeförsäkring AB (publ)
- 11.2.2.1. Overview
- 11.2.2.2. Products
- 11.2.2.3. SWOT Analysis
- 11.2.2.4. Recent Developments
- 11.2.2.5. Financials (Based on Availability)
- 11.2.3 Länsförsäkringar Skåne - Ömsesidigt
- 11.2.3.1. Overview
- 11.2.3.2. Products
- 11.2.3.3. SWOT Analysis
- 11.2.3.4. Recent Developments
- 11.2.3.5. Financials (Based on Availability)
- 11.2.4 Trygg-hansa
- 11.2.4.1. Overview
- 11.2.4.2. Products
- 11.2.4.3. SWOT Analysis
- 11.2.4.4. Recent Developments
- 11.2.4.5. Financials (Based on Availability)
- 11.2.5 Dina Försäkring AB
- 11.2.5.1. Overview
- 11.2.5.2. Products
- 11.2.5.3. SWOT Analysis
- 11.2.5.4. Recent Developments
- 11.2.5.5. Financials (Based on Availability)
- 11.2.6 Sirius International Försäkrings AB (publ)
- 11.2.6.1. Overview
- 11.2.6.2. Products
- 11.2.6.3. SWOT Analysis
- 11.2.6.4. Recent Developments
- 11.2.6.5. Financials (Based on Availability)
- 11.2.7 Sveriges Ångfartygs Assurans Förening
- 11.2.7.1. Overview
- 11.2.7.2. Products
- 11.2.7.3. SWOT Analysis
- 11.2.7.4. Recent Developments
- 11.2.7.5. Financials (Based on Availability)
- 11.2.8 Solid Försäkrings AB
- 11.2.8.1. Overview
- 11.2.8.2. Products
- 11.2.8.3. SWOT Analysis
- 11.2.8.4. Recent Developments
- 11.2.8.5. Financials (Based on Availability)
- 11.2.9 Stockholms Stads Brandförsäkringskontor
- 11.2.9.1. Overview
- 11.2.9.2. Products
- 11.2.9.3. SWOT Analysis
- 11.2.9.4. Recent Developments
- 11.2.9.5. Financials (Based on Availability)
- 11.2.10 S
- 11.2.10.1. Overview
- 11.2.10.2. Products
- 11.2.10.3. SWOT Analysis
- 11.2.10.4. Recent Developments
- 11.2.10.5. Financials (Based on Availability)
- 11.2.1 Folksam Ömsesidig Sakförsäkring
List of Figures
- Figure 1: Global Property & Casualty Insurance Market Revenue Breakdown (Million, %) by Region 2024 & 2032
- Figure 2: Global Property & Casualty Insurance Market Volume Breakdown (Billion, %) by Region 2024 & 2032
- Figure 3: North America Property & Casualty Insurance Market Revenue (Million), by Insurance Type 2024 & 2032
- Figure 4: North America Property & Casualty Insurance Market Volume (Billion), by Insurance Type 2024 & 2032
- Figure 5: North America Property & Casualty Insurance Market Revenue Share (%), by Insurance Type 2024 & 2032
- Figure 6: North America Property & Casualty Insurance Market Volume Share (%), by Insurance Type 2024 & 2032
- Figure 7: North America Property & Casualty Insurance Market Revenue (Million), by Distribution Channel 2024 & 2032
- Figure 8: North America Property & Casualty Insurance Market Volume (Billion), by Distribution Channel 2024 & 2032
- Figure 9: North America Property & Casualty Insurance Market Revenue Share (%), by Distribution Channel 2024 & 2032
- Figure 10: North America Property & Casualty Insurance Market Volume Share (%), by Distribution Channel 2024 & 2032
- Figure 11: North America Property & Casualty Insurance Market Revenue (Million), by Country 2024 & 2032
- Figure 12: North America Property & Casualty Insurance Market Volume (Billion), by Country 2024 & 2032
- Figure 13: North America Property & Casualty Insurance Market Revenue Share (%), by Country 2024 & 2032
- Figure 14: North America Property & Casualty Insurance Market Volume Share (%), by Country 2024 & 2032
- Figure 15: South America Property & Casualty Insurance Market Revenue (Million), by Insurance Type 2024 & 2032
- Figure 16: South America Property & Casualty Insurance Market Volume (Billion), by Insurance Type 2024 & 2032
- Figure 17: South America Property & Casualty Insurance Market Revenue Share (%), by Insurance Type 2024 & 2032
- Figure 18: South America Property & Casualty Insurance Market Volume Share (%), by Insurance Type 2024 & 2032
- Figure 19: South America Property & Casualty Insurance Market Revenue (Million), by Distribution Channel 2024 & 2032
- Figure 20: South America Property & Casualty Insurance Market Volume (Billion), by Distribution Channel 2024 & 2032
- Figure 21: South America Property & Casualty Insurance Market Revenue Share (%), by Distribution Channel 2024 & 2032
- Figure 22: South America Property & Casualty Insurance Market Volume Share (%), by Distribution Channel 2024 & 2032
- Figure 23: South America Property & Casualty Insurance Market Revenue (Million), by Country 2024 & 2032
- Figure 24: South America Property & Casualty Insurance Market Volume (Billion), by Country 2024 & 2032
- Figure 25: South America Property & Casualty Insurance Market Revenue Share (%), by Country 2024 & 2032
- Figure 26: South America Property & Casualty Insurance Market Volume Share (%), by Country 2024 & 2032
- Figure 27: Europe Property & Casualty Insurance Market Revenue (Million), by Insurance Type 2024 & 2032
- Figure 28: Europe Property & Casualty Insurance Market Volume (Billion), by Insurance Type 2024 & 2032
- Figure 29: Europe Property & Casualty Insurance Market Revenue Share (%), by Insurance Type 2024 & 2032
- Figure 30: Europe Property & Casualty Insurance Market Volume Share (%), by Insurance Type 2024 & 2032
- Figure 31: Europe Property & Casualty Insurance Market Revenue (Million), by Distribution Channel 2024 & 2032
- Figure 32: Europe Property & Casualty Insurance Market Volume (Billion), by Distribution Channel 2024 & 2032
- Figure 33: Europe Property & Casualty Insurance Market Revenue Share (%), by Distribution Channel 2024 & 2032
- Figure 34: Europe Property & Casualty Insurance Market Volume Share (%), by Distribution Channel 2024 & 2032
- Figure 35: Europe Property & Casualty Insurance Market Revenue (Million), by Country 2024 & 2032
- Figure 36: Europe Property & Casualty Insurance Market Volume (Billion), by Country 2024 & 2032
- Figure 37: Europe Property & Casualty Insurance Market Revenue Share (%), by Country 2024 & 2032
- Figure 38: Europe Property & Casualty Insurance Market Volume Share (%), by Country 2024 & 2032
- Figure 39: Middle East & Africa Property & Casualty Insurance Market Revenue (Million), by Insurance Type 2024 & 2032
- Figure 40: Middle East & Africa Property & Casualty Insurance Market Volume (Billion), by Insurance Type 2024 & 2032
- Figure 41: Middle East & Africa Property & Casualty Insurance Market Revenue Share (%), by Insurance Type 2024 & 2032
- Figure 42: Middle East & Africa Property & Casualty Insurance Market Volume Share (%), by Insurance Type 2024 & 2032
- Figure 43: Middle East & Africa Property & Casualty Insurance Market Revenue (Million), by Distribution Channel 2024 & 2032
- Figure 44: Middle East & Africa Property & Casualty Insurance Market Volume (Billion), by Distribution Channel 2024 & 2032
- Figure 45: Middle East & Africa Property & Casualty Insurance Market Revenue Share (%), by Distribution Channel 2024 & 2032
- Figure 46: Middle East & Africa Property & Casualty Insurance Market Volume Share (%), by Distribution Channel 2024 & 2032
- Figure 47: Middle East & Africa Property & Casualty Insurance Market Revenue (Million), by Country 2024 & 2032
- Figure 48: Middle East & Africa Property & Casualty Insurance Market Volume (Billion), by Country 2024 & 2032
- Figure 49: Middle East & Africa Property & Casualty Insurance Market Revenue Share (%), by Country 2024 & 2032
- Figure 50: Middle East & Africa Property & Casualty Insurance Market Volume Share (%), by Country 2024 & 2032
- Figure 51: Asia Pacific Property & Casualty Insurance Market Revenue (Million), by Insurance Type 2024 & 2032
- Figure 52: Asia Pacific Property & Casualty Insurance Market Volume (Billion), by Insurance Type 2024 & 2032
- Figure 53: Asia Pacific Property & Casualty Insurance Market Revenue Share (%), by Insurance Type 2024 & 2032
- Figure 54: Asia Pacific Property & Casualty Insurance Market Volume Share (%), by Insurance Type 2024 & 2032
- Figure 55: Asia Pacific Property & Casualty Insurance Market Revenue (Million), by Distribution Channel 2024 & 2032
- Figure 56: Asia Pacific Property & Casualty Insurance Market Volume (Billion), by Distribution Channel 2024 & 2032
- Figure 57: Asia Pacific Property & Casualty Insurance Market Revenue Share (%), by Distribution Channel 2024 & 2032
- Figure 58: Asia Pacific Property & Casualty Insurance Market Volume Share (%), by Distribution Channel 2024 & 2032
- Figure 59: Asia Pacific Property & Casualty Insurance Market Revenue (Million), by Country 2024 & 2032
- Figure 60: Asia Pacific Property & Casualty Insurance Market Volume (Billion), by Country 2024 & 2032
- Figure 61: Asia Pacific Property & Casualty Insurance Market Revenue Share (%), by Country 2024 & 2032
- Figure 62: Asia Pacific Property & Casualty Insurance Market Volume Share (%), by Country 2024 & 2032
List of Tables
- Table 1: Global Property & Casualty Insurance Market Revenue Million Forecast, by Region 2019 & 2032
- Table 2: Global Property & Casualty Insurance Market Volume Billion Forecast, by Region 2019 & 2032
- Table 3: Global Property & Casualty Insurance Market Revenue Million Forecast, by Insurance Type 2019 & 2032
- Table 4: Global Property & Casualty Insurance Market Volume Billion Forecast, by Insurance Type 2019 & 2032
- Table 5: Global Property & Casualty Insurance Market Revenue Million Forecast, by Distribution Channel 2019 & 2032
- Table 6: Global Property & Casualty Insurance Market Volume Billion Forecast, by Distribution Channel 2019 & 2032
- Table 7: Global Property & Casualty Insurance Market Revenue Million Forecast, by Region 2019 & 2032
- Table 8: Global Property & Casualty Insurance Market Volume Billion Forecast, by Region 2019 & 2032
- Table 9: Global Property & Casualty Insurance Market Revenue Million Forecast, by Insurance Type 2019 & 2032
- Table 10: Global Property & Casualty Insurance Market Volume Billion Forecast, by Insurance Type 2019 & 2032
- Table 11: Global Property & Casualty Insurance Market Revenue Million Forecast, by Distribution Channel 2019 & 2032
- Table 12: Global Property & Casualty Insurance Market Volume Billion Forecast, by Distribution Channel 2019 & 2032
- Table 13: Global Property & Casualty Insurance Market Revenue Million Forecast, by Country 2019 & 2032
- Table 14: Global Property & Casualty Insurance Market Volume Billion Forecast, by Country 2019 & 2032
- Table 15: United States Property & Casualty Insurance Market Revenue (Million) Forecast, by Application 2019 & 2032
- Table 16: United States Property & Casualty Insurance Market Volume (Billion) Forecast, by Application 2019 & 2032
- Table 17: Canada Property & Casualty Insurance Market Revenue (Million) Forecast, by Application 2019 & 2032
- Table 18: Canada Property & Casualty Insurance Market Volume (Billion) Forecast, by Application 2019 & 2032
- Table 19: Mexico Property & Casualty Insurance Market Revenue (Million) Forecast, by Application 2019 & 2032
- Table 20: Mexico Property & Casualty Insurance Market Volume (Billion) Forecast, by Application 2019 & 2032
- Table 21: Global Property & Casualty Insurance Market Revenue Million Forecast, by Insurance Type 2019 & 2032
- Table 22: Global Property & Casualty Insurance Market Volume Billion Forecast, by Insurance Type 2019 & 2032
- Table 23: Global Property & Casualty Insurance Market Revenue Million Forecast, by Distribution Channel 2019 & 2032
- Table 24: Global Property & Casualty Insurance Market Volume Billion Forecast, by Distribution Channel 2019 & 2032
- Table 25: Global Property & Casualty Insurance Market Revenue Million Forecast, by Country 2019 & 2032
- Table 26: Global Property & Casualty Insurance Market Volume Billion Forecast, by Country 2019 & 2032
- Table 27: Brazil Property & Casualty Insurance Market Revenue (Million) Forecast, by Application 2019 & 2032
- Table 28: Brazil Property & Casualty Insurance Market Volume (Billion) Forecast, by Application 2019 & 2032
- Table 29: Argentina Property & Casualty Insurance Market Revenue (Million) Forecast, by Application 2019 & 2032
- Table 30: Argentina Property & Casualty Insurance Market Volume (Billion) Forecast, by Application 2019 & 2032
- Table 31: Rest of South America Property & Casualty Insurance Market Revenue (Million) Forecast, by Application 2019 & 2032
- Table 32: Rest of South America Property & Casualty Insurance Market Volume (Billion) Forecast, by Application 2019 & 2032
- Table 33: Global Property & Casualty Insurance Market Revenue Million Forecast, by Insurance Type 2019 & 2032
- Table 34: Global Property & Casualty Insurance Market Volume Billion Forecast, by Insurance Type 2019 & 2032
- Table 35: Global Property & Casualty Insurance Market Revenue Million Forecast, by Distribution Channel 2019 & 2032
- Table 36: Global Property & Casualty Insurance Market Volume Billion Forecast, by Distribution Channel 2019 & 2032
- Table 37: Global Property & Casualty Insurance Market Revenue Million Forecast, by Country 2019 & 2032
- Table 38: Global Property & Casualty Insurance Market Volume Billion Forecast, by Country 2019 & 2032
- Table 39: United Kingdom Property & Casualty Insurance Market Revenue (Million) Forecast, by Application 2019 & 2032
- Table 40: United Kingdom Property & Casualty Insurance Market Volume (Billion) Forecast, by Application 2019 & 2032
- Table 41: Germany Property & Casualty Insurance Market Revenue (Million) Forecast, by Application 2019 & 2032
- Table 42: Germany Property & Casualty Insurance Market Volume (Billion) Forecast, by Application 2019 & 2032
- Table 43: France Property & Casualty Insurance Market Revenue (Million) Forecast, by Application 2019 & 2032
- Table 44: France Property & Casualty Insurance Market Volume (Billion) Forecast, by Application 2019 & 2032
- Table 45: Italy Property & Casualty Insurance Market Revenue (Million) Forecast, by Application 2019 & 2032
- Table 46: Italy Property & Casualty Insurance Market Volume (Billion) Forecast, by Application 2019 & 2032
- Table 47: Spain Property & Casualty Insurance Market Revenue (Million) Forecast, by Application 2019 & 2032
- Table 48: Spain Property & Casualty Insurance Market Volume (Billion) Forecast, by Application 2019 & 2032
- Table 49: Russia Property & Casualty Insurance Market Revenue (Million) Forecast, by Application 2019 & 2032
- Table 50: Russia Property & Casualty Insurance Market Volume (Billion) Forecast, by Application 2019 & 2032
- Table 51: Benelux Property & Casualty Insurance Market Revenue (Million) Forecast, by Application 2019 & 2032
- Table 52: Benelux Property & Casualty Insurance Market Volume (Billion) Forecast, by Application 2019 & 2032
- Table 53: Nordics Property & Casualty Insurance Market Revenue (Million) Forecast, by Application 2019 & 2032
- Table 54: Nordics Property & Casualty Insurance Market Volume (Billion) Forecast, by Application 2019 & 2032
- Table 55: Rest of Europe Property & Casualty Insurance Market Revenue (Million) Forecast, by Application 2019 & 2032
- Table 56: Rest of Europe Property & Casualty Insurance Market Volume (Billion) Forecast, by Application 2019 & 2032
- Table 57: Global Property & Casualty Insurance Market Revenue Million Forecast, by Insurance Type 2019 & 2032
- Table 58: Global Property & Casualty Insurance Market Volume Billion Forecast, by Insurance Type 2019 & 2032
- Table 59: Global Property & Casualty Insurance Market Revenue Million Forecast, by Distribution Channel 2019 & 2032
- Table 60: Global Property & Casualty Insurance Market Volume Billion Forecast, by Distribution Channel 2019 & 2032
- Table 61: Global Property & Casualty Insurance Market Revenue Million Forecast, by Country 2019 & 2032
- Table 62: Global Property & Casualty Insurance Market Volume Billion Forecast, by Country 2019 & 2032
- Table 63: Turkey Property & Casualty Insurance Market Revenue (Million) Forecast, by Application 2019 & 2032
- Table 64: Turkey Property & Casualty Insurance Market Volume (Billion) Forecast, by Application 2019 & 2032
- Table 65: Israel Property & Casualty Insurance Market Revenue (Million) Forecast, by Application 2019 & 2032
- Table 66: Israel Property & Casualty Insurance Market Volume (Billion) Forecast, by Application 2019 & 2032
- Table 67: GCC Property & Casualty Insurance Market Revenue (Million) Forecast, by Application 2019 & 2032
- Table 68: GCC Property & Casualty Insurance Market Volume (Billion) Forecast, by Application 2019 & 2032
- Table 69: North Africa Property & Casualty Insurance Market Revenue (Million) Forecast, by Application 2019 & 2032
- Table 70: North Africa Property & Casualty Insurance Market Volume (Billion) Forecast, by Application 2019 & 2032
- Table 71: South Africa Property & Casualty Insurance Market Revenue (Million) Forecast, by Application 2019 & 2032
- Table 72: South Africa Property & Casualty Insurance Market Volume (Billion) Forecast, by Application 2019 & 2032
- Table 73: Rest of Middle East & Africa Property & Casualty Insurance Market Revenue (Million) Forecast, by Application 2019 & 2032
- Table 74: Rest of Middle East & Africa Property & Casualty Insurance Market Volume (Billion) Forecast, by Application 2019 & 2032
- Table 75: Global Property & Casualty Insurance Market Revenue Million Forecast, by Insurance Type 2019 & 2032
- Table 76: Global Property & Casualty Insurance Market Volume Billion Forecast, by Insurance Type 2019 & 2032
- Table 77: Global Property & Casualty Insurance Market Revenue Million Forecast, by Distribution Channel 2019 & 2032
- Table 78: Global Property & Casualty Insurance Market Volume Billion Forecast, by Distribution Channel 2019 & 2032
- Table 79: Global Property & Casualty Insurance Market Revenue Million Forecast, by Country 2019 & 2032
- Table 80: Global Property & Casualty Insurance Market Volume Billion Forecast, by Country 2019 & 2032
- Table 81: China Property & Casualty Insurance Market Revenue (Million) Forecast, by Application 2019 & 2032
- Table 82: China Property & Casualty Insurance Market Volume (Billion) Forecast, by Application 2019 & 2032
- Table 83: India Property & Casualty Insurance Market Revenue (Million) Forecast, by Application 2019 & 2032
- Table 84: India Property & Casualty Insurance Market Volume (Billion) Forecast, by Application 2019 & 2032
- Table 85: Japan Property & Casualty Insurance Market Revenue (Million) Forecast, by Application 2019 & 2032
- Table 86: Japan Property & Casualty Insurance Market Volume (Billion) Forecast, by Application 2019 & 2032
- Table 87: South Korea Property & Casualty Insurance Market Revenue (Million) Forecast, by Application 2019 & 2032
- Table 88: South Korea Property & Casualty Insurance Market Volume (Billion) Forecast, by Application 2019 & 2032
- Table 89: ASEAN Property & Casualty Insurance Market Revenue (Million) Forecast, by Application 2019 & 2032
- Table 90: ASEAN Property & Casualty Insurance Market Volume (Billion) Forecast, by Application 2019 & 2032
- Table 91: Oceania Property & Casualty Insurance Market Revenue (Million) Forecast, by Application 2019 & 2032
- Table 92: Oceania Property & Casualty Insurance Market Volume (Billion) Forecast, by Application 2019 & 2032
- Table 93: Rest of Asia Pacific Property & Casualty Insurance Market Revenue (Million) Forecast, by Application 2019 & 2032
- Table 94: Rest of Asia Pacific Property & Casualty Insurance Market Volume (Billion) Forecast, by Application 2019 & 2032
Frequently Asked Questions
1. What is the projected Compound Annual Growth Rate (CAGR) of the Property & Casualty Insurance Market?
The projected CAGR is approximately 4.25%.
2. Which companies are prominent players in the Property & Casualty Insurance Market?
Key companies in the market include Folksam Ömsesidig Sakförsäkring, If Skadeförsäkring AB (publ), Länsförsäkringar Skåne - Ömsesidigt, Trygg-hansa, Dina Försäkring AB, Sirius International Försäkrings AB (publ), Sveriges Ångfartygs Assurans Förening, Solid Försäkrings AB, Stockholms Stads Brandförsäkringskontor, S:t Erik Försäkrings AB**List Not Exhaustive.
3. What are the main segments of the Property & Casualty Insurance Market?
The market segments include Insurance Type, Distribution Channel.
4. Can you provide details about the market size?
The market size is estimated to be USD 10.14 Million as of 2022.
5. What are some drivers contributing to market growth?
N/A
6. What are the notable trends driving market growth?
Motor Insurance Dominates the Non Life Insurance Segment in Sweden.
7. Are there any restraints impacting market growth?
N/A
8. Can you provide examples of recent developments in the market?
March 2023: Gallagher acquired Brim, a specialty insurance and reinsurance broker that provides property/casualty insurance, credit and political risk, and affinity insurance products and services to its Scandinavian and international clients. Its credit and political risk practice provides financing support for major infrastructure projects, while its construction practice supports residential and commercial building development.
9. What pricing options are available for accessing the report?
Pricing options include single-user, multi-user, and enterprise licenses priced at USD 3800, USD 4500, and USD 5800 respectively.
10. Is the market size provided in terms of value or volume?
The market size is provided in terms of value, measured in Million and volume, measured in Billion.
11. Are there any specific market keywords associated with the report?
Yes, the market keyword associated with the report is "Property & Casualty Insurance Market," which aids in identifying and referencing the specific market segment covered.
12. How do I determine which pricing option suits my needs best?
The pricing options vary based on user requirements and access needs. Individual users may opt for single-user licenses, while businesses requiring broader access may choose multi-user or enterprise licenses for cost-effective access to the report.
13. Are there any additional resources or data provided in the Property & Casualty Insurance Market report?
While the report offers comprehensive insights, it's advisable to review the specific contents or supplementary materials provided to ascertain if additional resources or data are available.
14. How can I stay updated on further developments or reports in the Property & Casualty Insurance Market?
To stay informed about further developments, trends, and reports in the Property & Casualty Insurance Market, consider subscribing to industry newsletters, following relevant companies and organizations, or regularly checking reputable industry news sources and publications.
Methodology
Step 1 - Identification of Relevant Samples Size from Population Database


Step 2 - Approaches for Defining Global Market Size (Value, Volume* & Price*)

Note*: In applicable scenarios
Step 3 - Data Sources
Primary Research
- Web Analytics
- Survey Reports
- Research Institute
- Latest Research Reports
- Opinion Leaders
Secondary Research
- Annual Reports
- White Paper
- Latest Press Release
- Industry Association
- Paid Database
- Investor Presentations

Step 4 - Data Triangulation
Involves using different sources of information in order to increase the validity of a study
These sources are likely to be stakeholders in a program - participants, other researchers, program staff, other community members, and so on.
Then we put all data in single framework & apply various statistical tools to find out the dynamic on the market.
During the analysis stage, feedback from the stakeholder groups would be compared to determine areas of agreement as well as areas of divergence
