

Key Insights
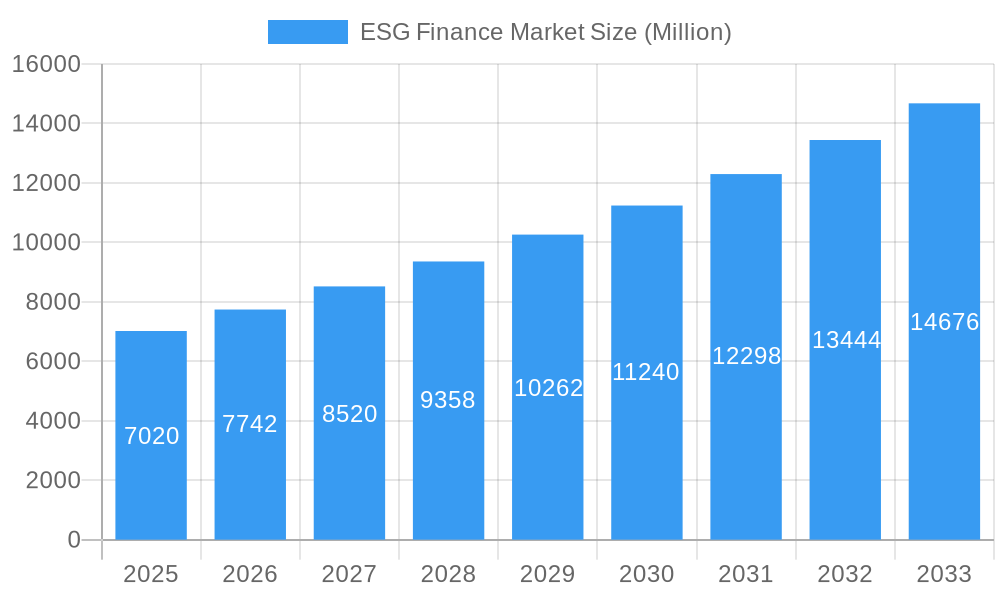
The ESG (Environmental, Social, and Governance) Finance market is experiencing robust growth, projected to reach a market size of $7.02 billion in 2025, expanding at a compound annual growth rate (CAGR) of 10.04%. This significant expansion is driven by increasing investor awareness of ESG factors, stricter regulatory frameworks demanding greater transparency and accountability from companies, and growing consumer demand for ethical and sustainable investment options. The rising prevalence of climate change concerns, coupled with a greater understanding of the financial implications of social and governance issues, is further fueling market expansion. Key players such as BlackRock, State Street, and JPMorgan Chase are leading this charge, developing innovative ESG-focused products and services to cater to the burgeoning demand. However, challenges remain, including the complexities of data collection and standardization in ESG reporting, and the potential for greenwashing, where companies make misleading or exaggerated claims about their ESG performance. Overcoming these obstacles will be crucial for ensuring the continued growth and credibility of the ESG finance sector.
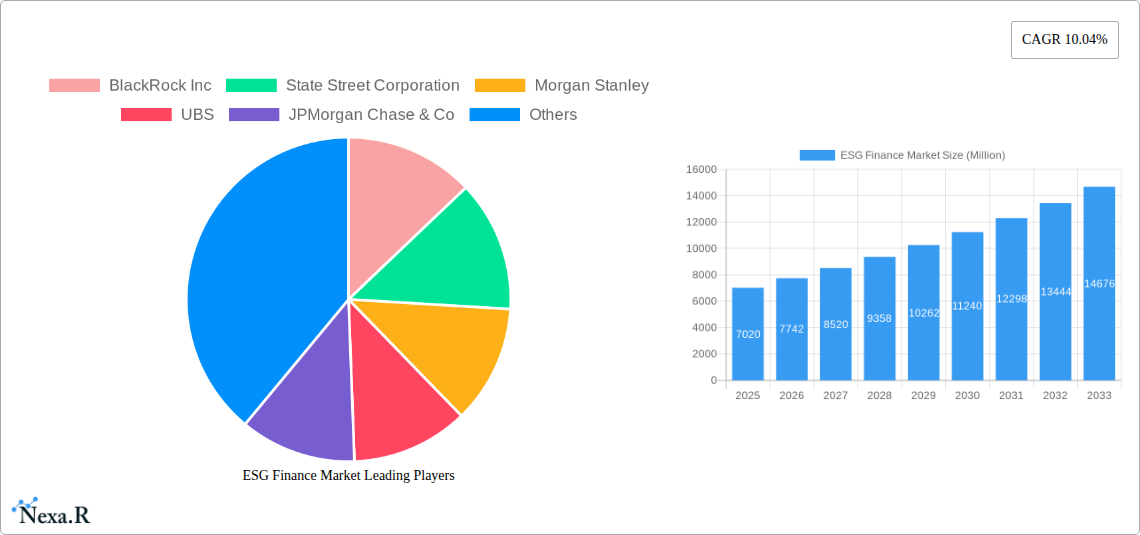
ESG Finance Market Market Size (In Billion)
The forecast period from 2025 to 2033 anticipates sustained growth, with substantial expansion projected across various segments. While specific segment data is unavailable, we can infer significant growth within areas such as sustainable bonds, green loans, and ESG-integrated investment strategies. The geographical distribution of the market is likely diversified, with North America and Europe holding substantial shares initially, though emerging markets are poised for accelerated growth driven by increasing government initiatives and rising investor interest. The competitive landscape features significant players across asset management, banking, and investment advisory services. Continued innovation in data analytics and technology will be instrumental in improving ESG data transparency and driving the market’s long-term expansion.
ESG Finance Market Company Market Share
ESG Finance Market: A Comprehensive Report (2019-2033)
This comprehensive report provides a detailed analysis of the ESG (Environmental, Social, and Governance) Finance Market, encompassing market dynamics, growth trends, regional dominance, product landscape, key players, and future outlook. The study period covers 2019-2033, with 2025 as the base and estimated year. The report leverages proprietary data and industry expertise to offer actionable insights for investors, financial institutions, and ESG stakeholders. The parent market is the broader finance market, while the child market is specifically focused on ESG-integrated financial products and services. The market size is projected to reach xx Million by 2033.
ESG Finance Market Dynamics & Structure
The ESG finance market is characterized by a moderately concentrated structure with several key players holding significant market share. BlackRock Inc., State Street Corporation, Morgan Stanley, UBS, JPMorgan Chase & Co., and others dominate the landscape, although smaller niche players are emerging. Technological innovations, particularly in data analytics and ESG rating methodologies, are driving market growth. Stringent regulatory frameworks, such as the EU's Sustainable Finance Disclosure Regulation (SFDR) and similar initiatives globally, are shaping market practices and fostering increased transparency. Competitive product substitutes are limited, as the unique focus on ESG factors differentiates these products from traditional financial offerings. The end-user demographic is expanding to encompass institutional investors, retail investors, and corporations increasingly integrating ESG considerations into their financial strategies. High M&A activity indicates the growing importance of the ESG sector, with an estimated xx Million in deal volume during the historical period.
- Market Concentration: Highly concentrated with top 10 players holding approximately xx% of the market share in 2024.
- Technological Innovation: AI-powered ESG analytics, blockchain for transparency, and improved data management are key drivers.
- Regulatory Framework: Increasingly stringent regulations are driving adoption and standardizing ESG reporting.
- M&A Activity: Significant M&A activity observed (e.g., State Street's acquisition of CF Global Trading), reflecting market consolidation and growth potential. xx number of deals in the historical period.
- Innovation Barriers: Data standardization challenges, lack of universally accepted ESG metrics, and concerns about 'greenwashing' present challenges.
ESG Finance Market Growth Trends & Insights
The ESG finance market experienced robust growth during the historical period (2019-2024), driven by growing investor interest in sustainable investments and increasing regulatory pressure. Market size expanded from xx Million in 2019 to xx Million in 2024, reflecting a CAGR of xx%. Adoption rates are increasing across various asset classes, including equities, bonds, and private equity. Technological disruptions, such as the development of sophisticated ESG data analytics platforms, have streamlined the investment process and broadened access to ESG-related information. Consumer behavior shifts are evident, with a growing preference for ethically and environmentally responsible investments among both institutional and retail investors. Market penetration is projected to reach xx% by 2033. The overall market is expected to continue its growth trajectory, with a projected CAGR of xx% during the forecast period (2025-2033).
Dominant Regions, Countries, or Segments in ESG Finance Market
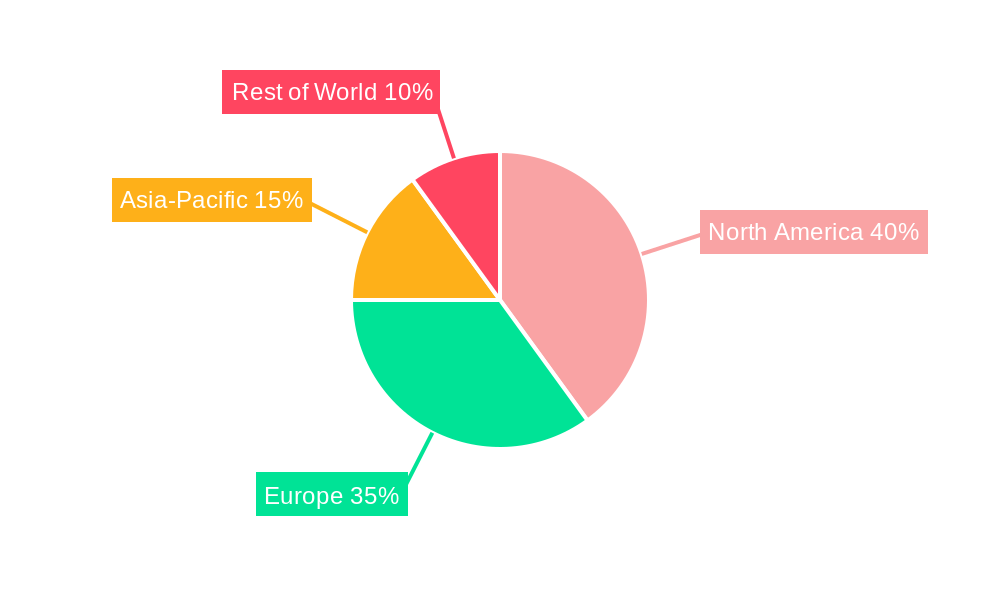
The North American region currently holds the largest market share within the ESG finance market, followed by Europe. This dominance is attributed to several factors: established financial markets, strong regulatory frameworks promoting sustainable investments, and significant capital flows towards ESG-focused initiatives. Within Europe, the UK and Germany are leading markets, driven by strong government policies and investor interest. Asia-Pacific is a rapidly growing region, with increasing awareness and adoption of ESG principles, although regulatory frameworks are still evolving.
- North America: Strong regulatory environment, significant investor capital, and established financial infrastructure.
- Europe: Progressive regulatory frameworks (e.g., SFDR) and high investor demand for sustainable investments.
- Asia-Pacific: Rapid growth potential driven by increasing awareness and government initiatives, though regulatory landscape is still maturing.
- Key Growth Drivers: Stringent regulations, investor pressure for transparency, growing awareness of environmental and social issues.
ESG Finance Market Product Landscape
The ESG finance market offers a diverse range of products, including ESG-integrated mutual funds, ETFs, green bonds, and sustainable loans. Innovation is focused on enhancing data transparency, developing robust ESG rating methodologies, and creating more sophisticated investment strategies. Product performance metrics are becoming increasingly standardized, facilitating comparison and analysis. Unique selling propositions often focus on specific ESG themes (e.g., renewable energy, climate change mitigation) or on innovative investment approaches. Technological advancements, such as AI-powered portfolio optimization tools, are improving risk management and investment performance.
Key Drivers, Barriers & Challenges in ESG Finance Market
Key Drivers: Growing investor demand for sustainable investments; increasing regulatory pressure; heightened awareness of environmental, social, and governance issues; technological advancements enabling more efficient ESG data analysis and reporting.
Key Barriers and Challenges: Data quality and standardization issues; difficulty in accurately measuring and comparing ESG performance; concerns about "greenwashing"; high implementation costs; lack of universally accepted ESG metrics. These challenges result in an estimated xx Million in lost revenue annually.
Emerging Opportunities in ESG Finance Market
Emerging opportunities include the growth of impact investing, the development of innovative financial products tailored to specific ESG themes (e.g., biodiversity, circular economy), and the expansion into emerging markets. The increasing integration of ESG factors into mainstream finance is also opening up new avenues for growth. The increasing demand for ESG data and analytics creates significant opportunities for technology providers.
Growth Accelerators in the ESG Finance Market Industry
Technological advancements in data analytics, AI, and blockchain are key growth accelerators. Strategic partnerships between financial institutions and technology providers are driving innovation. The expansion of ESG-related regulatory frameworks and increased investor awareness of ESG issues further accelerates market growth. Expansion into underserved markets and the development of new financial instruments focused on specific ESG themes also contribute to growth.
Key Players Shaping the ESG Finance Market Market
Notable Milestones in ESG Finance Market Sector
- October 2023: Morgan Stanley Investment Management (MSIM) acquired Sacyr S.A.
- January 2024: BlackRock, Inc. acquired Global Infrastructure Partners for USD 3 billion and approximately 12 million BlackRock common shares.
- February 2024: State Street Corporation acquired CF Global Trading.
In-Depth ESG Finance Market Market Outlook
The ESG finance market is poised for continued strong growth, driven by a confluence of factors including increasing investor demand, stricter regulations, technological advancements, and a heightened focus on sustainability. The market presents significant opportunities for financial institutions, technology providers, and other stakeholders to capitalize on the growing adoption of ESG principles across various sectors. Strategic partnerships, innovation in ESG data analytics, and expansion into emerging markets will be critical for success in this rapidly evolving landscape. The long-term outlook is highly positive, with significant potential for market expansion and the development of innovative financial solutions that address global sustainability challenges.
ESG Finance Market Segmentation
-
1. Investment Type
- 1.1. Equity, Fixed Income, Mixed Allocation
- 1.2. Other Investment Types
-
2. Transaction Type
- 2.1. Green Bond
- 2.2. Social Bond
- 2.3. Mixed Sustainability Bond
- 2.4. ESG Integrated Investment Funds
- 2.5. Other Transaction Types
-
3. Investor Type
- 3.1. Institutional Investors
- 3.2. Retail Investors
-
4. Industry Vertical
- 4.1. Utilities
- 4.2. Transport & Logistics
- 4.3. Chemicals
- 4.4. Food and Beverage
- 4.5. Government
- 4.6. Other Industry Verticals
-
5. North America
- 5.1. United States
- 5.2. Canada
- 5.3. Mexico
- 5.4. Rest of North America
-
6. Europe
- 6.1. United Kingdom
- 6.2. Germany
- 6.3. France
- 6.4. Russia
- 6.5. Italy
- 6.6. Spain
- 6.7. Rest of Europe
-
7. Asia-Pacific
- 7.1. India
- 7.2. China
- 7.3. Japan
- 7.4. Australia
- 7.5. Rest of Asia-Pacific
-
8. South America
- 8.1. Brazil
- 8.2. Argentina
- 8.3. Rest of South America
-
9. Middle-East and Africa
- 9.1. United Arab Emirates
- 9.2. South Africa
- 9.3. Rest of Middle-East and Africa
ESG Finance Market Segmentation By Geography
-
1. North America
- 1.1. United States
- 1.2. Canada
- 1.3. Mexico
-
2. South America
- 2.1. Brazil
- 2.2. Argentina
- 2.3. Rest of South America
-
3. Europe
- 3.1. United Kingdom
- 3.2. Germany
- 3.3. France
- 3.4. Italy
- 3.5. Spain
- 3.6. Russia
- 3.7. Benelux
- 3.8. Nordics
- 3.9. Rest of Europe
-
4. Middle East & Africa
- 4.1. Turkey
- 4.2. Israel
- 4.3. GCC
- 4.4. North Africa
- 4.5. South Africa
- 4.6. Rest of Middle East & Africa
-
5. Asia Pacific
- 5.1. China
- 5.2. India
- 5.3. Japan
- 5.4. South Korea
- 5.5. ASEAN
- 5.6. Oceania
- 5.7. Rest of Asia Pacific
ESG Finance Market Regional Market Share
Geographic Coverage of ESG Finance Market
ESG Finance Market REPORT HIGHLIGHTS
| Aspects | Details |
|---|---|
| Study Period | 2020-2034 |
| Base Year | 2025 |
| Estimated Year | 2026 |
| Forecast Period | 2026-2034 |
| Historical Period | 2020-2025 |
| Growth Rate | CAGR of 10.04% from 2020-2034 |
| Segmentation |
|
Table of Contents
- 1. Introduction
- 1.1. Research Scope
- 1.2. Market Segmentation
- 1.3. Research Objective
- 1.4. Definitions and Assumptions
- 2. Executive Summary
- 2.1. Market Snapshot
- 3. Market Dynamics
- 3.1. Market Drivers
- 3.2. Market Restrains
- 3.3. Market Trends
- 3.4. Market Opportunities
- 4. Market Factor Analysis
- 4.1. Porters Five Forces
- 4.1.1. Bargaining Power of Suppliers
- 4.1.2. Bargaining Power of Buyers
- 4.1.3. Threat of New Entrants
- 4.1.4. Threat of Substitutes
- 4.1.5. Competitive Rivalry
- 4.2. PESTEL analysis
- 4.3. BCG Analysis
- 4.3.1. Stars (High Growth, High Market Share)
- 4.3.2. Cash Cows (Low Growth, High Market Share)
- 4.3.3. Question Mark (High Growth, Low Market Share)
- 4.3.4. Dogs (Low Growth, Low Market Share)
- 4.4. Ansoff Matrix Analysis
- 4.5. Supply Chain Analysis
- 4.6. Regulatory Landscape
- 4.7. Current Market Potential and Opportunity Assessment (TAM–SAM–SOM Framework)
- 4.8. NRP Analyst Note
- 4.1. Porters Five Forces
- 5. Market Analysis, Insights and Forecast 2021-2033
- 5.1. Market Analysis, Insights and Forecast - by Investment Type
- 5.1.1. Equity, Fixed Income, Mixed Allocation
- 5.1.2. Other Investment Types
- 5.2. Market Analysis, Insights and Forecast - by Transaction Type
- 5.2.1. Green Bond
- 5.2.2. Social Bond
- 5.2.3. Mixed Sustainability Bond
- 5.2.4. ESG Integrated Investment Funds
- 5.2.5. Other Transaction Types
- 5.3. Market Analysis, Insights and Forecast - by Investor Type
- 5.3.1. Institutional Investors
- 5.3.2. Retail Investors
- 5.4. Market Analysis, Insights and Forecast - by Industry Vertical
- 5.4.1. Utilities
- 5.4.2. Transport & Logistics
- 5.4.3. Chemicals
- 5.4.4. Food and Beverage
- 5.4.5. Government
- 5.4.6. Other Industry Verticals
- 5.5. Market Analysis, Insights and Forecast - by North America
- 5.5.1. United States
- 5.5.2. Canada
- 5.5.3. Mexico
- 5.5.4. Rest of North America
- 5.6. Market Analysis, Insights and Forecast - by Europe
- 5.6.1. United Kingdom
- 5.6.2. Germany
- 5.6.3. France
- 5.6.4. Russia
- 5.6.5. Italy
- 5.6.6. Spain
- 5.6.7. Rest of Europe
- 5.7. Market Analysis, Insights and Forecast - by Asia-Pacific
- 5.7.1. India
- 5.7.2. China
- 5.7.3. Japan
- 5.7.4. Australia
- 5.7.5. Rest of Asia-Pacific
- 5.8. Market Analysis, Insights and Forecast - by South America
- 5.8.1. Brazil
- 5.8.2. Argentina
- 5.8.3. Rest of South America
- 5.9. Market Analysis, Insights and Forecast - by Middle-East and Africa
- 5.9.1. United Arab Emirates
- 5.9.2. South Africa
- 5.9.3. Rest of Middle-East and Africa
- 5.10. Market Analysis, Insights and Forecast - by Region
- 5.10.1. North America
- 5.10.2. South America
- 5.10.3. Europe
- 5.10.4. Middle East & Africa
- 5.10.5. Asia Pacific
- 5.1. Market Analysis, Insights and Forecast - by Investment Type
- 6. Global ESG Finance Market Analysis, Insights and Forecast, 2021-2033
- 6.1. Market Analysis, Insights and Forecast - by Investment Type
- 6.1.1. Equity, Fixed Income, Mixed Allocation
- 6.1.2. Other Investment Types
- 6.2. Market Analysis, Insights and Forecast - by Transaction Type
- 6.2.1. Green Bond
- 6.2.2. Social Bond
- 6.2.3. Mixed Sustainability Bond
- 6.2.4. ESG Integrated Investment Funds
- 6.2.5. Other Transaction Types
- 6.3. Market Analysis, Insights and Forecast - by Investor Type
- 6.3.1. Institutional Investors
- 6.3.2. Retail Investors
- 6.4. Market Analysis, Insights and Forecast - by Industry Vertical
- 6.4.1. Utilities
- 6.4.2. Transport & Logistics
- 6.4.3. Chemicals
- 6.4.4. Food and Beverage
- 6.4.5. Government
- 6.4.6. Other Industry Verticals
- 6.5. Market Analysis, Insights and Forecast - by North America
- 6.5.1. United States
- 6.5.2. Canada
- 6.5.3. Mexico
- 6.5.4. Rest of North America
- 6.6. Market Analysis, Insights and Forecast - by Europe
- 6.6.1. United Kingdom
- 6.6.2. Germany
- 6.6.3. France
- 6.6.4. Russia
- 6.6.5. Italy
- 6.6.6. Spain
- 6.6.7. Rest of Europe
- 6.7. Market Analysis, Insights and Forecast - by Asia-Pacific
- 6.7.1. India
- 6.7.2. China
- 6.7.3. Japan
- 6.7.4. Australia
- 6.7.5. Rest of Asia-Pacific
- 6.8. Market Analysis, Insights and Forecast - by South America
- 6.8.1. Brazil
- 6.8.2. Argentina
- 6.8.3. Rest of South America
- 6.9. Market Analysis, Insights and Forecast - by Middle-East and Africa
- 6.9.1. United Arab Emirates
- 6.9.2. South Africa
- 6.9.3. Rest of Middle-East and Africa
- 6.1. Market Analysis, Insights and Forecast - by Investment Type
- 7. North America ESG Finance Market Analysis, Insights and Forecast, 2020-2032
- 7.1. Market Analysis, Insights and Forecast - by Investment Type
- 7.1.1. Equity, Fixed Income, Mixed Allocation
- 7.1.2. Other Investment Types
- 7.2. Market Analysis, Insights and Forecast - by Transaction Type
- 7.2.1. Green Bond
- 7.2.2. Social Bond
- 7.2.3. Mixed Sustainability Bond
- 7.2.4. ESG Integrated Investment Funds
- 7.2.5. Other Transaction Types
- 7.3. Market Analysis, Insights and Forecast - by Investor Type
- 7.3.1. Institutional Investors
- 7.3.2. Retail Investors
- 7.4. Market Analysis, Insights and Forecast - by Industry Vertical
- 7.4.1. Utilities
- 7.4.2. Transport & Logistics
- 7.4.3. Chemicals
- 7.4.4. Food and Beverage
- 7.4.5. Government
- 7.4.6. Other Industry Verticals
- 7.5. Market Analysis, Insights and Forecast - by North America
- 7.5.1. United States
- 7.5.2. Canada
- 7.5.3. Mexico
- 7.5.4. Rest of North America
- 7.6. Market Analysis, Insights and Forecast - by Europe
- 7.6.1. United Kingdom
- 7.6.2. Germany
- 7.6.3. France
- 7.6.4. Russia
- 7.6.5. Italy
- 7.6.6. Spain
- 7.6.7. Rest of Europe
- 7.7. Market Analysis, Insights and Forecast - by Asia-Pacific
- 7.7.1. India
- 7.7.2. China
- 7.7.3. Japan
- 7.7.4. Australia
- 7.7.5. Rest of Asia-Pacific
- 7.8. Market Analysis, Insights and Forecast - by South America
- 7.8.1. Brazil
- 7.8.2. Argentina
- 7.8.3. Rest of South America
- 7.9. Market Analysis, Insights and Forecast - by Middle-East and Africa
- 7.9.1. United Arab Emirates
- 7.9.2. South Africa
- 7.9.3. Rest of Middle-East and Africa
- 7.1. Market Analysis, Insights and Forecast - by Investment Type
- 8. South America ESG Finance Market Analysis, Insights and Forecast, 2020-2032
- 8.1. Market Analysis, Insights and Forecast - by Investment Type
- 8.1.1. Equity, Fixed Income, Mixed Allocation
- 8.1.2. Other Investment Types
- 8.2. Market Analysis, Insights and Forecast - by Transaction Type
- 8.2.1. Green Bond
- 8.2.2. Social Bond
- 8.2.3. Mixed Sustainability Bond
- 8.2.4. ESG Integrated Investment Funds
- 8.2.5. Other Transaction Types
- 8.3. Market Analysis, Insights and Forecast - by Investor Type
- 8.3.1. Institutional Investors
- 8.3.2. Retail Investors
- 8.4. Market Analysis, Insights and Forecast - by Industry Vertical
- 8.4.1. Utilities
- 8.4.2. Transport & Logistics
- 8.4.3. Chemicals
- 8.4.4. Food and Beverage
- 8.4.5. Government
- 8.4.6. Other Industry Verticals
- 8.5. Market Analysis, Insights and Forecast - by North America
- 8.5.1. United States
- 8.5.2. Canada
- 8.5.3. Mexico
- 8.5.4. Rest of North America
- 8.6. Market Analysis, Insights and Forecast - by Europe
- 8.6.1. United Kingdom
- 8.6.2. Germany
- 8.6.3. France
- 8.6.4. Russia
- 8.6.5. Italy
- 8.6.6. Spain
- 8.6.7. Rest of Europe
- 8.7. Market Analysis, Insights and Forecast - by Asia-Pacific
- 8.7.1. India
- 8.7.2. China
- 8.7.3. Japan
- 8.7.4. Australia
- 8.7.5. Rest of Asia-Pacific
- 8.8. Market Analysis, Insights and Forecast - by South America
- 8.8.1. Brazil
- 8.8.2. Argentina
- 8.8.3. Rest of South America
- 8.9. Market Analysis, Insights and Forecast - by Middle-East and Africa
- 8.9.1. United Arab Emirates
- 8.9.2. South Africa
- 8.9.3. Rest of Middle-East and Africa
- 8.1. Market Analysis, Insights and Forecast - by Investment Type
- 9. Europe ESG Finance Market Analysis, Insights and Forecast, 2020-2032
- 9.1. Market Analysis, Insights and Forecast - by Investment Type
- 9.1.1. Equity, Fixed Income, Mixed Allocation
- 9.1.2. Other Investment Types
- 9.2. Market Analysis, Insights and Forecast - by Transaction Type
- 9.2.1. Green Bond
- 9.2.2. Social Bond
- 9.2.3. Mixed Sustainability Bond
- 9.2.4. ESG Integrated Investment Funds
- 9.2.5. Other Transaction Types
- 9.3. Market Analysis, Insights and Forecast - by Investor Type
- 9.3.1. Institutional Investors
- 9.3.2. Retail Investors
- 9.4. Market Analysis, Insights and Forecast - by Industry Vertical
- 9.4.1. Utilities
- 9.4.2. Transport & Logistics
- 9.4.3. Chemicals
- 9.4.4. Food and Beverage
- 9.4.5. Government
- 9.4.6. Other Industry Verticals
- 9.5. Market Analysis, Insights and Forecast - by North America
- 9.5.1. United States
- 9.5.2. Canada
- 9.5.3. Mexico
- 9.5.4. Rest of North America
- 9.6. Market Analysis, Insights and Forecast - by Europe
- 9.6.1. United Kingdom
- 9.6.2. Germany
- 9.6.3. France
- 9.6.4. Russia
- 9.6.5. Italy
- 9.6.6. Spain
- 9.6.7. Rest of Europe
- 9.7. Market Analysis, Insights and Forecast - by Asia-Pacific
- 9.7.1. India
- 9.7.2. China
- 9.7.3. Japan
- 9.7.4. Australia
- 9.7.5. Rest of Asia-Pacific
- 9.8. Market Analysis, Insights and Forecast - by South America
- 9.8.1. Brazil
- 9.8.2. Argentina
- 9.8.3. Rest of South America
- 9.9. Market Analysis, Insights and Forecast - by Middle-East and Africa
- 9.9.1. United Arab Emirates
- 9.9.2. South Africa
- 9.9.3. Rest of Middle-East and Africa
- 9.1. Market Analysis, Insights and Forecast - by Investment Type
- 10. Middle East & Africa ESG Finance Market Analysis, Insights and Forecast, 2020-2032
- 10.1. Market Analysis, Insights and Forecast - by Investment Type
- 10.1.1. Equity, Fixed Income, Mixed Allocation
- 10.1.2. Other Investment Types
- 10.2. Market Analysis, Insights and Forecast - by Transaction Type
- 10.2.1. Green Bond
- 10.2.2. Social Bond
- 10.2.3. Mixed Sustainability Bond
- 10.2.4. ESG Integrated Investment Funds
- 10.2.5. Other Transaction Types
- 10.3. Market Analysis, Insights and Forecast - by Investor Type
- 10.3.1. Institutional Investors
- 10.3.2. Retail Investors
- 10.4. Market Analysis, Insights and Forecast - by Industry Vertical
- 10.4.1. Utilities
- 10.4.2. Transport & Logistics
- 10.4.3. Chemicals
- 10.4.4. Food and Beverage
- 10.4.5. Government
- 10.4.6. Other Industry Verticals
- 10.5. Market Analysis, Insights and Forecast - by North America
- 10.5.1. United States
- 10.5.2. Canada
- 10.5.3. Mexico
- 10.5.4. Rest of North America
- 10.6. Market Analysis, Insights and Forecast - by Europe
- 10.6.1. United Kingdom
- 10.6.2. Germany
- 10.6.3. France
- 10.6.4. Russia
- 10.6.5. Italy
- 10.6.6. Spain
- 10.6.7. Rest of Europe
- 10.7. Market Analysis, Insights and Forecast - by Asia-Pacific
- 10.7.1. India
- 10.7.2. China
- 10.7.3. Japan
- 10.7.4. Australia
- 10.7.5. Rest of Asia-Pacific
- 10.8. Market Analysis, Insights and Forecast - by South America
- 10.8.1. Brazil
- 10.8.2. Argentina
- 10.8.3. Rest of South America
- 10.9. Market Analysis, Insights and Forecast - by Middle-East and Africa
- 10.9.1. United Arab Emirates
- 10.9.2. South Africa
- 10.9.3. Rest of Middle-East and Africa
- 10.1. Market Analysis, Insights and Forecast - by Investment Type
- 11. Asia Pacific ESG Finance Market Analysis, Insights and Forecast, 2020-2032
- 11.1. Market Analysis, Insights and Forecast - by Investment Type
- 11.1.1. Equity, Fixed Income, Mixed Allocation
- 11.1.2. Other Investment Types
- 11.2. Market Analysis, Insights and Forecast - by Transaction Type
- 11.2.1. Green Bond
- 11.2.2. Social Bond
- 11.2.3. Mixed Sustainability Bond
- 11.2.4. ESG Integrated Investment Funds
- 11.2.5. Other Transaction Types
- 11.3. Market Analysis, Insights and Forecast - by Investor Type
- 11.3.1. Institutional Investors
- 11.3.2. Retail Investors
- 11.4. Market Analysis, Insights and Forecast - by Industry Vertical
- 11.4.1. Utilities
- 11.4.2. Transport & Logistics
- 11.4.3. Chemicals
- 11.4.4. Food and Beverage
- 11.4.5. Government
- 11.4.6. Other Industry Verticals
- 11.5. Market Analysis, Insights and Forecast - by North America
- 11.5.1. United States
- 11.5.2. Canada
- 11.5.3. Mexico
- 11.5.4. Rest of North America
- 11.6. Market Analysis, Insights and Forecast - by Europe
- 11.6.1. United Kingdom
- 11.6.2. Germany
- 11.6.3. France
- 11.6.4. Russia
- 11.6.5. Italy
- 11.6.6. Spain
- 11.6.7. Rest of Europe
- 11.7. Market Analysis, Insights and Forecast - by Asia-Pacific
- 11.7.1. India
- 11.7.2. China
- 11.7.3. Japan
- 11.7.4. Australia
- 11.7.5. Rest of Asia-Pacific
- 11.8. Market Analysis, Insights and Forecast - by South America
- 11.8.1. Brazil
- 11.8.2. Argentina
- 11.8.3. Rest of South America
- 11.9. Market Analysis, Insights and Forecast - by Middle-East and Africa
- 11.9.1. United Arab Emirates
- 11.9.2. South Africa
- 11.9.3. Rest of Middle-East and Africa
- 11.1. Market Analysis, Insights and Forecast - by Investment Type
- 12. Competitive Analysis
- 12.1. Company Profiles
- 12.1.1 BlackRock Inc
- 12.1.1.1. Company Overview
- 12.1.1.2. Products
- 12.1.1.3. Company Financials
- 12.1.1.4. SWOT Analysis
- 12.1.2 State Street Corporation
- 12.1.2.1. Company Overview
- 12.1.2.2. Products
- 12.1.2.3. Company Financials
- 12.1.2.4. SWOT Analysis
- 12.1.3 Morgan Stanley
- 12.1.3.1. Company Overview
- 12.1.3.2. Products
- 12.1.3.3. Company Financials
- 12.1.3.4. SWOT Analysis
- 12.1.4 UBS
- 12.1.4.1. Company Overview
- 12.1.4.2. Products
- 12.1.4.3. Company Financials
- 12.1.4.4. SWOT Analysis
- 12.1.5 JPMorgan Chase & Co
- 12.1.5.1. Company Overview
- 12.1.5.2. Products
- 12.1.5.3. Company Financials
- 12.1.5.4. SWOT Analysis
- 12.1.6 Franklin Templeton Investments
- 12.1.6.1. Company Overview
- 12.1.6.2. Products
- 12.1.6.3. Company Financials
- 12.1.6.4. SWOT Analysis
- 12.1.7 Amundi US
- 12.1.7.1. Company Overview
- 12.1.7.2. Products
- 12.1.7.3. Company Financials
- 12.1.7.4. SWOT Analysis
- 12.1.8 The Bank of New York Mellon Corporation
- 12.1.8.1. Company Overview
- 12.1.8.2. Products
- 12.1.8.3. Company Financials
- 12.1.8.4. SWOT Analysis
- 12.1.9 Deutsche Bank AG
- 12.1.9.1. Company Overview
- 12.1.9.2. Products
- 12.1.9.3. Company Financials
- 12.1.9.4. SWOT Analysis
- 12.1.10 Goldman Sachs*
*List Not Exhaustive
- 12.1.10.1. Company Overview
- 12.1.10.2. Products
- 12.1.10.3. Company Financials
- 12.1.10.4. SWOT Analysis
- 12.1.1 BlackRock Inc
- 12.2. Market Entropy
- 12.2.1 Company's Key Areas Served
- 12.2.2 Recent Developments
- 12.3. Company Market Share Analysis 2025
- 12.3.1 Top 5 Companies Market Share Analysis
- 12.3.2 Top 3 Companies Market Share Analysis
- 12.4. List of Potential Customers
- 13. Research Methodology
List of Figures
- Figure 1: Global ESG Finance Market Revenue Breakdown (Million, %) by Region 2025 & 2033
- Figure 2: Global ESG Finance Market Volume Breakdown (Trillion, %) by Region 2025 & 2033
- Figure 3: North America ESG Finance Market Revenue (Million), by Investment Type 2025 & 2033
- Figure 4: North America ESG Finance Market Volume (Trillion), by Investment Type 2025 & 2033
- Figure 5: North America ESG Finance Market Revenue Share (%), by Investment Type 2025 & 2033
- Figure 6: North America ESG Finance Market Volume Share (%), by Investment Type 2025 & 2033
- Figure 7: North America ESG Finance Market Revenue (Million), by Transaction Type 2025 & 2033
- Figure 8: North America ESG Finance Market Volume (Trillion), by Transaction Type 2025 & 2033
- Figure 9: North America ESG Finance Market Revenue Share (%), by Transaction Type 2025 & 2033
- Figure 10: North America ESG Finance Market Volume Share (%), by Transaction Type 2025 & 2033
- Figure 11: North America ESG Finance Market Revenue (Million), by Investor Type 2025 & 2033
- Figure 12: North America ESG Finance Market Volume (Trillion), by Investor Type 2025 & 2033
- Figure 13: North America ESG Finance Market Revenue Share (%), by Investor Type 2025 & 2033
- Figure 14: North America ESG Finance Market Volume Share (%), by Investor Type 2025 & 2033
- Figure 15: North America ESG Finance Market Revenue (Million), by Industry Vertical 2025 & 2033
- Figure 16: North America ESG Finance Market Volume (Trillion), by Industry Vertical 2025 & 2033
- Figure 17: North America ESG Finance Market Revenue Share (%), by Industry Vertical 2025 & 2033
- Figure 18: North America ESG Finance Market Volume Share (%), by Industry Vertical 2025 & 2033
- Figure 19: North America ESG Finance Market Revenue (Million), by North America 2025 & 2033
- Figure 20: North America ESG Finance Market Volume (Trillion), by North America 2025 & 2033
- Figure 21: North America ESG Finance Market Revenue Share (%), by North America 2025 & 2033
- Figure 22: North America ESG Finance Market Volume Share (%), by North America 2025 & 2033
- Figure 23: North America ESG Finance Market Revenue (Million), by Europe 2025 & 2033
- Figure 24: North America ESG Finance Market Volume (Trillion), by Europe 2025 & 2033
- Figure 25: North America ESG Finance Market Revenue Share (%), by Europe 2025 & 2033
- Figure 26: North America ESG Finance Market Volume Share (%), by Europe 2025 & 2033
- Figure 27: North America ESG Finance Market Revenue (Million), by Asia-Pacific 2025 & 2033
- Figure 28: North America ESG Finance Market Volume (Trillion), by Asia-Pacific 2025 & 2033
- Figure 29: North America ESG Finance Market Revenue Share (%), by Asia-Pacific 2025 & 2033
- Figure 30: North America ESG Finance Market Volume Share (%), by Asia-Pacific 2025 & 2033
- Figure 31: North America ESG Finance Market Revenue (Million), by South America 2025 & 2033
- Figure 32: North America ESG Finance Market Volume (Trillion), by South America 2025 & 2033
- Figure 33: North America ESG Finance Market Revenue Share (%), by South America 2025 & 2033
- Figure 34: North America ESG Finance Market Volume Share (%), by South America 2025 & 2033
- Figure 35: North America ESG Finance Market Revenue (Million), by Middle-East and Africa 2025 & 2033
- Figure 36: North America ESG Finance Market Volume (Trillion), by Middle-East and Africa 2025 & 2033
- Figure 37: North America ESG Finance Market Revenue Share (%), by Middle-East and Africa 2025 & 2033
- Figure 38: North America ESG Finance Market Volume Share (%), by Middle-East and Africa 2025 & 2033
- Figure 39: North America ESG Finance Market Revenue (Million), by Country 2025 & 2033
- Figure 40: North America ESG Finance Market Volume (Trillion), by Country 2025 & 2033
- Figure 41: North America ESG Finance Market Revenue Share (%), by Country 2025 & 2033
- Figure 42: North America ESG Finance Market Volume Share (%), by Country 2025 & 2033
- Figure 43: South America ESG Finance Market Revenue (Million), by Investment Type 2025 & 2033
- Figure 44: South America ESG Finance Market Volume (Trillion), by Investment Type 2025 & 2033
- Figure 45: South America ESG Finance Market Revenue Share (%), by Investment Type 2025 & 2033
- Figure 46: South America ESG Finance Market Volume Share (%), by Investment Type 2025 & 2033
- Figure 47: South America ESG Finance Market Revenue (Million), by Transaction Type 2025 & 2033
- Figure 48: South America ESG Finance Market Volume (Trillion), by Transaction Type 2025 & 2033
- Figure 49: South America ESG Finance Market Revenue Share (%), by Transaction Type 2025 & 2033
- Figure 50: South America ESG Finance Market Volume Share (%), by Transaction Type 2025 & 2033
- Figure 51: South America ESG Finance Market Revenue (Million), by Investor Type 2025 & 2033
- Figure 52: South America ESG Finance Market Volume (Trillion), by Investor Type 2025 & 2033
- Figure 53: South America ESG Finance Market Revenue Share (%), by Investor Type 2025 & 2033
- Figure 54: South America ESG Finance Market Volume Share (%), by Investor Type 2025 & 2033
- Figure 55: South America ESG Finance Market Revenue (Million), by Industry Vertical 2025 & 2033
- Figure 56: South America ESG Finance Market Volume (Trillion), by Industry Vertical 2025 & 2033
- Figure 57: South America ESG Finance Market Revenue Share (%), by Industry Vertical 2025 & 2033
- Figure 58: South America ESG Finance Market Volume Share (%), by Industry Vertical 2025 & 2033
- Figure 59: South America ESG Finance Market Revenue (Million), by North America 2025 & 2033
- Figure 60: South America ESG Finance Market Volume (Trillion), by North America 2025 & 2033
- Figure 61: South America ESG Finance Market Revenue Share (%), by North America 2025 & 2033
- Figure 62: South America ESG Finance Market Volume Share (%), by North America 2025 & 2033
- Figure 63: South America ESG Finance Market Revenue (Million), by Europe 2025 & 2033
- Figure 64: South America ESG Finance Market Volume (Trillion), by Europe 2025 & 2033
- Figure 65: South America ESG Finance Market Revenue Share (%), by Europe 2025 & 2033
- Figure 66: South America ESG Finance Market Volume Share (%), by Europe 2025 & 2033
- Figure 67: South America ESG Finance Market Revenue (Million), by Asia-Pacific 2025 & 2033
- Figure 68: South America ESG Finance Market Volume (Trillion), by Asia-Pacific 2025 & 2033
- Figure 69: South America ESG Finance Market Revenue Share (%), by Asia-Pacific 2025 & 2033
- Figure 70: South America ESG Finance Market Volume Share (%), by Asia-Pacific 2025 & 2033
- Figure 71: South America ESG Finance Market Revenue (Million), by South America 2025 & 2033
- Figure 72: South America ESG Finance Market Volume (Trillion), by South America 2025 & 2033
- Figure 73: South America ESG Finance Market Revenue Share (%), by South America 2025 & 2033
- Figure 74: South America ESG Finance Market Volume Share (%), by South America 2025 & 2033
- Figure 75: South America ESG Finance Market Revenue (Million), by Middle-East and Africa 2025 & 2033
- Figure 76: South America ESG Finance Market Volume (Trillion), by Middle-East and Africa 2025 & 2033
- Figure 77: South America ESG Finance Market Revenue Share (%), by Middle-East and Africa 2025 & 2033
- Figure 78: South America ESG Finance Market Volume Share (%), by Middle-East and Africa 2025 & 2033
- Figure 79: South America ESG Finance Market Revenue (Million), by Country 2025 & 2033
- Figure 80: South America ESG Finance Market Volume (Trillion), by Country 2025 & 2033
- Figure 81: South America ESG Finance Market Revenue Share (%), by Country 2025 & 2033
- Figure 82: South America ESG Finance Market Volume Share (%), by Country 2025 & 2033
- Figure 83: Europe ESG Finance Market Revenue (Million), by Investment Type 2025 & 2033
- Figure 84: Europe ESG Finance Market Volume (Trillion), by Investment Type 2025 & 2033
- Figure 85: Europe ESG Finance Market Revenue Share (%), by Investment Type 2025 & 2033
- Figure 86: Europe ESG Finance Market Volume Share (%), by Investment Type 2025 & 2033
- Figure 87: Europe ESG Finance Market Revenue (Million), by Transaction Type 2025 & 2033
- Figure 88: Europe ESG Finance Market Volume (Trillion), by Transaction Type 2025 & 2033
- Figure 89: Europe ESG Finance Market Revenue Share (%), by Transaction Type 2025 & 2033
- Figure 90: Europe ESG Finance Market Volume Share (%), by Transaction Type 2025 & 2033
- Figure 91: Europe ESG Finance Market Revenue (Million), by Investor Type 2025 & 2033
- Figure 92: Europe ESG Finance Market Volume (Trillion), by Investor Type 2025 & 2033
- Figure 93: Europe ESG Finance Market Revenue Share (%), by Investor Type 2025 & 2033
- Figure 94: Europe ESG Finance Market Volume Share (%), by Investor Type 2025 & 2033
- Figure 95: Europe ESG Finance Market Revenue (Million), by Industry Vertical 2025 & 2033
- Figure 96: Europe ESG Finance Market Volume (Trillion), by Industry Vertical 2025 & 2033
- Figure 97: Europe ESG Finance Market Revenue Share (%), by Industry Vertical 2025 & 2033
- Figure 98: Europe ESG Finance Market Volume Share (%), by Industry Vertical 2025 & 2033
- Figure 99: Europe ESG Finance Market Revenue (Million), by North America 2025 & 2033
- Figure 100: Europe ESG Finance Market Volume (Trillion), by North America 2025 & 2033
- Figure 101: Europe ESG Finance Market Revenue Share (%), by North America 2025 & 2033
- Figure 102: Europe ESG Finance Market Volume Share (%), by North America 2025 & 2033
- Figure 103: Europe ESG Finance Market Revenue (Million), by Europe 2025 & 2033
- Figure 104: Europe ESG Finance Market Volume (Trillion), by Europe 2025 & 2033
- Figure 105: Europe ESG Finance Market Revenue Share (%), by Europe 2025 & 2033
- Figure 106: Europe ESG Finance Market Volume Share (%), by Europe 2025 & 2033
- Figure 107: Europe ESG Finance Market Revenue (Million), by Asia-Pacific 2025 & 2033
- Figure 108: Europe ESG Finance Market Volume (Trillion), by Asia-Pacific 2025 & 2033
- Figure 109: Europe ESG Finance Market Revenue Share (%), by Asia-Pacific 2025 & 2033
- Figure 110: Europe ESG Finance Market Volume Share (%), by Asia-Pacific 2025 & 2033
- Figure 111: Europe ESG Finance Market Revenue (Million), by South America 2025 & 2033
- Figure 112: Europe ESG Finance Market Volume (Trillion), by South America 2025 & 2033
- Figure 113: Europe ESG Finance Market Revenue Share (%), by South America 2025 & 2033
- Figure 114: Europe ESG Finance Market Volume Share (%), by South America 2025 & 2033
- Figure 115: Europe ESG Finance Market Revenue (Million), by Middle-East and Africa 2025 & 2033
- Figure 116: Europe ESG Finance Market Volume (Trillion), by Middle-East and Africa 2025 & 2033
- Figure 117: Europe ESG Finance Market Revenue Share (%), by Middle-East and Africa 2025 & 2033
- Figure 118: Europe ESG Finance Market Volume Share (%), by Middle-East and Africa 2025 & 2033
- Figure 119: Europe ESG Finance Market Revenue (Million), by Country 2025 & 2033
- Figure 120: Europe ESG Finance Market Volume (Trillion), by Country 2025 & 2033
- Figure 121: Europe ESG Finance Market Revenue Share (%), by Country 2025 & 2033
- Figure 122: Europe ESG Finance Market Volume Share (%), by Country 2025 & 2033
- Figure 123: Middle East & Africa ESG Finance Market Revenue (Million), by Investment Type 2025 & 2033
- Figure 124: Middle East & Africa ESG Finance Market Volume (Trillion), by Investment Type 2025 & 2033
- Figure 125: Middle East & Africa ESG Finance Market Revenue Share (%), by Investment Type 2025 & 2033
- Figure 126: Middle East & Africa ESG Finance Market Volume Share (%), by Investment Type 2025 & 2033
- Figure 127: Middle East & Africa ESG Finance Market Revenue (Million), by Transaction Type 2025 & 2033
- Figure 128: Middle East & Africa ESG Finance Market Volume (Trillion), by Transaction Type 2025 & 2033
- Figure 129: Middle East & Africa ESG Finance Market Revenue Share (%), by Transaction Type 2025 & 2033
- Figure 130: Middle East & Africa ESG Finance Market Volume Share (%), by Transaction Type 2025 & 2033
- Figure 131: Middle East & Africa ESG Finance Market Revenue (Million), by Investor Type 2025 & 2033
- Figure 132: Middle East & Africa ESG Finance Market Volume (Trillion), by Investor Type 2025 & 2033
- Figure 133: Middle East & Africa ESG Finance Market Revenue Share (%), by Investor Type 2025 & 2033
- Figure 134: Middle East & Africa ESG Finance Market Volume Share (%), by Investor Type 2025 & 2033
- Figure 135: Middle East & Africa ESG Finance Market Revenue (Million), by Industry Vertical 2025 & 2033
- Figure 136: Middle East & Africa ESG Finance Market Volume (Trillion), by Industry Vertical 2025 & 2033
- Figure 137: Middle East & Africa ESG Finance Market Revenue Share (%), by Industry Vertical 2025 & 2033
- Figure 138: Middle East & Africa ESG Finance Market Volume Share (%), by Industry Vertical 2025 & 2033
- Figure 139: Middle East & Africa ESG Finance Market Revenue (Million), by North America 2025 & 2033
- Figure 140: Middle East & Africa ESG Finance Market Volume (Trillion), by North America 2025 & 2033
- Figure 141: Middle East & Africa ESG Finance Market Revenue Share (%), by North America 2025 & 2033
- Figure 142: Middle East & Africa ESG Finance Market Volume Share (%), by North America 2025 & 2033
- Figure 143: Middle East & Africa ESG Finance Market Revenue (Million), by Europe 2025 & 2033
- Figure 144: Middle East & Africa ESG Finance Market Volume (Trillion), by Europe 2025 & 2033
- Figure 145: Middle East & Africa ESG Finance Market Revenue Share (%), by Europe 2025 & 2033
- Figure 146: Middle East & Africa ESG Finance Market Volume Share (%), by Europe 2025 & 2033
- Figure 147: Middle East & Africa ESG Finance Market Revenue (Million), by Asia-Pacific 2025 & 2033
- Figure 148: Middle East & Africa ESG Finance Market Volume (Trillion), by Asia-Pacific 2025 & 2033
- Figure 149: Middle East & Africa ESG Finance Market Revenue Share (%), by Asia-Pacific 2025 & 2033
- Figure 150: Middle East & Africa ESG Finance Market Volume Share (%), by Asia-Pacific 2025 & 2033
- Figure 151: Middle East & Africa ESG Finance Market Revenue (Million), by South America 2025 & 2033
- Figure 152: Middle East & Africa ESG Finance Market Volume (Trillion), by South America 2025 & 2033
- Figure 153: Middle East & Africa ESG Finance Market Revenue Share (%), by South America 2025 & 2033
- Figure 154: Middle East & Africa ESG Finance Market Volume Share (%), by South America 2025 & 2033
- Figure 155: Middle East & Africa ESG Finance Market Revenue (Million), by Middle-East and Africa 2025 & 2033
- Figure 156: Middle East & Africa ESG Finance Market Volume (Trillion), by Middle-East and Africa 2025 & 2033
- Figure 157: Middle East & Africa ESG Finance Market Revenue Share (%), by Middle-East and Africa 2025 & 2033
- Figure 158: Middle East & Africa ESG Finance Market Volume Share (%), by Middle-East and Africa 2025 & 2033
- Figure 159: Middle East & Africa ESG Finance Market Revenue (Million), by Country 2025 & 2033
- Figure 160: Middle East & Africa ESG Finance Market Volume (Trillion), by Country 2025 & 2033
- Figure 161: Middle East & Africa ESG Finance Market Revenue Share (%), by Country 2025 & 2033
- Figure 162: Middle East & Africa ESG Finance Market Volume Share (%), by Country 2025 & 2033
- Figure 163: Asia Pacific ESG Finance Market Revenue (Million), by Investment Type 2025 & 2033
- Figure 164: Asia Pacific ESG Finance Market Volume (Trillion), by Investment Type 2025 & 2033
- Figure 165: Asia Pacific ESG Finance Market Revenue Share (%), by Investment Type 2025 & 2033
- Figure 166: Asia Pacific ESG Finance Market Volume Share (%), by Investment Type 2025 & 2033
- Figure 167: Asia Pacific ESG Finance Market Revenue (Million), by Transaction Type 2025 & 2033
- Figure 168: Asia Pacific ESG Finance Market Volume (Trillion), by Transaction Type 2025 & 2033
- Figure 169: Asia Pacific ESG Finance Market Revenue Share (%), by Transaction Type 2025 & 2033
- Figure 170: Asia Pacific ESG Finance Market Volume Share (%), by Transaction Type 2025 & 2033
- Figure 171: Asia Pacific ESG Finance Market Revenue (Million), by Investor Type 2025 & 2033
- Figure 172: Asia Pacific ESG Finance Market Volume (Trillion), by Investor Type 2025 & 2033
- Figure 173: Asia Pacific ESG Finance Market Revenue Share (%), by Investor Type 2025 & 2033
- Figure 174: Asia Pacific ESG Finance Market Volume Share (%), by Investor Type 2025 & 2033
- Figure 175: Asia Pacific ESG Finance Market Revenue (Million), by Industry Vertical 2025 & 2033
- Figure 176: Asia Pacific ESG Finance Market Volume (Trillion), by Industry Vertical 2025 & 2033
- Figure 177: Asia Pacific ESG Finance Market Revenue Share (%), by Industry Vertical 2025 & 2033
- Figure 178: Asia Pacific ESG Finance Market Volume Share (%), by Industry Vertical 2025 & 2033
- Figure 179: Asia Pacific ESG Finance Market Revenue (Million), by North America 2025 & 2033
- Figure 180: Asia Pacific ESG Finance Market Volume (Trillion), by North America 2025 & 2033
- Figure 181: Asia Pacific ESG Finance Market Revenue Share (%), by North America 2025 & 2033
- Figure 182: Asia Pacific ESG Finance Market Volume Share (%), by North America 2025 & 2033
- Figure 183: Asia Pacific ESG Finance Market Revenue (Million), by Europe 2025 & 2033
- Figure 184: Asia Pacific ESG Finance Market Volume (Trillion), by Europe 2025 & 2033
- Figure 185: Asia Pacific ESG Finance Market Revenue Share (%), by Europe 2025 & 2033
- Figure 186: Asia Pacific ESG Finance Market Volume Share (%), by Europe 2025 & 2033
- Figure 187: Asia Pacific ESG Finance Market Revenue (Million), by Asia-Pacific 2025 & 2033
- Figure 188: Asia Pacific ESG Finance Market Volume (Trillion), by Asia-Pacific 2025 & 2033
- Figure 189: Asia Pacific ESG Finance Market Revenue Share (%), by Asia-Pacific 2025 & 2033
- Figure 190: Asia Pacific ESG Finance Market Volume Share (%), by Asia-Pacific 2025 & 2033
- Figure 191: Asia Pacific ESG Finance Market Revenue (Million), by South America 2025 & 2033
- Figure 192: Asia Pacific ESG Finance Market Volume (Trillion), by South America 2025 & 2033
- Figure 193: Asia Pacific ESG Finance Market Revenue Share (%), by South America 2025 & 2033
- Figure 194: Asia Pacific ESG Finance Market Volume Share (%), by South America 2025 & 2033
- Figure 195: Asia Pacific ESG Finance Market Revenue (Million), by Middle-East and Africa 2025 & 2033
- Figure 196: Asia Pacific ESG Finance Market Volume (Trillion), by Middle-East and Africa 2025 & 2033
- Figure 197: Asia Pacific ESG Finance Market Revenue Share (%), by Middle-East and Africa 2025 & 2033
- Figure 198: Asia Pacific ESG Finance Market Volume Share (%), by Middle-East and Africa 2025 & 2033
- Figure 199: Asia Pacific ESG Finance Market Revenue (Million), by Country 2025 & 2033
- Figure 200: Asia Pacific ESG Finance Market Volume (Trillion), by Country 2025 & 2033
- Figure 201: Asia Pacific ESG Finance Market Revenue Share (%), by Country 2025 & 2033
- Figure 202: Asia Pacific ESG Finance Market Volume Share (%), by Country 2025 & 2033
List of Tables
- Table 1: Global ESG Finance Market Revenue Million Forecast, by Investment Type 2020 & 2033
- Table 2: Global ESG Finance Market Volume Trillion Forecast, by Investment Type 2020 & 2033
- Table 3: Global ESG Finance Market Revenue Million Forecast, by Transaction Type 2020 & 2033
- Table 4: Global ESG Finance Market Volume Trillion Forecast, by Transaction Type 2020 & 2033
- Table 5: Global ESG Finance Market Revenue Million Forecast, by Investor Type 2020 & 2033
- Table 6: Global ESG Finance Market Volume Trillion Forecast, by Investor Type 2020 & 2033
- Table 7: Global ESG Finance Market Revenue Million Forecast, by Industry Vertical 2020 & 2033
- Table 8: Global ESG Finance Market Volume Trillion Forecast, by Industry Vertical 2020 & 2033
- Table 9: Global ESG Finance Market Revenue Million Forecast, by North America 2020 & 2033
- Table 10: Global ESG Finance Market Volume Trillion Forecast, by North America 2020 & 2033
- Table 11: Global ESG Finance Market Revenue Million Forecast, by Europe 2020 & 2033
- Table 12: Global ESG Finance Market Volume Trillion Forecast, by Europe 2020 & 2033
- Table 13: Global ESG Finance Market Revenue Million Forecast, by Asia-Pacific 2020 & 2033
- Table 14: Global ESG Finance Market Volume Trillion Forecast, by Asia-Pacific 2020 & 2033
- Table 15: Global ESG Finance Market Revenue Million Forecast, by South America 2020 & 2033
- Table 16: Global ESG Finance Market Volume Trillion Forecast, by South America 2020 & 2033
- Table 17: Global ESG Finance Market Revenue Million Forecast, by Middle-East and Africa 2020 & 2033
- Table 18: Global ESG Finance Market Volume Trillion Forecast, by Middle-East and Africa 2020 & 2033
- Table 19: Global ESG Finance Market Revenue Million Forecast, by Region 2020 & 2033
- Table 20: Global ESG Finance Market Volume Trillion Forecast, by Region 2020 & 2033
- Table 21: Global ESG Finance Market Revenue Million Forecast, by Investment Type 2020 & 2033
- Table 22: Global ESG Finance Market Volume Trillion Forecast, by Investment Type 2020 & 2033
- Table 23: Global ESG Finance Market Revenue Million Forecast, by Transaction Type 2020 & 2033
- Table 24: Global ESG Finance Market Volume Trillion Forecast, by Transaction Type 2020 & 2033
- Table 25: Global ESG Finance Market Revenue Million Forecast, by Investor Type 2020 & 2033
- Table 26: Global ESG Finance Market Volume Trillion Forecast, by Investor Type 2020 & 2033
- Table 27: Global ESG Finance Market Revenue Million Forecast, by Industry Vertical 2020 & 2033
- Table 28: Global ESG Finance Market Volume Trillion Forecast, by Industry Vertical 2020 & 2033
- Table 29: Global ESG Finance Market Revenue Million Forecast, by North America 2020 & 2033
- Table 30: Global ESG Finance Market Volume Trillion Forecast, by North America 2020 & 2033
- Table 31: Global ESG Finance Market Revenue Million Forecast, by Europe 2020 & 2033
- Table 32: Global ESG Finance Market Volume Trillion Forecast, by Europe 2020 & 2033
- Table 33: Global ESG Finance Market Revenue Million Forecast, by Asia-Pacific 2020 & 2033
- Table 34: Global ESG Finance Market Volume Trillion Forecast, by Asia-Pacific 2020 & 2033
- Table 35: Global ESG Finance Market Revenue Million Forecast, by South America 2020 & 2033
- Table 36: Global ESG Finance Market Volume Trillion Forecast, by South America 2020 & 2033
- Table 37: Global ESG Finance Market Revenue Million Forecast, by Middle-East and Africa 2020 & 2033
- Table 38: Global ESG Finance Market Volume Trillion Forecast, by Middle-East and Africa 2020 & 2033
- Table 39: Global ESG Finance Market Revenue Million Forecast, by Country 2020 & 2033
- Table 40: Global ESG Finance Market Volume Trillion Forecast, by Country 2020 & 2033
- Table 41: United States ESG Finance Market Revenue (Million) Forecast, by Application 2020 & 2033
- Table 42: United States ESG Finance Market Volume (Trillion) Forecast, by Application 2020 & 2033
- Table 43: Canada ESG Finance Market Revenue (Million) Forecast, by Application 2020 & 2033
- Table 44: Canada ESG Finance Market Volume (Trillion) Forecast, by Application 2020 & 2033
- Table 45: Mexico ESG Finance Market Revenue (Million) Forecast, by Application 2020 & 2033
- Table 46: Mexico ESG Finance Market Volume (Trillion) Forecast, by Application 2020 & 2033
- Table 47: Global ESG Finance Market Revenue Million Forecast, by Investment Type 2020 & 2033
- Table 48: Global ESG Finance Market Volume Trillion Forecast, by Investment Type 2020 & 2033
- Table 49: Global ESG Finance Market Revenue Million Forecast, by Transaction Type 2020 & 2033
- Table 50: Global ESG Finance Market Volume Trillion Forecast, by Transaction Type 2020 & 2033
- Table 51: Global ESG Finance Market Revenue Million Forecast, by Investor Type 2020 & 2033
- Table 52: Global ESG Finance Market Volume Trillion Forecast, by Investor Type 2020 & 2033
- Table 53: Global ESG Finance Market Revenue Million Forecast, by Industry Vertical 2020 & 2033
- Table 54: Global ESG Finance Market Volume Trillion Forecast, by Industry Vertical 2020 & 2033
- Table 55: Global ESG Finance Market Revenue Million Forecast, by North America 2020 & 2033
- Table 56: Global ESG Finance Market Volume Trillion Forecast, by North America 2020 & 2033
- Table 57: Global ESG Finance Market Revenue Million Forecast, by Europe 2020 & 2033
- Table 58: Global ESG Finance Market Volume Trillion Forecast, by Europe 2020 & 2033
- Table 59: Global ESG Finance Market Revenue Million Forecast, by Asia-Pacific 2020 & 2033
- Table 60: Global ESG Finance Market Volume Trillion Forecast, by Asia-Pacific 2020 & 2033
- Table 61: Global ESG Finance Market Revenue Million Forecast, by South America 2020 & 2033
- Table 62: Global ESG Finance Market Volume Trillion Forecast, by South America 2020 & 2033
- Table 63: Global ESG Finance Market Revenue Million Forecast, by Middle-East and Africa 2020 & 2033
- Table 64: Global ESG Finance Market Volume Trillion Forecast, by Middle-East and Africa 2020 & 2033
- Table 65: Global ESG Finance Market Revenue Million Forecast, by Country 2020 & 2033
- Table 66: Global ESG Finance Market Volume Trillion Forecast, by Country 2020 & 2033
- Table 67: Brazil ESG Finance Market Revenue (Million) Forecast, by Application 2020 & 2033
- Table 68: Brazil ESG Finance Market Volume (Trillion) Forecast, by Application 2020 & 2033
- Table 69: Argentina ESG Finance Market Revenue (Million) Forecast, by Application 2020 & 2033
- Table 70: Argentina ESG Finance Market Volume (Trillion) Forecast, by Application 2020 & 2033
- Table 71: Rest of South America ESG Finance Market Revenue (Million) Forecast, by Application 2020 & 2033
- Table 72: Rest of South America ESG Finance Market Volume (Trillion) Forecast, by Application 2020 & 2033
- Table 73: Global ESG Finance Market Revenue Million Forecast, by Investment Type 2020 & 2033
- Table 74: Global ESG Finance Market Volume Trillion Forecast, by Investment Type 2020 & 2033
- Table 75: Global ESG Finance Market Revenue Million Forecast, by Transaction Type 2020 & 2033
- Table 76: Global ESG Finance Market Volume Trillion Forecast, by Transaction Type 2020 & 2033
- Table 77: Global ESG Finance Market Revenue Million Forecast, by Investor Type 2020 & 2033
- Table 78: Global ESG Finance Market Volume Trillion Forecast, by Investor Type 2020 & 2033
- Table 79: Global ESG Finance Market Revenue Million Forecast, by Industry Vertical 2020 & 2033
- Table 80: Global ESG Finance Market Volume Trillion Forecast, by Industry Vertical 2020 & 2033
- Table 81: Global ESG Finance Market Revenue Million Forecast, by North America 2020 & 2033
- Table 82: Global ESG Finance Market Volume Trillion Forecast, by North America 2020 & 2033
- Table 83: Global ESG Finance Market Revenue Million Forecast, by Europe 2020 & 2033
- Table 84: Global ESG Finance Market Volume Trillion Forecast, by Europe 2020 & 2033
- Table 85: Global ESG Finance Market Revenue Million Forecast, by Asia-Pacific 2020 & 2033
- Table 86: Global ESG Finance Market Volume Trillion Forecast, by Asia-Pacific 2020 & 2033
- Table 87: Global ESG Finance Market Revenue Million Forecast, by South America 2020 & 2033
- Table 88: Global ESG Finance Market Volume Trillion Forecast, by South America 2020 & 2033
- Table 89: Global ESG Finance Market Revenue Million Forecast, by Middle-East and Africa 2020 & 2033
- Table 90: Global ESG Finance Market Volume Trillion Forecast, by Middle-East and Africa 2020 & 2033
- Table 91: Global ESG Finance Market Revenue Million Forecast, by Country 2020 & 2033
- Table 92: Global ESG Finance Market Volume Trillion Forecast, by Country 2020 & 2033
- Table 93: United Kingdom ESG Finance Market Revenue (Million) Forecast, by Application 2020 & 2033
- Table 94: United Kingdom ESG Finance Market Volume (Trillion) Forecast, by Application 2020 & 2033
- Table 95: Germany ESG Finance Market Revenue (Million) Forecast, by Application 2020 & 2033
- Table 96: Germany ESG Finance Market Volume (Trillion) Forecast, by Application 2020 & 2033
- Table 97: France ESG Finance Market Revenue (Million) Forecast, by Application 2020 & 2033
- Table 98: France ESG Finance Market Volume (Trillion) Forecast, by Application 2020 & 2033
- Table 99: Italy ESG Finance Market Revenue (Million) Forecast, by Application 2020 & 2033
- Table 100: Italy ESG Finance Market Volume (Trillion) Forecast, by Application 2020 & 2033
- Table 101: Spain ESG Finance Market Revenue (Million) Forecast, by Application 2020 & 2033
- Table 102: Spain ESG Finance Market Volume (Trillion) Forecast, by Application 2020 & 2033
- Table 103: Russia ESG Finance Market Revenue (Million) Forecast, by Application 2020 & 2033
- Table 104: Russia ESG Finance Market Volume (Trillion) Forecast, by Application 2020 & 2033
- Table 105: Benelux ESG Finance Market Revenue (Million) Forecast, by Application 2020 & 2033
- Table 106: Benelux ESG Finance Market Volume (Trillion) Forecast, by Application 2020 & 2033
- Table 107: Nordics ESG Finance Market Revenue (Million) Forecast, by Application 2020 & 2033
- Table 108: Nordics ESG Finance Market Volume (Trillion) Forecast, by Application 2020 & 2033
- Table 109: Rest of Europe ESG Finance Market Revenue (Million) Forecast, by Application 2020 & 2033
- Table 110: Rest of Europe ESG Finance Market Volume (Trillion) Forecast, by Application 2020 & 2033
- Table 111: Global ESG Finance Market Revenue Million Forecast, by Investment Type 2020 & 2033
- Table 112: Global ESG Finance Market Volume Trillion Forecast, by Investment Type 2020 & 2033
- Table 113: Global ESG Finance Market Revenue Million Forecast, by Transaction Type 2020 & 2033
- Table 114: Global ESG Finance Market Volume Trillion Forecast, by Transaction Type 2020 & 2033
- Table 115: Global ESG Finance Market Revenue Million Forecast, by Investor Type 2020 & 2033
- Table 116: Global ESG Finance Market Volume Trillion Forecast, by Investor Type 2020 & 2033
- Table 117: Global ESG Finance Market Revenue Million Forecast, by Industry Vertical 2020 & 2033
- Table 118: Global ESG Finance Market Volume Trillion Forecast, by Industry Vertical 2020 & 2033
- Table 119: Global ESG Finance Market Revenue Million Forecast, by North America 2020 & 2033
- Table 120: Global ESG Finance Market Volume Trillion Forecast, by North America 2020 & 2033
- Table 121: Global ESG Finance Market Revenue Million Forecast, by Europe 2020 & 2033
- Table 122: Global ESG Finance Market Volume Trillion Forecast, by Europe 2020 & 2033
- Table 123: Global ESG Finance Market Revenue Million Forecast, by Asia-Pacific 2020 & 2033
- Table 124: Global ESG Finance Market Volume Trillion Forecast, by Asia-Pacific 2020 & 2033
- Table 125: Global ESG Finance Market Revenue Million Forecast, by South America 2020 & 2033
- Table 126: Global ESG Finance Market Volume Trillion Forecast, by South America 2020 & 2033
- Table 127: Global ESG Finance Market Revenue Million Forecast, by Middle-East and Africa 2020 & 2033
- Table 128: Global ESG Finance Market Volume Trillion Forecast, by Middle-East and Africa 2020 & 2033
- Table 129: Global ESG Finance Market Revenue Million Forecast, by Country 2020 & 2033
- Table 130: Global ESG Finance Market Volume Trillion Forecast, by Country 2020 & 2033
- Table 131: Turkey ESG Finance Market Revenue (Million) Forecast, by Application 2020 & 2033
- Table 132: Turkey ESG Finance Market Volume (Trillion) Forecast, by Application 2020 & 2033
- Table 133: Israel ESG Finance Market Revenue (Million) Forecast, by Application 2020 & 2033
- Table 134: Israel ESG Finance Market Volume (Trillion) Forecast, by Application 2020 & 2033
- Table 135: GCC ESG Finance Market Revenue (Million) Forecast, by Application 2020 & 2033
- Table 136: GCC ESG Finance Market Volume (Trillion) Forecast, by Application 2020 & 2033
- Table 137: North Africa ESG Finance Market Revenue (Million) Forecast, by Application 2020 & 2033
- Table 138: North Africa ESG Finance Market Volume (Trillion) Forecast, by Application 2020 & 2033
- Table 139: South Africa ESG Finance Market Revenue (Million) Forecast, by Application 2020 & 2033
- Table 140: South Africa ESG Finance Market Volume (Trillion) Forecast, by Application 2020 & 2033
- Table 141: Rest of Middle East & Africa ESG Finance Market Revenue (Million) Forecast, by Application 2020 & 2033
- Table 142: Rest of Middle East & Africa ESG Finance Market Volume (Trillion) Forecast, by Application 2020 & 2033
- Table 143: Global ESG Finance Market Revenue Million Forecast, by Investment Type 2020 & 2033
- Table 144: Global ESG Finance Market Volume Trillion Forecast, by Investment Type 2020 & 2033
- Table 145: Global ESG Finance Market Revenue Million Forecast, by Transaction Type 2020 & 2033
- Table 146: Global ESG Finance Market Volume Trillion Forecast, by Transaction Type 2020 & 2033
- Table 147: Global ESG Finance Market Revenue Million Forecast, by Investor Type 2020 & 2033
- Table 148: Global ESG Finance Market Volume Trillion Forecast, by Investor Type 2020 & 2033
- Table 149: Global ESG Finance Market Revenue Million Forecast, by Industry Vertical 2020 & 2033
- Table 150: Global ESG Finance Market Volume Trillion Forecast, by Industry Vertical 2020 & 2033
- Table 151: Global ESG Finance Market Revenue Million Forecast, by North America 2020 & 2033
- Table 152: Global ESG Finance Market Volume Trillion Forecast, by North America 2020 & 2033
- Table 153: Global ESG Finance Market Revenue Million Forecast, by Europe 2020 & 2033
- Table 154: Global ESG Finance Market Volume Trillion Forecast, by Europe 2020 & 2033
- Table 155: Global ESG Finance Market Revenue Million Forecast, by Asia-Pacific 2020 & 2033
- Table 156: Global ESG Finance Market Volume Trillion Forecast, by Asia-Pacific 2020 & 2033
- Table 157: Global ESG Finance Market Revenue Million Forecast, by South America 2020 & 2033
- Table 158: Global ESG Finance Market Volume Trillion Forecast, by South America 2020 & 2033
- Table 159: Global ESG Finance Market Revenue Million Forecast, by Middle-East and Africa 2020 & 2033
- Table 160: Global ESG Finance Market Volume Trillion Forecast, by Middle-East and Africa 2020 & 2033
- Table 161: Global ESG Finance Market Revenue Million Forecast, by Country 2020 & 2033
- Table 162: Global ESG Finance Market Volume Trillion Forecast, by Country 2020 & 2033
- Table 163: China ESG Finance Market Revenue (Million) Forecast, by Application 2020 & 2033
- Table 164: China ESG Finance Market Volume (Trillion) Forecast, by Application 2020 & 2033
- Table 165: India ESG Finance Market Revenue (Million) Forecast, by Application 2020 & 2033
- Table 166: India ESG Finance Market Volume (Trillion) Forecast, by Application 2020 & 2033
- Table 167: Japan ESG Finance Market Revenue (Million) Forecast, by Application 2020 & 2033
- Table 168: Japan ESG Finance Market Volume (Trillion) Forecast, by Application 2020 & 2033
- Table 169: South Korea ESG Finance Market Revenue (Million) Forecast, by Application 2020 & 2033
- Table 170: South Korea ESG Finance Market Volume (Trillion) Forecast, by Application 2020 & 2033
- Table 171: ASEAN ESG Finance Market Revenue (Million) Forecast, by Application 2020 & 2033
- Table 172: ASEAN ESG Finance Market Volume (Trillion) Forecast, by Application 2020 & 2033
- Table 173: Oceania ESG Finance Market Revenue (Million) Forecast, by Application 2020 & 2033
- Table 174: Oceania ESG Finance Market Volume (Trillion) Forecast, by Application 2020 & 2033
- Table 175: Rest of Asia Pacific ESG Finance Market Revenue (Million) Forecast, by Application 2020 & 2033
- Table 176: Rest of Asia Pacific ESG Finance Market Volume (Trillion) Forecast, by Application 2020 & 2033
Frequently Asked Questions
1. What is the projected Compound Annual Growth Rate (CAGR) of the ESG Finance Market?
The projected CAGR is approximately 10.04%.
2. Which companies are prominent players in the ESG Finance Market?
Key companies in the market include BlackRock Inc, State Street Corporation, Morgan Stanley, UBS, JPMorgan Chase & Co, Franklin Templeton Investments, Amundi US, The Bank of New York Mellon Corporation, Deutsche Bank AG, Goldman Sachs* *List Not Exhaustive.
3. What are the main segments of the ESG Finance Market?
The market segments include Investment Type, Transaction Type, Investor Type, Industry Vertical, North America, Europe, Asia-Pacific, South America, Middle-East and Africa.
4. Can you provide details about the market size?
The market size is estimated to be USD 7.02 Million as of 2022.
5. What are some drivers contributing to market growth?
Rise in Investment in Businesses with Sustainable Practices is a Driving Force Behind the Growth of The Sustainable Finance Market; Increasing Government Initiative Towards Sustainability.
6. What are the notable trends driving market growth?
Rising Investments in Green Bonds.
7. Are there any restraints impacting market growth?
Rise in Investment in Businesses with Sustainable Practices is a Driving Force Behind the Growth of The Sustainable Finance Market; Increasing Government Initiative Towards Sustainability.
8. Can you provide examples of recent developments in the market?
In February 2024, State Street Corporation acquired CF Global Trading. CF Global Trading is a global provider of agency-based trading services for a wide range of asset classes, including stocks, listed derivatives, and fixed-income instruments. Terms of the transaction were not disclosed.
9. What pricing options are available for accessing the report?
Pricing options include single-user, multi-user, and enterprise licenses priced at USD 3800, USD 4500, and USD 5800 respectively.
10. Is the market size provided in terms of value or volume?
The market size is provided in terms of value, measured in Million and volume, measured in Trillion.
11. Are there any specific market keywords associated with the report?
Yes, the market keyword associated with the report is "ESG Finance Market," which aids in identifying and referencing the specific market segment covered.
12. How do I determine which pricing option suits my needs best?
The pricing options vary based on user requirements and access needs. Individual users may opt for single-user licenses, while businesses requiring broader access may choose multi-user or enterprise licenses for cost-effective access to the report.
13. Are there any additional resources or data provided in the ESG Finance Market report?
While the report offers comprehensive insights, it's advisable to review the specific contents or supplementary materials provided to ascertain if additional resources or data are available.
14. How can I stay updated on further developments or reports in the ESG Finance Market?
To stay informed about further developments, trends, and reports in the ESG Finance Market, consider subscribing to industry newsletters, following relevant companies and organizations, or regularly checking reputable industry news sources and publications.
Methodology
Step 1 - Identification of Relevant Samples Size from Population Database


Step 2 - Approaches for Defining Global Market Size (Value, Volume* & Price*)

Note*: In applicable scenarios
Step 3 - Data Sources
Primary Research
- Web Analytics
- Survey Reports
- Research Institute
- Latest Research Reports
- Opinion Leaders
Secondary Research
- Annual Reports
- White Paper
- Latest Press Release
- Industry Association
- Paid Database
- Investor Presentations

Step 4 - Data Triangulation
Involves using different sources of information in order to increase the validity of a study
These sources are likely to be stakeholders in a program - participants, other researchers, program staff, other community members, and so on.
Then we put all data in single framework & apply various statistical tools to find out the dynamic on the market.
During the analysis stage, feedback from the stakeholder groups would be compared to determine areas of agreement as well as areas of divergence