

Key Insights
The global pure gas market is poised for substantial growth, projected to expand at a Compound Annual Growth Rate (CAGR) of 4.4%. With an estimated market size of $119.11 billion in 2025, this industry presents significant opportunities driven by escalating demand across critical sectors including electronics, metal production, and healthcare. Key growth drivers include high-purity atmospheric gases, noble gases, and carbon gases, essential for applications such as insulation, lighting, and advanced coolant systems. The Asia-Pacific region, led by China and India, is expected to spearhead this expansion due to rapid industrialization and increasing consumer purchasing power. Technological innovations enhancing gas production efficiency and purity further contribute to market development. However, adherence to stringent regulatory frameworks and potential supply chain vulnerabilities may present challenges.
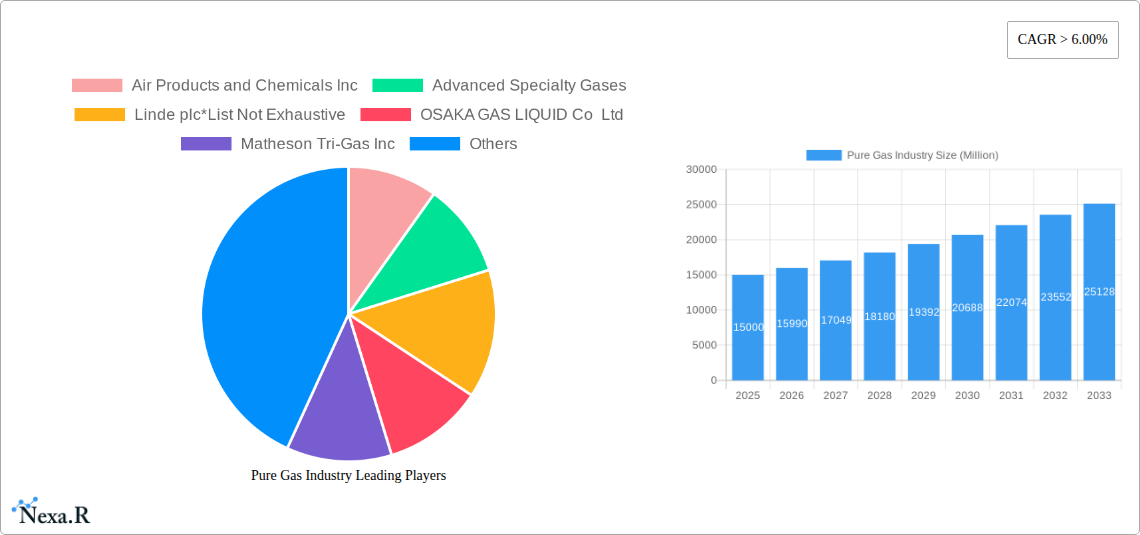
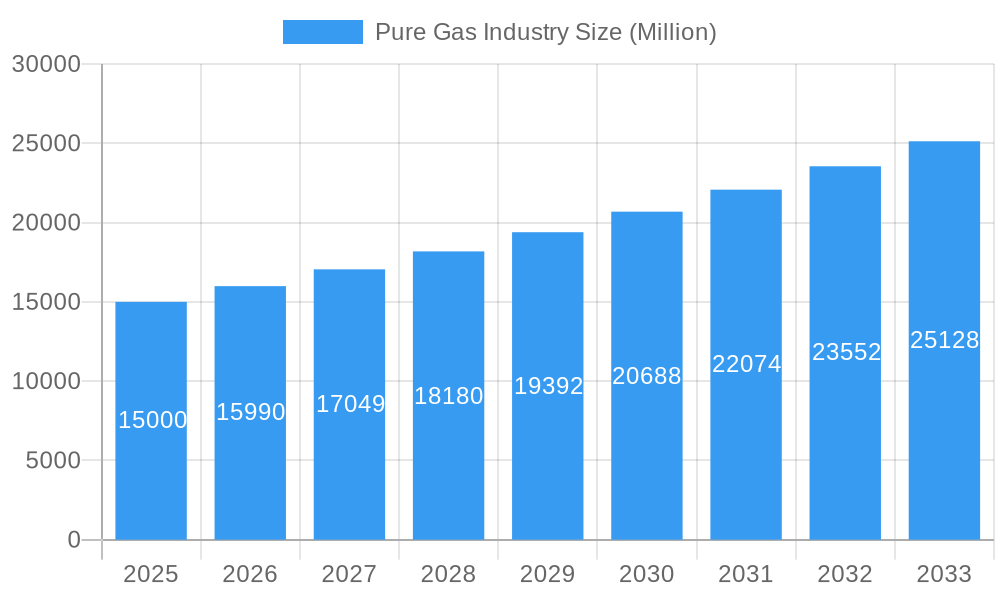
Pure Gas Industry Market Size (In Billion)
Market segmentation reveals key segments within the pure gas industry, categorized by product types—High-Purity Atmospheric Gases, Noble Gases, Carbon Gases, and Others—and by application—Insulation, Lighting, Coolant, and Others. While the electronics and metal production sectors remain dominant end-users, the medical and healthcare industries are exhibiting strong growth, fueled by the demand for specialized medical-grade gases. North America and Europe currently hold substantial market shares; however, the dynamic growth trajectory of the Asia-Pacific region is set to reshape the global market landscape. The competitive environment features established global leaders such as Air Products and Chemicals, Linde plc, Air Liquide, and Messer Group, alongside numerous regional and specialized suppliers. Strategic initiatives focusing on innovation, market expansion, and mergers and acquisitions will be pivotal in defining market dynamics throughout the forecast period (2025-2033). Understanding regional growth trends and the specific needs of diverse end-user industries is paramount for stakeholders aiming to leverage this expanding market.
Pure Gas Industry Company Market Share
Pure Gas Industry Market Report: 2019-2033
This comprehensive report provides an in-depth analysis of the Pure Gas Industry, encompassing market dynamics, growth trends, regional dominance, product landscapes, key players, and future outlook. The study covers the period 2019-2033, with a base year of 2025 and a forecast period of 2025-2033. This report is crucial for industry professionals, investors, and strategic decision-makers seeking a clear understanding of this dynamic market. The report segments the market by product type (High-Purity Atmospheric Gases, Noble Gases, Carbon Gases, Other Product Types), application (Insulation, Lighting, Coolant, Other Applications), and end-user industry (Electronics, Metal Production, Chemicals, Energy and Power, Medical and Healthcare, Food and Beverages, Other End-user Industries).
Pure Gas Industry Market Dynamics & Structure
The Pure Gas Industry is characterized by a moderately concentrated market structure with several major global players and numerous regional competitors. Market size in 2025 is estimated at xx Million units. Technological innovation, particularly in gas purification and delivery systems, is a key driver, while stringent regulatory frameworks concerning safety and environmental impact pose significant challenges. The industry witnesses continuous M&A activity, aiming for market consolidation and expansion. Competitive product substitutes, such as alternative cooling technologies, are also influencing market dynamics.
- Market Concentration: The top 5 players hold approximately xx% of the market share in 2025.
- Technological Innovation: Focus on improving gas purity, efficiency of delivery systems, and reducing environmental impact drives innovation.
- Regulatory Framework: Stringent safety and environmental regulations impact operational costs and market entry barriers.
- Competitive Substitutes: Alternative technologies for applications like cooling and lighting create competitive pressure.
- M&A Activity: An average of xx M&A deals were recorded annually during the historical period (2019-2024), with a total deal value of xx Million units.
- End-User Demographics: The Electronics and Medical and Healthcare sectors are key growth drivers.
Pure Gas Industry Growth Trends & Insights
The Pure Gas Industry has experienced steady growth over the historical period (2019-2024), with a CAGR of xx%. This growth is driven by increasing demand from various end-user industries, particularly electronics and healthcare, coupled with technological advancements leading to improved product efficiency and performance. Market penetration in key regions like North America and Europe is high, whereas emerging markets show significant growth potential. Technological disruptions, such as the development of advanced purification techniques and the adoption of smart gas management systems, are further propelling market expansion. Consumer behavior shifts towards eco-friendly and sustainable solutions also influence market growth. The forecast period (2025-2033) anticipates continued growth with a projected CAGR of xx%, reaching a market size of xx Million units by 2033.
Dominant Regions, Countries, or Segments in Pure Gas Industry
North America currently dominates the Pure Gas Industry, holding the largest market share in 2025, estimated at xx%. This dominance is primarily attributed to the region's robust industrial base, particularly in the electronics and chemical sectors, coupled with a well-established regulatory framework. Europe follows as the second-largest market, driven by similar factors. However, Asia-Pacific is expected to witness the fastest growth during the forecast period, fueled by rapid industrialization and increasing demand from emerging economies.
Key Growth Drivers:
- North America: Strong industrial base, advanced technologies, and high consumer spending.
- Europe: Established regulatory framework, focus on sustainable technologies, and high technological advancements.
- Asia-Pacific: Rapid industrialization, rising disposable incomes, and government initiatives promoting industrial growth.
Dominant Segments:
- Product Type: High-Purity Atmospheric Gases represent the largest segment, accounting for xx% of the market in 2025.
- Application: The Electronics industry is the leading application segment, with xx% market share in 2025.
- End-User Industry: The Electronics and Medical and Healthcare sectors show the highest growth potential.
Pure Gas Industry Product Landscape
The Pure Gas Industry showcases a diverse product portfolio, including high-purity atmospheric gases like oxygen and nitrogen, noble gases like helium and argon, carbon gases like carbon dioxide, and various other specialized gases. Innovation focuses on enhancing gas purity levels, developing more efficient delivery systems, and creating specialized gas mixtures for specific applications. Products are differentiated based on purity levels, packaging, and specialized delivery systems. Technological advancements include the use of membrane separation technologies and cryogenic distillation for enhanced gas purification.
Key Drivers, Barriers & Challenges in Pure Gas Industry
Key Drivers:
- Increasing demand from various end-user industries, especially electronics and healthcare.
- Technological advancements in gas purification and delivery systems.
- Government initiatives promoting industrial growth and environmental sustainability.
Key Barriers and Challenges:
- Stringent safety and environmental regulations.
- Fluctuations in raw material prices.
- Intense competition from both established players and new entrants. This has resulted in price pressures and reduced profit margins. The estimated impact is a reduction in overall market profitability by approximately xx% in 2025 compared to 2019.
- Supply chain disruptions can lead to significant production delays and increased costs. For example, the xx disruption in xx impacted xx% of the market’s production capacity.
Emerging Opportunities in Pure Gas Industry
- Growing demand for specialized gas mixtures in niche applications.
- Expansion into emerging markets with high growth potential.
- Development of eco-friendly and sustainable gas production technologies.
- Increased focus on digitalization and automation in gas delivery and management.
Growth Accelerators in the Pure Gas Industry Industry
The Pure Gas Industry is poised for continued growth driven by several factors. Technological breakthroughs in gas purification, advancements in delivery systems, and strategic partnerships for market expansion are key catalysts. The increasing adoption of sustainable and eco-friendly gas production methods will further accelerate market growth. Expansion into emerging markets with high growth potential, especially in Asia-Pacific, offers significant opportunities for market players.
Key Players Shaping the Pure Gas Industry Market
- Air Products and Chemicals Inc
- Advanced Specialty Gases
- Linde plc
- OSAKA GAS LIQUID Co Ltd
- Matheson Tri-Gas Inc
- Iwatani Corporation
- American Welding & Gas
- Messer Group
- Air Liquide
- Airgas Inc
Notable Milestones in Pure Gas Industry Sector
- 2021-Q3: Linde plc announced a significant investment in a new high-purity gas production facility in Germany.
- 2022-Q1: Air Products and Chemicals Inc launched a new line of specialized gas mixtures for the semiconductor industry.
- 2023-Q2: Messer Group acquired a smaller regional competitor, expanding its market presence. (Further details on acquisitions are not available for the remaining period).
In-Depth Pure Gas Industry Market Outlook
The Pure Gas Industry is expected to witness continued growth over the forecast period (2025-2033), driven by technological innovations, increasing demand from diverse end-user industries, and expansion into new markets. Strategic partnerships and investments in research and development will further enhance market dynamics. Companies adopting sustainable and efficient production methods will gain a competitive advantage. The market presents significant opportunities for both established players and new entrants willing to innovate and adapt to evolving industry needs. The continued expansion of the electronics and medical sectors will drive demand for high-purity gases.
Pure Gas Industry Segmentation
-
1. Product Type
- 1.1. High-Purity Atmospheric Gases
- 1.2. Noble Gases
- 1.3. Carbon Gases
- 1.4. Other Product Types
-
2. Application
- 2.1. Insulation
- 2.2. Lighting
- 2.3. Coolant
- 2.4. Other Applications
-
3. End-user Industry
- 3.1. Electronics
- 3.2. Metal Production
- 3.3. Chemicals
- 3.4. Energy and Power
- 3.5. Medical and Healthcare
- 3.6. Food and Beverages
- 3.7. Other End-user Industries
Pure Gas Industry Segmentation By Geography
-
1. Asia Pacific
- 1.1. China
- 1.2. India
- 1.3. Japan
- 1.4. South Korea
- 1.5. ASEAN Countries
- 1.6. Rest of Asia Pacific
-
2. North America
- 2.1. United States
- 2.2. Canada
- 2.3. Mexico
-
3. Europe
- 3.1. Germany
- 3.2. United Kingdom
- 3.3. Italy
- 3.4. France
- 3.5. Rest of Europe
-
4. South America
- 4.1. Brazil
- 4.2. Argentina
- 4.3. Rest of South America
-
5. Middle East and Africa
- 5.1. Saudi Arabia
- 5.2. South Africa
- 5.3. Rest of Middle East and Africa
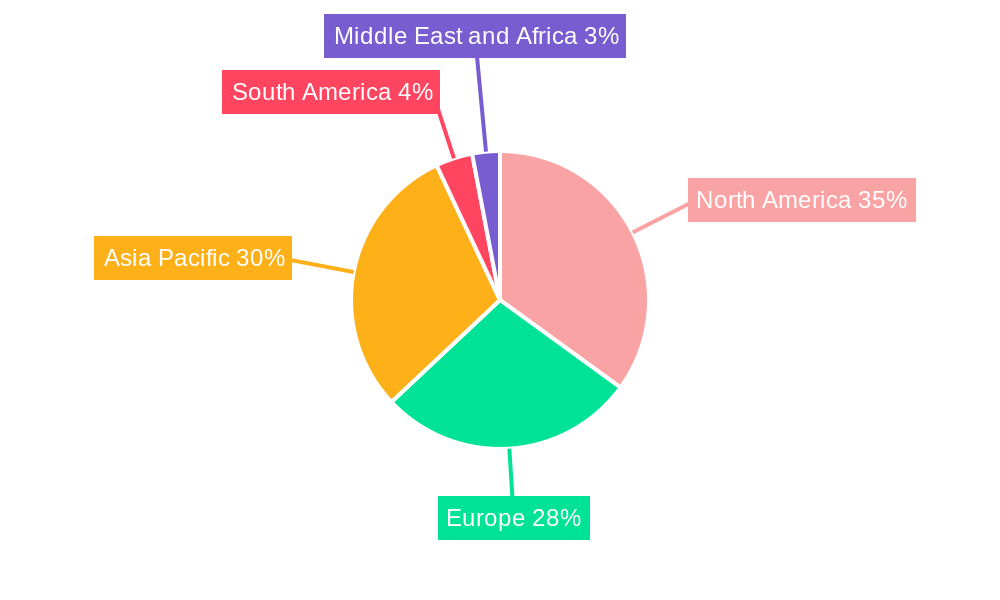
Pure Gas Industry Regional Market Share
Geographic Coverage of Pure Gas Industry
Pure Gas Industry REPORT HIGHLIGHTS
| Aspects | Details |
|---|---|
| Study Period | 2020-2034 |
| Base Year | 2025 |
| Estimated Year | 2026 |
| Forecast Period | 2026-2034 |
| Historical Period | 2020-2025 |
| Growth Rate | CAGR of 4.4% from 2020-2034 |
| Segmentation |
|
Table of Contents
- 1. Introduction
- 1.1. Research Scope
- 1.2. Market Segmentation
- 1.3. Research Objective
- 1.4. Definitions and Assumptions
- 2. Executive Summary
- 2.1. Market Snapshot
- 3. Market Dynamics
- 3.1. Market Drivers
- 3.2. Market Restrains
- 3.3. Market Trends
- 3.4. Market Opportunities
- 4. Market Factor Analysis
- 4.1. Porters Five Forces
- 4.1.1. Bargaining Power of Suppliers
- 4.1.2. Bargaining Power of Buyers
- 4.1.3. Threat of New Entrants
- 4.1.4. Threat of Substitutes
- 4.1.5. Competitive Rivalry
- 4.2. PESTEL analysis
- 4.3. BCG Analysis
- 4.3.1. Stars (High Growth, High Market Share)
- 4.3.2. Cash Cows (Low Growth, High Market Share)
- 4.3.3. Question Mark (High Growth, Low Market Share)
- 4.3.4. Dogs (Low Growth, Low Market Share)
- 4.4. Ansoff Matrix Analysis
- 4.5. Supply Chain Analysis
- 4.6. Regulatory Landscape
- 4.7. Current Market Potential and Opportunity Assessment (TAM–SAM–SOM Framework)
- 4.8. NRP Analyst Note
- 4.1. Porters Five Forces
- 5. Market Analysis, Insights and Forecast 2021-2033
- 5.1. Market Analysis, Insights and Forecast - by Product Type
- 5.1.1. High-Purity Atmospheric Gases
- 5.1.2. Noble Gases
- 5.1.3. Carbon Gases
- 5.1.4. Other Product Types
- 5.2. Market Analysis, Insights and Forecast - by Application
- 5.2.1. Insulation
- 5.2.2. Lighting
- 5.2.3. Coolant
- 5.2.4. Other Applications
- 5.3. Market Analysis, Insights and Forecast - by End-user Industry
- 5.3.1. Electronics
- 5.3.2. Metal Production
- 5.3.3. Chemicals
- 5.3.4. Energy and Power
- 5.3.5. Medical and Healthcare
- 5.3.6. Food and Beverages
- 5.3.7. Other End-user Industries
- 5.4. Market Analysis, Insights and Forecast - by Region
- 5.4.1. Asia Pacific
- 5.4.2. North America
- 5.4.3. Europe
- 5.4.4. South America
- 5.4.5. Middle East and Africa
- 5.1. Market Analysis, Insights and Forecast - by Product Type
- 6. Global Pure Gas Industry Analysis, Insights and Forecast, 2021-2033
- 6.1. Market Analysis, Insights and Forecast - by Product Type
- 6.1.1. High-Purity Atmospheric Gases
- 6.1.2. Noble Gases
- 6.1.3. Carbon Gases
- 6.1.4. Other Product Types
- 6.2. Market Analysis, Insights and Forecast - by Application
- 6.2.1. Insulation
- 6.2.2. Lighting
- 6.2.3. Coolant
- 6.2.4. Other Applications
- 6.3. Market Analysis, Insights and Forecast - by End-user Industry
- 6.3.1. Electronics
- 6.3.2. Metal Production
- 6.3.3. Chemicals
- 6.3.4. Energy and Power
- 6.3.5. Medical and Healthcare
- 6.3.6. Food and Beverages
- 6.3.7. Other End-user Industries
- 6.1. Market Analysis, Insights and Forecast - by Product Type
- 7. Asia Pacific Pure Gas Industry Analysis, Insights and Forecast, 2020-2032
- 7.1. Market Analysis, Insights and Forecast - by Product Type
- 7.1.1. High-Purity Atmospheric Gases
- 7.1.2. Noble Gases
- 7.1.3. Carbon Gases
- 7.1.4. Other Product Types
- 7.2. Market Analysis, Insights and Forecast - by Application
- 7.2.1. Insulation
- 7.2.2. Lighting
- 7.2.3. Coolant
- 7.2.4. Other Applications
- 7.3. Market Analysis, Insights and Forecast - by End-user Industry
- 7.3.1. Electronics
- 7.3.2. Metal Production
- 7.3.3. Chemicals
- 7.3.4. Energy and Power
- 7.3.5. Medical and Healthcare
- 7.3.6. Food and Beverages
- 7.3.7. Other End-user Industries
- 7.1. Market Analysis, Insights and Forecast - by Product Type
- 8. North America Pure Gas Industry Analysis, Insights and Forecast, 2020-2032
- 8.1. Market Analysis, Insights and Forecast - by Product Type
- 8.1.1. High-Purity Atmospheric Gases
- 8.1.2. Noble Gases
- 8.1.3. Carbon Gases
- 8.1.4. Other Product Types
- 8.2. Market Analysis, Insights and Forecast - by Application
- 8.2.1. Insulation
- 8.2.2. Lighting
- 8.2.3. Coolant
- 8.2.4. Other Applications
- 8.3. Market Analysis, Insights and Forecast - by End-user Industry
- 8.3.1. Electronics
- 8.3.2. Metal Production
- 8.3.3. Chemicals
- 8.3.4. Energy and Power
- 8.3.5. Medical and Healthcare
- 8.3.6. Food and Beverages
- 8.3.7. Other End-user Industries
- 8.1. Market Analysis, Insights and Forecast - by Product Type
- 9. Europe Pure Gas Industry Analysis, Insights and Forecast, 2020-2032
- 9.1. Market Analysis, Insights and Forecast - by Product Type
- 9.1.1. High-Purity Atmospheric Gases
- 9.1.2. Noble Gases
- 9.1.3. Carbon Gases
- 9.1.4. Other Product Types
- 9.2. Market Analysis, Insights and Forecast - by Application
- 9.2.1. Insulation
- 9.2.2. Lighting
- 9.2.3. Coolant
- 9.2.4. Other Applications
- 9.3. Market Analysis, Insights and Forecast - by End-user Industry
- 9.3.1. Electronics
- 9.3.2. Metal Production
- 9.3.3. Chemicals
- 9.3.4. Energy and Power
- 9.3.5. Medical and Healthcare
- 9.3.6. Food and Beverages
- 9.3.7. Other End-user Industries
- 9.1. Market Analysis, Insights and Forecast - by Product Type
- 10. South America Pure Gas Industry Analysis, Insights and Forecast, 2020-2032
- 10.1. Market Analysis, Insights and Forecast - by Product Type
- 10.1.1. High-Purity Atmospheric Gases
- 10.1.2. Noble Gases
- 10.1.3. Carbon Gases
- 10.1.4. Other Product Types
- 10.2. Market Analysis, Insights and Forecast - by Application
- 10.2.1. Insulation
- 10.2.2. Lighting
- 10.2.3. Coolant
- 10.2.4. Other Applications
- 10.3. Market Analysis, Insights and Forecast - by End-user Industry
- 10.3.1. Electronics
- 10.3.2. Metal Production
- 10.3.3. Chemicals
- 10.3.4. Energy and Power
- 10.3.5. Medical and Healthcare
- 10.3.6. Food and Beverages
- 10.3.7. Other End-user Industries
- 10.1. Market Analysis, Insights and Forecast - by Product Type
- 11. Middle East and Africa Pure Gas Industry Analysis, Insights and Forecast, 2020-2032
- 11.1. Market Analysis, Insights and Forecast - by Product Type
- 11.1.1. High-Purity Atmospheric Gases
- 11.1.2. Noble Gases
- 11.1.3. Carbon Gases
- 11.1.4. Other Product Types
- 11.2. Market Analysis, Insights and Forecast - by Application
- 11.2.1. Insulation
- 11.2.2. Lighting
- 11.2.3. Coolant
- 11.2.4. Other Applications
- 11.3. Market Analysis, Insights and Forecast - by End-user Industry
- 11.3.1. Electronics
- 11.3.2. Metal Production
- 11.3.3. Chemicals
- 11.3.4. Energy and Power
- 11.3.5. Medical and Healthcare
- 11.3.6. Food and Beverages
- 11.3.7. Other End-user Industries
- 11.1. Market Analysis, Insights and Forecast - by Product Type
- 12. Competitive Analysis
- 12.1. Company Profiles
- 12.1.1 Air Products and Chemicals Inc
- 12.1.1.1. Company Overview
- 12.1.1.2. Products
- 12.1.1.3. Company Financials
- 12.1.1.4. SWOT Analysis
- 12.1.2 Advanced Specialty Gases
- 12.1.2.1. Company Overview
- 12.1.2.2. Products
- 12.1.2.3. Company Financials
- 12.1.2.4. SWOT Analysis
- 12.1.3 Linde plc*List Not Exhaustive
- 12.1.3.1. Company Overview
- 12.1.3.2. Products
- 12.1.3.3. Company Financials
- 12.1.3.4. SWOT Analysis
- 12.1.4 OSAKA GAS LIQUID Co Ltd
- 12.1.4.1. Company Overview
- 12.1.4.2. Products
- 12.1.4.3. Company Financials
- 12.1.4.4. SWOT Analysis
- 12.1.5 Matheson Tri-Gas Inc
- 12.1.5.1. Company Overview
- 12.1.5.2. Products
- 12.1.5.3. Company Financials
- 12.1.5.4. SWOT Analysis
- 12.1.6 Iwatani Corporation
- 12.1.6.1. Company Overview
- 12.1.6.2. Products
- 12.1.6.3. Company Financials
- 12.1.6.4. SWOT Analysis
- 12.1.7 American Welding & Gas
- 12.1.7.1. Company Overview
- 12.1.7.2. Products
- 12.1.7.3. Company Financials
- 12.1.7.4. SWOT Analysis
- 12.1.8 Messer Group
- 12.1.8.1. Company Overview
- 12.1.8.2. Products
- 12.1.8.3. Company Financials
- 12.1.8.4. SWOT Analysis
- 12.1.9 Air Liquide
- 12.1.9.1. Company Overview
- 12.1.9.2. Products
- 12.1.9.3. Company Financials
- 12.1.9.4. SWOT Analysis
- 12.1.10 Airgas Inc
- 12.1.10.1. Company Overview
- 12.1.10.2. Products
- 12.1.10.3. Company Financials
- 12.1.10.4. SWOT Analysis
- 12.1.1 Air Products and Chemicals Inc
- 12.2. Market Entropy
- 12.2.1 Company's Key Areas Served
- 12.2.2 Recent Developments
- 12.3. Company Market Share Analysis 2025
- 12.3.1 Top 5 Companies Market Share Analysis
- 12.3.2 Top 3 Companies Market Share Analysis
- 12.4. List of Potential Customers
- 13. Research Methodology
List of Figures
- Figure 1: Global Pure Gas Industry Revenue Breakdown (billion, %) by Region 2025 & 2033
- Figure 2: Asia Pacific Pure Gas Industry Revenue (billion), by Product Type 2025 & 2033
- Figure 3: Asia Pacific Pure Gas Industry Revenue Share (%), by Product Type 2025 & 2033
- Figure 4: Asia Pacific Pure Gas Industry Revenue (billion), by Application 2025 & 2033
- Figure 5: Asia Pacific Pure Gas Industry Revenue Share (%), by Application 2025 & 2033
- Figure 6: Asia Pacific Pure Gas Industry Revenue (billion), by End-user Industry 2025 & 2033
- Figure 7: Asia Pacific Pure Gas Industry Revenue Share (%), by End-user Industry 2025 & 2033
- Figure 8: Asia Pacific Pure Gas Industry Revenue (billion), by Country 2025 & 2033
- Figure 9: Asia Pacific Pure Gas Industry Revenue Share (%), by Country 2025 & 2033
- Figure 10: North America Pure Gas Industry Revenue (billion), by Product Type 2025 & 2033
- Figure 11: North America Pure Gas Industry Revenue Share (%), by Product Type 2025 & 2033
- Figure 12: North America Pure Gas Industry Revenue (billion), by Application 2025 & 2033
- Figure 13: North America Pure Gas Industry Revenue Share (%), by Application 2025 & 2033
- Figure 14: North America Pure Gas Industry Revenue (billion), by End-user Industry 2025 & 2033
- Figure 15: North America Pure Gas Industry Revenue Share (%), by End-user Industry 2025 & 2033
- Figure 16: North America Pure Gas Industry Revenue (billion), by Country 2025 & 2033
- Figure 17: North America Pure Gas Industry Revenue Share (%), by Country 2025 & 2033
- Figure 18: Europe Pure Gas Industry Revenue (billion), by Product Type 2025 & 2033
- Figure 19: Europe Pure Gas Industry Revenue Share (%), by Product Type 2025 & 2033
- Figure 20: Europe Pure Gas Industry Revenue (billion), by Application 2025 & 2033
- Figure 21: Europe Pure Gas Industry Revenue Share (%), by Application 2025 & 2033
- Figure 22: Europe Pure Gas Industry Revenue (billion), by End-user Industry 2025 & 2033
- Figure 23: Europe Pure Gas Industry Revenue Share (%), by End-user Industry 2025 & 2033
- Figure 24: Europe Pure Gas Industry Revenue (billion), by Country 2025 & 2033
- Figure 25: Europe Pure Gas Industry Revenue Share (%), by Country 2025 & 2033
- Figure 26: South America Pure Gas Industry Revenue (billion), by Product Type 2025 & 2033
- Figure 27: South America Pure Gas Industry Revenue Share (%), by Product Type 2025 & 2033
- Figure 28: South America Pure Gas Industry Revenue (billion), by Application 2025 & 2033
- Figure 29: South America Pure Gas Industry Revenue Share (%), by Application 2025 & 2033
- Figure 30: South America Pure Gas Industry Revenue (billion), by End-user Industry 2025 & 2033
- Figure 31: South America Pure Gas Industry Revenue Share (%), by End-user Industry 2025 & 2033
- Figure 32: South America Pure Gas Industry Revenue (billion), by Country 2025 & 2033
- Figure 33: South America Pure Gas Industry Revenue Share (%), by Country 2025 & 2033
- Figure 34: Middle East and Africa Pure Gas Industry Revenue (billion), by Product Type 2025 & 2033
- Figure 35: Middle East and Africa Pure Gas Industry Revenue Share (%), by Product Type 2025 & 2033
- Figure 36: Middle East and Africa Pure Gas Industry Revenue (billion), by Application 2025 & 2033
- Figure 37: Middle East and Africa Pure Gas Industry Revenue Share (%), by Application 2025 & 2033
- Figure 38: Middle East and Africa Pure Gas Industry Revenue (billion), by End-user Industry 2025 & 2033
- Figure 39: Middle East and Africa Pure Gas Industry Revenue Share (%), by End-user Industry 2025 & 2033
- Figure 40: Middle East and Africa Pure Gas Industry Revenue (billion), by Country 2025 & 2033
- Figure 41: Middle East and Africa Pure Gas Industry Revenue Share (%), by Country 2025 & 2033
List of Tables
- Table 1: Global Pure Gas Industry Revenue billion Forecast, by Product Type 2020 & 2033
- Table 2: Global Pure Gas Industry Revenue billion Forecast, by Application 2020 & 2033
- Table 3: Global Pure Gas Industry Revenue billion Forecast, by End-user Industry 2020 & 2033
- Table 4: Global Pure Gas Industry Revenue billion Forecast, by Region 2020 & 2033
- Table 5: Global Pure Gas Industry Revenue billion Forecast, by Product Type 2020 & 2033
- Table 6: Global Pure Gas Industry Revenue billion Forecast, by Application 2020 & 2033
- Table 7: Global Pure Gas Industry Revenue billion Forecast, by End-user Industry 2020 & 2033
- Table 8: Global Pure Gas Industry Revenue billion Forecast, by Country 2020 & 2033
- Table 9: China Pure Gas Industry Revenue (billion) Forecast, by Application 2020 & 2033
- Table 10: India Pure Gas Industry Revenue (billion) Forecast, by Application 2020 & 2033
- Table 11: Japan Pure Gas Industry Revenue (billion) Forecast, by Application 2020 & 2033
- Table 12: South Korea Pure Gas Industry Revenue (billion) Forecast, by Application 2020 & 2033
- Table 13: ASEAN Countries Pure Gas Industry Revenue (billion) Forecast, by Application 2020 & 2033
- Table 14: Rest of Asia Pacific Pure Gas Industry Revenue (billion) Forecast, by Application 2020 & 2033
- Table 15: Global Pure Gas Industry Revenue billion Forecast, by Product Type 2020 & 2033
- Table 16: Global Pure Gas Industry Revenue billion Forecast, by Application 2020 & 2033
- Table 17: Global Pure Gas Industry Revenue billion Forecast, by End-user Industry 2020 & 2033
- Table 18: Global Pure Gas Industry Revenue billion Forecast, by Country 2020 & 2033
- Table 19: United States Pure Gas Industry Revenue (billion) Forecast, by Application 2020 & 2033
- Table 20: Canada Pure Gas Industry Revenue (billion) Forecast, by Application 2020 & 2033
- Table 21: Mexico Pure Gas Industry Revenue (billion) Forecast, by Application 2020 & 2033
- Table 22: Global Pure Gas Industry Revenue billion Forecast, by Product Type 2020 & 2033
- Table 23: Global Pure Gas Industry Revenue billion Forecast, by Application 2020 & 2033
- Table 24: Global Pure Gas Industry Revenue billion Forecast, by End-user Industry 2020 & 2033
- Table 25: Global Pure Gas Industry Revenue billion Forecast, by Country 2020 & 2033
- Table 26: Germany Pure Gas Industry Revenue (billion) Forecast, by Application 2020 & 2033
- Table 27: United Kingdom Pure Gas Industry Revenue (billion) Forecast, by Application 2020 & 2033
- Table 28: Italy Pure Gas Industry Revenue (billion) Forecast, by Application 2020 & 2033
- Table 29: France Pure Gas Industry Revenue (billion) Forecast, by Application 2020 & 2033
- Table 30: Rest of Europe Pure Gas Industry Revenue (billion) Forecast, by Application 2020 & 2033
- Table 31: Global Pure Gas Industry Revenue billion Forecast, by Product Type 2020 & 2033
- Table 32: Global Pure Gas Industry Revenue billion Forecast, by Application 2020 & 2033
- Table 33: Global Pure Gas Industry Revenue billion Forecast, by End-user Industry 2020 & 2033
- Table 34: Global Pure Gas Industry Revenue billion Forecast, by Country 2020 & 2033
- Table 35: Brazil Pure Gas Industry Revenue (billion) Forecast, by Application 2020 & 2033
- Table 36: Argentina Pure Gas Industry Revenue (billion) Forecast, by Application 2020 & 2033
- Table 37: Rest of South America Pure Gas Industry Revenue (billion) Forecast, by Application 2020 & 2033
- Table 38: Global Pure Gas Industry Revenue billion Forecast, by Product Type 2020 & 2033
- Table 39: Global Pure Gas Industry Revenue billion Forecast, by Application 2020 & 2033
- Table 40: Global Pure Gas Industry Revenue billion Forecast, by End-user Industry 2020 & 2033
- Table 41: Global Pure Gas Industry Revenue billion Forecast, by Country 2020 & 2033
- Table 42: Saudi Arabia Pure Gas Industry Revenue (billion) Forecast, by Application 2020 & 2033
- Table 43: South Africa Pure Gas Industry Revenue (billion) Forecast, by Application 2020 & 2033
- Table 44: Rest of Middle East and Africa Pure Gas Industry Revenue (billion) Forecast, by Application 2020 & 2033
Frequently Asked Questions
1. What is the projected Compound Annual Growth Rate (CAGR) of the Pure Gas Industry?
The projected CAGR is approximately 4.4%.
2. Which companies are prominent players in the Pure Gas Industry?
Key companies in the market include Air Products and Chemicals Inc, Advanced Specialty Gases, Linde plc*List Not Exhaustive, OSAKA GAS LIQUID Co Ltd, Matheson Tri-Gas Inc, Iwatani Corporation, American Welding & Gas, Messer Group, Air Liquide, Airgas Inc.
3. What are the main segments of the Pure Gas Industry?
The market segments include Product Type, Application, End-user Industry.
4. Can you provide details about the market size?
The market size is estimated to be USD 119.11 billion as of 2022.
5. What are some drivers contributing to market growth?
; Increasing Demand from Electronics Industry; Rising Demand for Solar PV Production.
6. What are the notable trends driving market growth?
Noble Gas Product Type to Dominate the Market.
7. Are there any restraints impacting market growth?
; High Cost of Indium Tin Oxide; Other Restraints.
8. Can you provide examples of recent developments in the market?
N/A
9. What pricing options are available for accessing the report?
Pricing options include single-user, multi-user, and enterprise licenses priced at USD 4750, USD 5250, and USD 8750 respectively.
10. Is the market size provided in terms of value or volume?
The market size is provided in terms of value, measured in billion.
11. Are there any specific market keywords associated with the report?
Yes, the market keyword associated with the report is "Pure Gas Industry," which aids in identifying and referencing the specific market segment covered.
12. How do I determine which pricing option suits my needs best?
The pricing options vary based on user requirements and access needs. Individual users may opt for single-user licenses, while businesses requiring broader access may choose multi-user or enterprise licenses for cost-effective access to the report.
13. Are there any additional resources or data provided in the Pure Gas Industry report?
While the report offers comprehensive insights, it's advisable to review the specific contents or supplementary materials provided to ascertain if additional resources or data are available.
14. How can I stay updated on further developments or reports in the Pure Gas Industry?
To stay informed about further developments, trends, and reports in the Pure Gas Industry, consider subscribing to industry newsletters, following relevant companies and organizations, or regularly checking reputable industry news sources and publications.
Methodology
Step 1 - Identification of Relevant Samples Size from Population Database


Step 2 - Approaches for Defining Global Market Size (Value, Volume* & Price*)

Note*: In applicable scenarios
Step 3 - Data Sources
Primary Research
- Web Analytics
- Survey Reports
- Research Institute
- Latest Research Reports
- Opinion Leaders
Secondary Research
- Annual Reports
- White Paper
- Latest Press Release
- Industry Association
- Paid Database
- Investor Presentations

Step 4 - Data Triangulation
Involves using different sources of information in order to increase the validity of a study
These sources are likely to be stakeholders in a program - participants, other researchers, program staff, other community members, and so on.
Then we put all data in single framework & apply various statistical tools to find out the dynamic on the market.
During the analysis stage, feedback from the stakeholder groups would be compared to determine areas of agreement as well as areas of divergence