

Key Insights
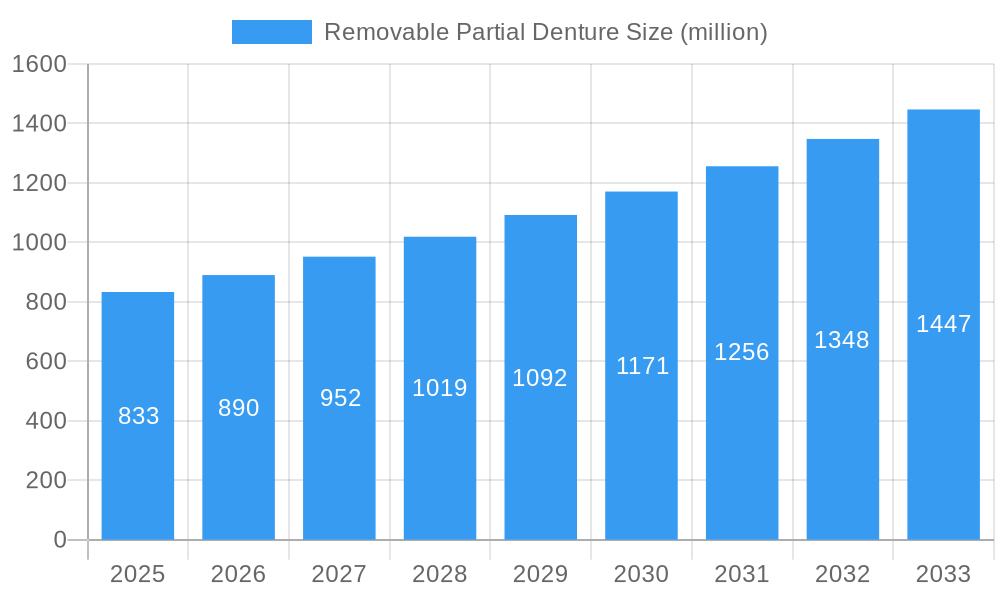
The global removable partial denture (RPD) market, valued at approximately $833 million in 2025, is projected to experience robust growth, driven by a rising geriatric population, increasing prevalence of periodontal diseases and tooth loss, and advancements in denture materials and design. The 6.7% CAGR indicates a steady expansion over the forecast period (2025-2033), signifying consistent demand for comfortable, functional, and aesthetically pleasing RPDs. This growth is further fueled by improved dental insurance coverage in several regions, making RPDs more accessible to a wider patient base. While challenges such as the high cost of treatment and the potential for discomfort or ill-fitting dentures remain, technological advancements are mitigating these concerns. Manufacturers are focusing on developing lightweight, biocompatible materials, and improved fabrication techniques that enhance both the longevity and comfort of RPDs. The market is segmented by material type (e.g., acrylic, metal), design (e.g., clasp, precision attachment), and region, with North America and Europe currently holding significant market shares. The competitive landscape is characterized by a mix of established global players like Dentsply Sirona and Ivoclar Vivadent, along with regional manufacturers and emerging innovative companies.
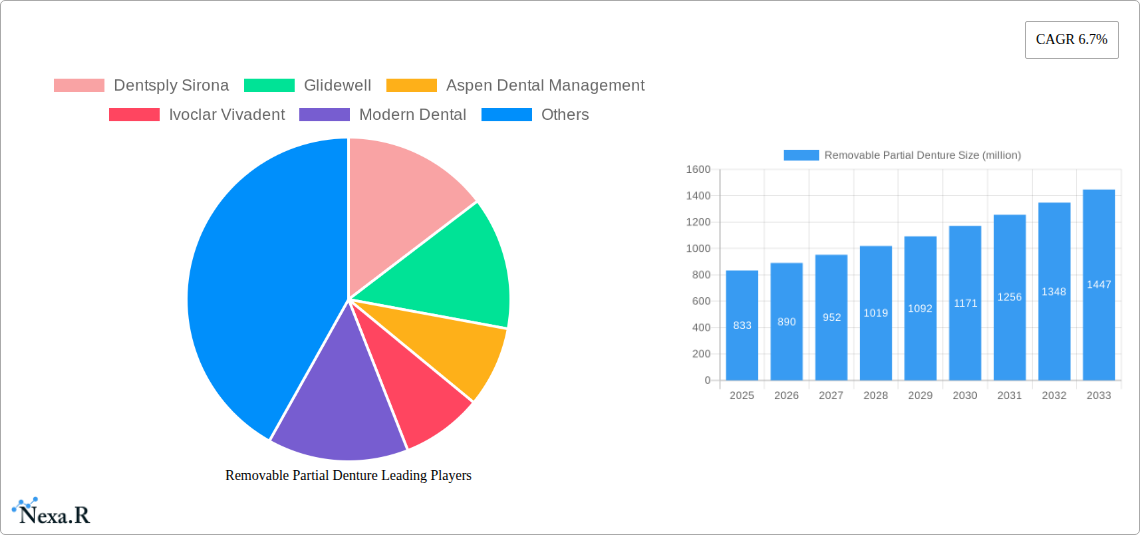
Removable Partial Denture Market Size (In Million)
The continued growth in the RPD market is expected to be influenced by factors such as increasing awareness of oral health, technological advancements leading to more customized and comfortable dentures, and the growing adoption of minimally invasive dental procedures. The increasing demand for aesthetically pleasing dentures is also a key driver, pushing manufacturers to incorporate improvements in aesthetics and biocompatibility in their products. Market expansion into emerging economies with growing middle classes will further contribute to market growth. Strategic partnerships, mergers and acquisitions, and the introduction of innovative products are key strategies adopted by major players to maintain a competitive edge. The forecast period will see a significant increase in the adoption of digital technologies in denture fabrication, streamlining the process and improving accuracy.
Removable Partial Denture Company Market Share
Removable Partial Denture Market Report: 2019-2033
This comprehensive report provides a detailed analysis of the global Removable Partial Denture market, offering invaluable insights for industry professionals, investors, and strategic decision-makers. The study covers the period 2019-2033, with a focus on the forecast period 2025-2033, utilizing 2025 as the base year and estimated year. The report leverages extensive primary and secondary research to deliver a holistic understanding of market dynamics, growth trends, competitive landscape, and future opportunities. The parent market is the dental prosthetics market, and the child market is removable dental appliances. The total market size in 2025 is estimated at $XX billion.
Removable Partial Denture Market Dynamics & Structure
This section analyzes the competitive landscape, technological advancements, regulatory influences, and market trends within the removable partial denture market. We delve into market concentration, identifying key players and their market share, and exploring the impact of mergers and acquisitions (M&A) activity. The analysis also examines the role of technological innovation, regulatory frameworks (including FDA regulations for relevant countries), and the presence of substitute products. End-user demographics, including age and income levels, influencing demand, are also explored.
- Market Concentration: Highly fragmented, with the top 5 players holding an estimated xx% market share in 2025.
- Technological Innovation: Focus on materials science (e.g., improved polymers, stronger alloys), CAD/CAM manufacturing, and digital dentistry integration.
- Regulatory Frameworks: Varying regulations across different regions impacting material approvals and manufacturing processes.
- Competitive Substitutes: Full dentures, dental implants, and fixed partial dentures represent competitive substitutes.
- M&A Activity: xx major M&A deals recorded between 2019 and 2024, primarily focused on expanding product portfolios and geographical reach. The average deal size was approximately $xx million.
- End-User Demographics: Significant demand driven by aging populations in developed countries and rising disposable incomes in emerging markets.
Removable Partial Denture Growth Trends & Insights
This section presents a comprehensive analysis of the Removable Partial Denture market's historical and projected growth trajectory, employing quantitative metrics to paint a clear picture of market evolution. The analysis explores factors such as market size fluctuations, adoption rates across different regions, and the influence of technological disruptions on market dynamics. We also examine evolving consumer behavior, including preferences for aesthetic appeal and improved functionality. The Compound Annual Growth Rate (CAGR) for the forecast period (2025-2033) is projected to be xx%. Market penetration is estimated at xx% in 2025, with potential for significant growth in underserved regions.
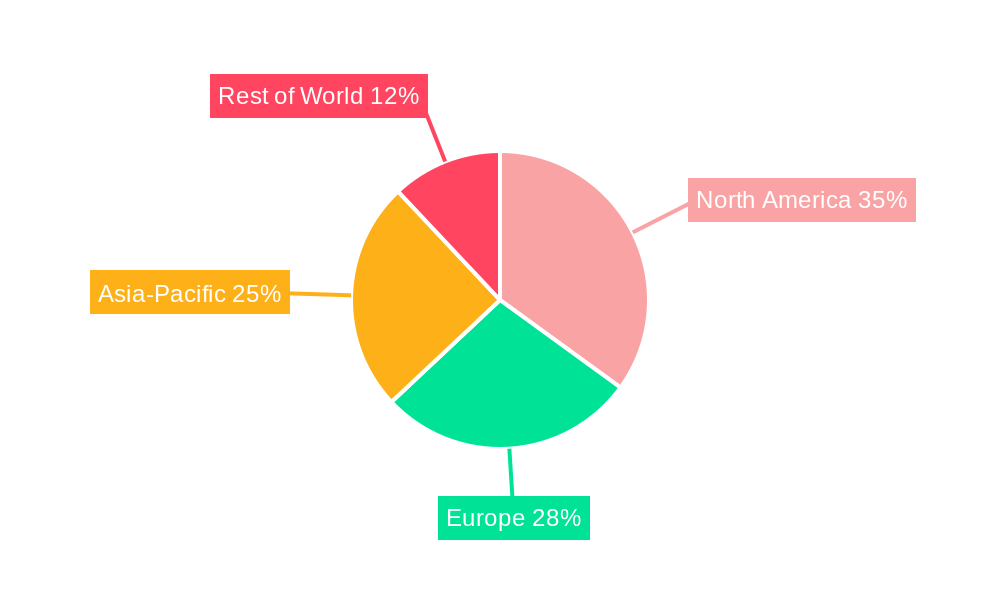
Dominant Regions, Countries, or Segments in Removable Partial Denture
This section identifies the leading geographical regions and market segments driving growth within the Removable Partial Denture market. We analyze the factors contributing to the dominance of these specific regions and segments, including economic strength, healthcare infrastructure, and government policies related to dental care. The report quantifies market share and growth potential for each key region and segment.
- North America: Remains the largest market due to high healthcare expenditure and a large aging population.
- Europe: Significant growth potential driven by increasing awareness of dental health and technological advancements.
- Asia-Pacific: Fastest-growing region, fueled by rising disposable incomes and increasing adoption of modern dental care.
- Key Drivers: Aging populations, rising dental insurance coverage, technological advancements, and increasing awareness of oral health.
Removable Partial Denture Product Landscape
The removable partial denture market encompasses a range of products designed to meet diverse clinical needs and patient preferences. Innovations in materials science and manufacturing techniques have led to the development of lighter, stronger, and more aesthetically pleasing dentures. These improvements enhance patient comfort, improve retention, and promote better oral hygiene. Specific advancements include the use of biocompatible polymers, improved clasp designs, and the integration of CAD/CAM technology in manufacturing.
Key Drivers, Barriers & Challenges in Removable Partial Denture
Key Drivers:
- Increasing prevalence of tooth loss due to aging and periodontal disease.
- Rising disposable incomes and improved healthcare access in emerging markets.
- Technological advancements leading to improved comfort, aesthetics, and functionality.
- Growing awareness of oral health and the importance of dental prosthetics.
Key Challenges & Restraints:
- High cost of treatment limiting accessibility for certain demographics.
- Potential complications such as gum irritation, bone resorption, and allergic reactions to materials.
- Competition from alternative treatments like dental implants and fixed partial dentures.
- Supply chain disruptions impacting the availability of raw materials and components. This resulted in a xx% increase in production costs in 2024.
Emerging Opportunities in Removable Partial Denture
Emerging opportunities lie in the development of personalized dentures using 3D printing technology, expansion into underserved markets through telehealth and mobile dental clinics, and the integration of advanced materials for enhanced durability and aesthetics. The rising demand for minimally invasive procedures and cosmetic dentistry also presents significant growth potential.
Growth Accelerators in the Removable Partial Denture Industry
Long-term growth will be fueled by continuous technological advancements, strategic collaborations between dental manufacturers and healthcare providers, and expansion into new geographical markets. Investments in research and development, focusing on innovative materials and manufacturing processes, will play a crucial role in driving market expansion.
Key Players Shaping the Removable Partial Denture Market
- Dentsply Sirona
- Glidewell
- Aspen Dental Management
- Ivoclar Vivadent
- Modern Dental
- Veden Dental Group
- VITA Zahnfabrik
- Kulzer
- SHofU
- Huge Dental
- Shenzhen Jiahong Dental Co.,Ltd.
- KTJ
- Kaisa Health Group Holdings Limited
- Jiahong Dental
Notable Milestones in Removable Partial Denture Sector
- 2020: Introduction of a new biocompatible polymer by Dentsply Sirona.
- 2022: Acquisition of a smaller competitor by Glidewell, expanding their market share.
- 2023: Launch of a new CAD/CAM system for denture fabrication by Ivoclar Vivadent.
- 2024: Increased regulatory scrutiny of certain materials used in denture manufacturing.
In-Depth Removable Partial Denture Market Outlook
The Removable Partial Denture market is poised for sustained growth over the forecast period, driven by technological innovation, increasing demand for affordable and effective dental solutions, and expanding access to dental care globally. Strategic partnerships, investment in R&D, and a focus on personalized solutions will be critical for companies to capitalize on future opportunities within this dynamic market. The market is expected to reach $xx billion by 2033.
Removable Partial Denture Segmentation
-
1. Application
- 1.1. Hospital
- 1.2. Clinic
- 1.3. Others
-
2. Type
- 2.1. Metal Removable Partial Denture
- 2.2. Plastic Removable Partial Denture
Removable Partial Denture Segmentation By Geography
-
1. North America
- 1.1. United States
- 1.2. Canada
- 1.3. Mexico
-
2. South America
- 2.1. Brazil
- 2.2. Argentina
- 2.3. Rest of South America
-
3. Europe
- 3.1. United Kingdom
- 3.2. Germany
- 3.3. France
- 3.4. Italy
- 3.5. Spain
- 3.6. Russia
- 3.7. Benelux
- 3.8. Nordics
- 3.9. Rest of Europe
-
4. Middle East & Africa
- 4.1. Turkey
- 4.2. Israel
- 4.3. GCC
- 4.4. North Africa
- 4.5. South Africa
- 4.6. Rest of Middle East & Africa
-
5. Asia Pacific
- 5.1. China
- 5.2. India
- 5.3. Japan
- 5.4. South Korea
- 5.5. ASEAN
- 5.6. Oceania
- 5.7. Rest of Asia Pacific
Removable Partial Denture Regional Market Share
Geographic Coverage of Removable Partial Denture
Removable Partial Denture REPORT HIGHLIGHTS
| Aspects | Details |
|---|---|
| Study Period | 2020-2034 |
| Base Year | 2025 |
| Estimated Year | 2026 |
| Forecast Period | 2026-2034 |
| Historical Period | 2020-2025 |
| Growth Rate | CAGR of 6.7% from 2020-2034 |
| Segmentation |
|
Table of Contents
- 1. Introduction
- 1.1. Research Scope
- 1.2. Market Segmentation
- 1.3. Research Methodology
- 1.4. Definitions and Assumptions
- 2. Executive Summary
- 2.1. Introduction
- 3. Market Dynamics
- 3.1. Introduction
- 3.2. Market Drivers
- 3.3. Market Restrains
- 3.4. Market Trends
- 4. Market Factor Analysis
- 4.1. Porters Five Forces
- 4.2. Supply/Value Chain
- 4.3. PESTEL analysis
- 4.4. Market Entropy
- 4.5. Patent/Trademark Analysis
- 5. Global Removable Partial Denture Analysis, Insights and Forecast, 2020-2032
- 5.1. Market Analysis, Insights and Forecast - by Application
- 5.1.1. Hospital
- 5.1.2. Clinic
- 5.1.3. Others
- 5.2. Market Analysis, Insights and Forecast - by Type
- 5.2.1. Metal Removable Partial Denture
- 5.2.2. Plastic Removable Partial Denture
- 5.3. Market Analysis, Insights and Forecast - by Region
- 5.3.1. North America
- 5.3.2. South America
- 5.3.3. Europe
- 5.3.4. Middle East & Africa
- 5.3.5. Asia Pacific
- 5.1. Market Analysis, Insights and Forecast - by Application
- 6. North America Removable Partial Denture Analysis, Insights and Forecast, 2020-2032
- 6.1. Market Analysis, Insights and Forecast - by Application
- 6.1.1. Hospital
- 6.1.2. Clinic
- 6.1.3. Others
- 6.2. Market Analysis, Insights and Forecast - by Type
- 6.2.1. Metal Removable Partial Denture
- 6.2.2. Plastic Removable Partial Denture
- 6.1. Market Analysis, Insights and Forecast - by Application
- 7. South America Removable Partial Denture Analysis, Insights and Forecast, 2020-2032
- 7.1. Market Analysis, Insights and Forecast - by Application
- 7.1.1. Hospital
- 7.1.2. Clinic
- 7.1.3. Others
- 7.2. Market Analysis, Insights and Forecast - by Type
- 7.2.1. Metal Removable Partial Denture
- 7.2.2. Plastic Removable Partial Denture
- 7.1. Market Analysis, Insights and Forecast - by Application
- 8. Europe Removable Partial Denture Analysis, Insights and Forecast, 2020-2032
- 8.1. Market Analysis, Insights and Forecast - by Application
- 8.1.1. Hospital
- 8.1.2. Clinic
- 8.1.3. Others
- 8.2. Market Analysis, Insights and Forecast - by Type
- 8.2.1. Metal Removable Partial Denture
- 8.2.2. Plastic Removable Partial Denture
- 8.1. Market Analysis, Insights and Forecast - by Application
- 9. Middle East & Africa Removable Partial Denture Analysis, Insights and Forecast, 2020-2032
- 9.1. Market Analysis, Insights and Forecast - by Application
- 9.1.1. Hospital
- 9.1.2. Clinic
- 9.1.3. Others
- 9.2. Market Analysis, Insights and Forecast - by Type
- 9.2.1. Metal Removable Partial Denture
- 9.2.2. Plastic Removable Partial Denture
- 9.1. Market Analysis, Insights and Forecast - by Application
- 10. Asia Pacific Removable Partial Denture Analysis, Insights and Forecast, 2020-2032
- 10.1. Market Analysis, Insights and Forecast - by Application
- 10.1.1. Hospital
- 10.1.2. Clinic
- 10.1.3. Others
- 10.2. Market Analysis, Insights and Forecast - by Type
- 10.2.1. Metal Removable Partial Denture
- 10.2.2. Plastic Removable Partial Denture
- 10.1. Market Analysis, Insights and Forecast - by Application
- 11. Competitive Analysis
- 11.1. Global Market Share Analysis 2025
- 11.2. Company Profiles
- 11.2.1 Dentsply Sirona
- 11.2.1.1. Overview
- 11.2.1.2. Products
- 11.2.1.3. SWOT Analysis
- 11.2.1.4. Recent Developments
- 11.2.1.5. Financials (Based on Availability)
- 11.2.2 Glidewell
- 11.2.2.1. Overview
- 11.2.2.2. Products
- 11.2.2.3. SWOT Analysis
- 11.2.2.4. Recent Developments
- 11.2.2.5. Financials (Based on Availability)
- 11.2.3 Aspen Dental Management
- 11.2.3.1. Overview
- 11.2.3.2. Products
- 11.2.3.3. SWOT Analysis
- 11.2.3.4. Recent Developments
- 11.2.3.5. Financials (Based on Availability)
- 11.2.4 Ivoclar Vivadent
- 11.2.4.1. Overview
- 11.2.4.2. Products
- 11.2.4.3. SWOT Analysis
- 11.2.4.4. Recent Developments
- 11.2.4.5. Financials (Based on Availability)
- 11.2.5 Modern Dental
- 11.2.5.1. Overview
- 11.2.5.2. Products
- 11.2.5.3. SWOT Analysis
- 11.2.5.4. Recent Developments
- 11.2.5.5. Financials (Based on Availability)
- 11.2.6 Veden Dental Group
- 11.2.6.1. Overview
- 11.2.6.2. Products
- 11.2.6.3. SWOT Analysis
- 11.2.6.4. Recent Developments
- 11.2.6.5. Financials (Based on Availability)
- 11.2.7 VITA Zahnfabrik
- 11.2.7.1. Overview
- 11.2.7.2. Products
- 11.2.7.3. SWOT Analysis
- 11.2.7.4. Recent Developments
- 11.2.7.5. Financials (Based on Availability)
- 11.2.8 Kulzer
- 11.2.8.1. Overview
- 11.2.8.2. Products
- 11.2.8.3. SWOT Analysis
- 11.2.8.4. Recent Developments
- 11.2.8.5. Financials (Based on Availability)
- 11.2.9 SHOFU
- 11.2.9.1. Overview
- 11.2.9.2. Products
- 11.2.9.3. SWOT Analysis
- 11.2.9.4. Recent Developments
- 11.2.9.5. Financials (Based on Availability)
- 11.2.10 Huge Dental
- 11.2.10.1. Overview
- 11.2.10.2. Products
- 11.2.10.3. SWOT Analysis
- 11.2.10.4. Recent Developments
- 11.2.10.5. Financials (Based on Availability)
- 11.2.11 Shenzhen Jiahong Dental Co.Ltd.
- 11.2.11.1. Overview
- 11.2.11.2. Products
- 11.2.11.3. SWOT Analysis
- 11.2.11.4. Recent Developments
- 11.2.11.5. Financials (Based on Availability)
- 11.2.12 KTJ
- 11.2.12.1. Overview
- 11.2.12.2. Products
- 11.2.12.3. SWOT Analysis
- 11.2.12.4. Recent Developments
- 11.2.12.5. Financials (Based on Availability)
- 11.2.13 Kaisa Health Group Holdings Limited
- 11.2.13.1. Overview
- 11.2.13.2. Products
- 11.2.13.3. SWOT Analysis
- 11.2.13.4. Recent Developments
- 11.2.13.5. Financials (Based on Availability)
- 11.2.14 Jiahong Dental
- 11.2.14.1. Overview
- 11.2.14.2. Products
- 11.2.14.3. SWOT Analysis
- 11.2.14.4. Recent Developments
- 11.2.14.5. Financials (Based on Availability)
- 11.2.1 Dentsply Sirona
List of Figures
- Figure 1: Global Removable Partial Denture Revenue Breakdown (million, %) by Region 2025 & 2033
- Figure 2: North America Removable Partial Denture Revenue (million), by Application 2025 & 2033
- Figure 3: North America Removable Partial Denture Revenue Share (%), by Application 2025 & 2033
- Figure 4: North America Removable Partial Denture Revenue (million), by Type 2025 & 2033
- Figure 5: North America Removable Partial Denture Revenue Share (%), by Type 2025 & 2033
- Figure 6: North America Removable Partial Denture Revenue (million), by Country 2025 & 2033
- Figure 7: North America Removable Partial Denture Revenue Share (%), by Country 2025 & 2033
- Figure 8: South America Removable Partial Denture Revenue (million), by Application 2025 & 2033
- Figure 9: South America Removable Partial Denture Revenue Share (%), by Application 2025 & 2033
- Figure 10: South America Removable Partial Denture Revenue (million), by Type 2025 & 2033
- Figure 11: South America Removable Partial Denture Revenue Share (%), by Type 2025 & 2033
- Figure 12: South America Removable Partial Denture Revenue (million), by Country 2025 & 2033
- Figure 13: South America Removable Partial Denture Revenue Share (%), by Country 2025 & 2033
- Figure 14: Europe Removable Partial Denture Revenue (million), by Application 2025 & 2033
- Figure 15: Europe Removable Partial Denture Revenue Share (%), by Application 2025 & 2033
- Figure 16: Europe Removable Partial Denture Revenue (million), by Type 2025 & 2033
- Figure 17: Europe Removable Partial Denture Revenue Share (%), by Type 2025 & 2033
- Figure 18: Europe Removable Partial Denture Revenue (million), by Country 2025 & 2033
- Figure 19: Europe Removable Partial Denture Revenue Share (%), by Country 2025 & 2033
- Figure 20: Middle East & Africa Removable Partial Denture Revenue (million), by Application 2025 & 2033
- Figure 21: Middle East & Africa Removable Partial Denture Revenue Share (%), by Application 2025 & 2033
- Figure 22: Middle East & Africa Removable Partial Denture Revenue (million), by Type 2025 & 2033
- Figure 23: Middle East & Africa Removable Partial Denture Revenue Share (%), by Type 2025 & 2033
- Figure 24: Middle East & Africa Removable Partial Denture Revenue (million), by Country 2025 & 2033
- Figure 25: Middle East & Africa Removable Partial Denture Revenue Share (%), by Country 2025 & 2033
- Figure 26: Asia Pacific Removable Partial Denture Revenue (million), by Application 2025 & 2033
- Figure 27: Asia Pacific Removable Partial Denture Revenue Share (%), by Application 2025 & 2033
- Figure 28: Asia Pacific Removable Partial Denture Revenue (million), by Type 2025 & 2033
- Figure 29: Asia Pacific Removable Partial Denture Revenue Share (%), by Type 2025 & 2033
- Figure 30: Asia Pacific Removable Partial Denture Revenue (million), by Country 2025 & 2033
- Figure 31: Asia Pacific Removable Partial Denture Revenue Share (%), by Country 2025 & 2033
List of Tables
- Table 1: Global Removable Partial Denture Revenue million Forecast, by Application 2020 & 2033
- Table 2: Global Removable Partial Denture Revenue million Forecast, by Type 2020 & 2033
- Table 3: Global Removable Partial Denture Revenue million Forecast, by Region 2020 & 2033
- Table 4: Global Removable Partial Denture Revenue million Forecast, by Application 2020 & 2033
- Table 5: Global Removable Partial Denture Revenue million Forecast, by Type 2020 & 2033
- Table 6: Global Removable Partial Denture Revenue million Forecast, by Country 2020 & 2033
- Table 7: United States Removable Partial Denture Revenue (million) Forecast, by Application 2020 & 2033
- Table 8: Canada Removable Partial Denture Revenue (million) Forecast, by Application 2020 & 2033
- Table 9: Mexico Removable Partial Denture Revenue (million) Forecast, by Application 2020 & 2033
- Table 10: Global Removable Partial Denture Revenue million Forecast, by Application 2020 & 2033
- Table 11: Global Removable Partial Denture Revenue million Forecast, by Type 2020 & 2033
- Table 12: Global Removable Partial Denture Revenue million Forecast, by Country 2020 & 2033
- Table 13: Brazil Removable Partial Denture Revenue (million) Forecast, by Application 2020 & 2033
- Table 14: Argentina Removable Partial Denture Revenue (million) Forecast, by Application 2020 & 2033
- Table 15: Rest of South America Removable Partial Denture Revenue (million) Forecast, by Application 2020 & 2033
- Table 16: Global Removable Partial Denture Revenue million Forecast, by Application 2020 & 2033
- Table 17: Global Removable Partial Denture Revenue million Forecast, by Type 2020 & 2033
- Table 18: Global Removable Partial Denture Revenue million Forecast, by Country 2020 & 2033
- Table 19: United Kingdom Removable Partial Denture Revenue (million) Forecast, by Application 2020 & 2033
- Table 20: Germany Removable Partial Denture Revenue (million) Forecast, by Application 2020 & 2033
- Table 21: France Removable Partial Denture Revenue (million) Forecast, by Application 2020 & 2033
- Table 22: Italy Removable Partial Denture Revenue (million) Forecast, by Application 2020 & 2033
- Table 23: Spain Removable Partial Denture Revenue (million) Forecast, by Application 2020 & 2033
- Table 24: Russia Removable Partial Denture Revenue (million) Forecast, by Application 2020 & 2033
- Table 25: Benelux Removable Partial Denture Revenue (million) Forecast, by Application 2020 & 2033
- Table 26: Nordics Removable Partial Denture Revenue (million) Forecast, by Application 2020 & 2033
- Table 27: Rest of Europe Removable Partial Denture Revenue (million) Forecast, by Application 2020 & 2033
- Table 28: Global Removable Partial Denture Revenue million Forecast, by Application 2020 & 2033
- Table 29: Global Removable Partial Denture Revenue million Forecast, by Type 2020 & 2033
- Table 30: Global Removable Partial Denture Revenue million Forecast, by Country 2020 & 2033
- Table 31: Turkey Removable Partial Denture Revenue (million) Forecast, by Application 2020 & 2033
- Table 32: Israel Removable Partial Denture Revenue (million) Forecast, by Application 2020 & 2033
- Table 33: GCC Removable Partial Denture Revenue (million) Forecast, by Application 2020 & 2033
- Table 34: North Africa Removable Partial Denture Revenue (million) Forecast, by Application 2020 & 2033
- Table 35: South Africa Removable Partial Denture Revenue (million) Forecast, by Application 2020 & 2033
- Table 36: Rest of Middle East & Africa Removable Partial Denture Revenue (million) Forecast, by Application 2020 & 2033
- Table 37: Global Removable Partial Denture Revenue million Forecast, by Application 2020 & 2033
- Table 38: Global Removable Partial Denture Revenue million Forecast, by Type 2020 & 2033
- Table 39: Global Removable Partial Denture Revenue million Forecast, by Country 2020 & 2033
- Table 40: China Removable Partial Denture Revenue (million) Forecast, by Application 2020 & 2033
- Table 41: India Removable Partial Denture Revenue (million) Forecast, by Application 2020 & 2033
- Table 42: Japan Removable Partial Denture Revenue (million) Forecast, by Application 2020 & 2033
- Table 43: South Korea Removable Partial Denture Revenue (million) Forecast, by Application 2020 & 2033
- Table 44: ASEAN Removable Partial Denture Revenue (million) Forecast, by Application 2020 & 2033
- Table 45: Oceania Removable Partial Denture Revenue (million) Forecast, by Application 2020 & 2033
- Table 46: Rest of Asia Pacific Removable Partial Denture Revenue (million) Forecast, by Application 2020 & 2033
Frequently Asked Questions
1. What is the projected Compound Annual Growth Rate (CAGR) of the Removable Partial Denture?
The projected CAGR is approximately 6.7%.
2. Which companies are prominent players in the Removable Partial Denture?
Key companies in the market include Dentsply Sirona, Glidewell, Aspen Dental Management, Ivoclar Vivadent, Modern Dental, Veden Dental Group, VITA Zahnfabrik, Kulzer, SHOFU, Huge Dental, Shenzhen Jiahong Dental Co.,Ltd., KTJ, Kaisa Health Group Holdings Limited, Jiahong Dental.
3. What are the main segments of the Removable Partial Denture?
The market segments include Application, Type.
4. Can you provide details about the market size?
The market size is estimated to be USD 833 million as of 2022.
5. What are some drivers contributing to market growth?
N/A
6. What are the notable trends driving market growth?
N/A
7. Are there any restraints impacting market growth?
N/A
8. Can you provide examples of recent developments in the market?
N/A
9. What pricing options are available for accessing the report?
Pricing options include single-user, multi-user, and enterprise licenses priced at USD 2900.00, USD 4350.00, and USD 5800.00 respectively.
10. Is the market size provided in terms of value or volume?
The market size is provided in terms of value, measured in million.
11. Are there any specific market keywords associated with the report?
Yes, the market keyword associated with the report is "Removable Partial Denture," which aids in identifying and referencing the specific market segment covered.
12. How do I determine which pricing option suits my needs best?
The pricing options vary based on user requirements and access needs. Individual users may opt for single-user licenses, while businesses requiring broader access may choose multi-user or enterprise licenses for cost-effective access to the report.
13. Are there any additional resources or data provided in the Removable Partial Denture report?
While the report offers comprehensive insights, it's advisable to review the specific contents or supplementary materials provided to ascertain if additional resources or data are available.
14. How can I stay updated on further developments or reports in the Removable Partial Denture?
To stay informed about further developments, trends, and reports in the Removable Partial Denture, consider subscribing to industry newsletters, following relevant companies and organizations, or regularly checking reputable industry news sources and publications.
Methodology
Step 1 - Identification of Relevant Samples Size from Population Database


Step 2 - Approaches for Defining Global Market Size (Value, Volume* & Price*)

Note*: In applicable scenarios
Step 3 - Data Sources
Primary Research
- Web Analytics
- Survey Reports
- Research Institute
- Latest Research Reports
- Opinion Leaders
Secondary Research
- Annual Reports
- White Paper
- Latest Press Release
- Industry Association
- Paid Database
- Investor Presentations

Step 4 - Data Triangulation
Involves using different sources of information in order to increase the validity of a study
These sources are likely to be stakeholders in a program - participants, other researchers, program staff, other community members, and so on.
Then we put all data in single framework & apply various statistical tools to find out the dynamic on the market.
During the analysis stage, feedback from the stakeholder groups would be compared to determine areas of agreement as well as areas of divergence