

Key Insights
The global rhamnolipids market is set for significant expansion, driven by increasing demand for sustainable and bio-based solutions. The market is projected to reach $7.52 billion by 2025, exhibiting a strong Compound Annual Growth Rate (CAGR) of 15.09%. This growth is primarily attributed to the escalating adoption of rhamnolipids as environmentally friendly surfactants across diverse sectors including cosmetics, agriculture, pharmaceuticals, and food processing. Mono-rhamnolipids and di-rhamnolipids are the key product segments, each offering unique properties for specific applications. North America and Europe currently lead the market due to advanced research and early adoption of green technologies. However, the Asia-Pacific region is expected to experience substantial growth, propelled by industrialization and a growing emphasis on eco-conscious practices. While production costs and limited regional awareness present short-term challenges, ongoing research and development efforts are poised to overcome these hurdles.
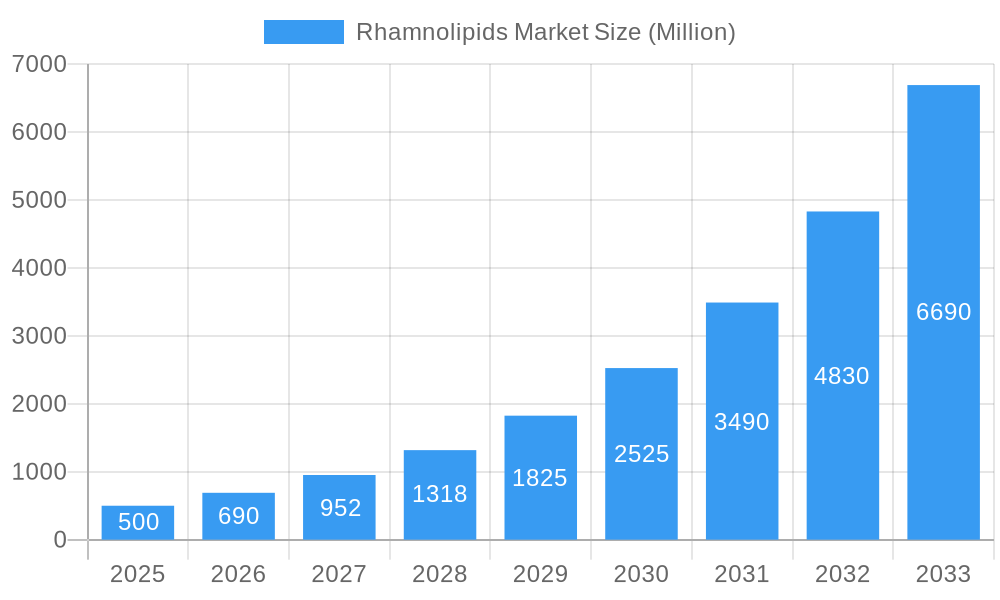
Rhamnolipids Market Market Size (In Billion)
The forecast period, 2025-2033, indicates sustained robust growth across all geographic regions. The Asia-Pacific market, in particular, shows immense potential due to economic development and stringent environmental regulations. Surfactants remain the dominant application segment, leveraging the emulsifying, wetting, and detergent properties of rhamnolipids. Advancements in fermentation and downstream processing technologies are expected to reduce production costs, improve product quality, and increase availability, thereby attracting new market entrants and expanding rhamnolipid applications into novel industries.
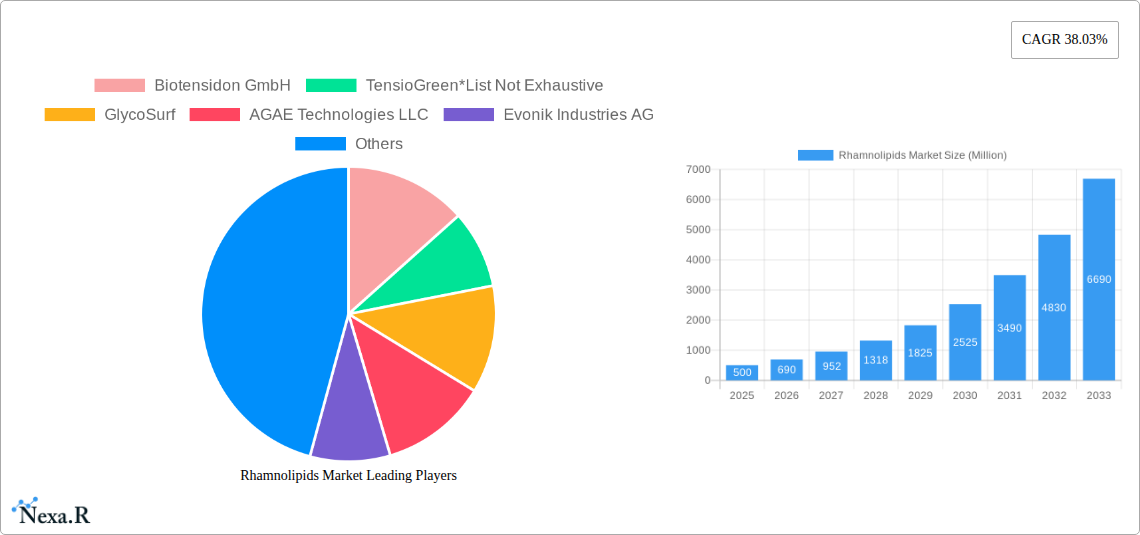
Rhamnolipids Market Company Market Share
Rhamnolipids Market: A Comprehensive Analysis (2019-2033)
This in-depth report provides a comprehensive analysis of the global Rhamnolipids market, encompassing market dynamics, growth trends, regional performance, key players, and future outlook. The study period covers 2019-2033, with 2025 as the base and estimated year. The report segments the market by type (Mono-Rhamnolipids, Di-Rhamnolipids) and application (Surfactants, Cosmetics, Agriculture, Food, Pharmaceutical, Other Applications), providing granular insights into each segment's growth trajectory. The parent market is the biosurfactant market and the child market is rhamnolipids. This report is invaluable for industry professionals, investors, and researchers seeking to understand and capitalize on opportunities within this rapidly evolving market. The market size is projected to reach xx Million by 2033.
Rhamnolipids Market Dynamics & Structure
This section analyzes the competitive landscape, technological advancements, regulatory environment, and market trends influencing the rhamnolipids market. The market is characterized by a moderately concentrated structure, with key players such as Evonik Industries AG and AGAE Technologies LLC holding significant market share. However, the market is also witnessing increased participation from smaller players and startups.
- Market Concentration: The top 5 players hold approximately xx% of the market share in 2025.
- Technological Innovation: Ongoing R&D efforts focus on improving rhamnolipid production efficiency and expanding applications. Innovation barriers include high production costs and scalability challenges.
- Regulatory Frameworks: Government regulations regarding bio-based products and sustainability are driving market growth. However, variations in regulations across different geographies pose challenges for market expansion.
- Competitive Product Substitutes: Chemical surfactants remain a significant competitive threat, but growing environmental concerns are creating opportunities for rhamnolipids.
- End-User Demographics: The major end-user segments include cosmetics, agriculture, and pharmaceuticals, with demand driven by the growing preference for sustainable and biodegradable products.
- M&A Trends: The past five years witnessed xx M&A deals in the rhamnolipids market, predominantly focused on expanding production capacity and market reach.
Rhamnolipids Market Growth Trends & Insights
The global rhamnolipids market is experiencing significant growth, driven by increasing demand from various applications and rising awareness about sustainable alternatives to traditional chemical surfactants. The market size is estimated to be xx Million in 2025 and is projected to grow at a CAGR of xx% during the forecast period (2025-2033). This growth is fueled by factors such as increasing consumer preference for eco-friendly products and stringent environmental regulations. Technological advancements in rhamnolipid production are also contributing to the market expansion. The adoption rate of rhamnolipids is increasing rapidly in the cosmetic and pharmaceutical industries. Consumer behavior shifts toward sustainable and ethical products are creating further opportunities for market expansion.
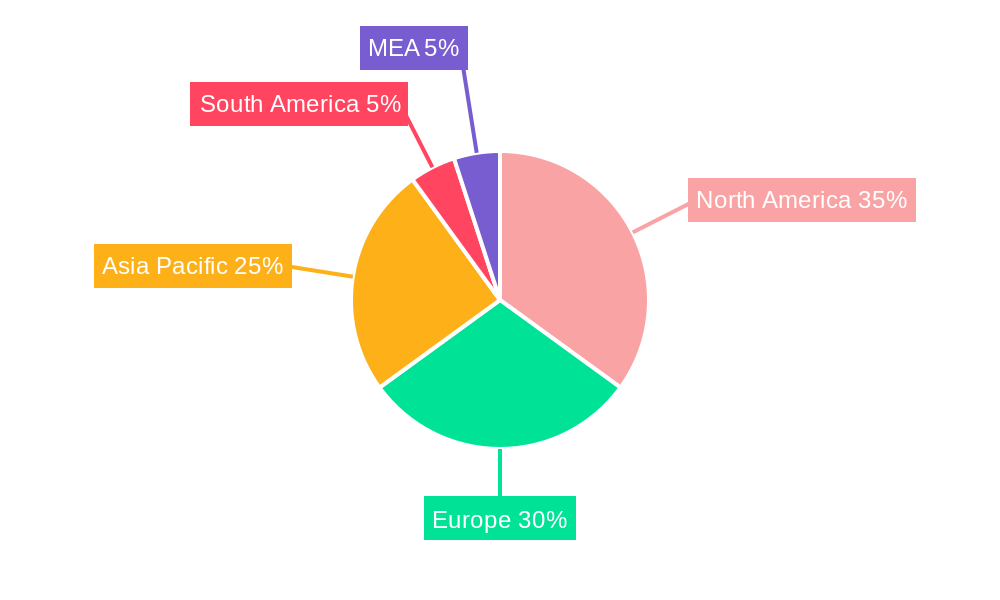
Dominant Regions, Countries, or Segments in Rhamnolipids Market
North America is currently the leading region in the rhamnolipids market, driven by strong demand from the cosmetics and pharmaceutical industries. Europe is also witnessing significant growth, with initiatives focused on promoting sustainable and bio-based products. Within the application segments, the surfactants segment holds the largest market share, followed by the cosmetics and agricultural sectors.
- Key Drivers:
- Growing demand for eco-friendly surfactants
- Stringent environmental regulations
- Increasing consumer awareness of sustainable products
- Technological advancements in rhamnolipid production
- Market Share & Growth Potential: North America holds an estimated xx% market share in 2025, while Europe accounts for approximately xx%. The surfactants application segment is expected to maintain its dominance, with a projected CAGR of xx% during the forecast period.
Rhamnolipids Market Product Landscape
Rhamnolipids are classified into mono-rhamnolipids and di-rhamnolipids, each exhibiting unique properties suitable for specific applications. Recent product innovations focus on improving their efficacy, stability, and cost-effectiveness. Technological advancements include optimized fermentation processes and downstream purification techniques to enhance yield and reduce production costs. The unique selling proposition of rhamnolipids lies in their biodegradability, low toxicity, and high surface activity, making them ideal for sustainable applications.
Key Drivers, Barriers & Challenges in Rhamnolipids Market
Key Drivers:
- Growing demand for sustainable and eco-friendly products in various industries
- Stringent environmental regulations promoting bio-based alternatives
- Increasing consumer awareness of the benefits of rhamnolipids
- Technological advancements leading to cost-effective production
Challenges and Restraints:
- High production costs compared to conventional surfactants
- Scalability challenges in the production process
- Limited availability of high-quality raw materials
- Fluctuations in raw material prices impacting profitability
Emerging Opportunities in Rhamnolipids Market
Emerging opportunities exist in the unexplored applications of rhamnolipids such as in bioremediation, enhanced oil recovery, and drug delivery systems. Innovative applications are constantly emerging, further fueling market growth. Evolving consumer preferences for natural and sustainable products are creating new avenues for market expansion. Untapped markets in developing countries represent significant growth potential.
Growth Accelerators in the Rhamnolipids Market Industry
Technological breakthroughs in fermentation and purification processes are significantly lowering production costs, making rhamnolipids more competitive with conventional surfactants. Strategic partnerships between rhamnolipid producers and end-users are accelerating market adoption. Expansion into new geographic markets and applications is further driving market growth.
Key Players Shaping the Rhamnolipids Market Market
- Biotensidon GmbH
- TensioGreen
- GlycoSurf
- AGAE Technologies LLC
- Evonik Industries AG
- Stepan Company
- Jeneil Biotech
- DEGUAN Biosurfactant Supplier
Notable Milestones in Rhamnolipids Market Sector
- September 2022: AGAE Technologies, LLC announced a significant breakthrough in rhamnolipid production, achieving a 200% yield increase and a 67% reduction in production costs.
- June 2022: Evonik Industries AG invested a substantial sum in a new production plant for rhamnolipids, signaling significant market expansion plans.
In-Depth Rhamnolipids Market Market Outlook
The future of the rhamnolipids market looks promising, driven by strong growth across various applications. Strategic partnerships, technological innovation, and increasing consumer awareness of sustainable alternatives will continue to fuel market expansion. The market is poised for substantial growth, presenting attractive opportunities for both established players and new entrants.
Rhamnolipids Market Segmentation
-
1. Type
- 1.1. Mono-Rhamnolipids
- 1.2. Di-Rhamnolipids
-
2. Application
- 2.1. Surfactants
- 2.2. Cosmetics
- 2.3. Agriculture
- 2.4. Food
- 2.5. Pharmaceutical
- 2.6. Other Applications
Rhamnolipids Market Segmentation By Geography
- 1. Asia Pacific
- 2. North America
- 3. Europe
- 4. South America
- 5. Middle East and Africa
Rhamnolipids Market Regional Market Share
Geographic Coverage of Rhamnolipids Market
Rhamnolipids Market REPORT HIGHLIGHTS
| Aspects | Details |
|---|---|
| Study Period | 2020-2034 |
| Base Year | 2025 |
| Estimated Year | 2026 |
| Forecast Period | 2026-2034 |
| Historical Period | 2020-2025 |
| Growth Rate | CAGR of 15.09% from 2020-2034 |
| Segmentation |
|
Table of Contents
- 1. Introduction
- 1.1. Research Scope
- 1.2. Market Segmentation
- 1.3. Research Objective
- 1.4. Definitions and Assumptions
- 2. Executive Summary
- 2.1. Market Snapshot
- 3. Market Dynamics
- 3.1. Market Drivers
- 3.2. Market Restrains
- 3.3. Market Trends
- 3.4. Market Opportunities
- 4. Market Factor Analysis
- 4.1. Porters Five Forces
- 4.1.1. Bargaining Power of Suppliers
- 4.1.2. Bargaining Power of Buyers
- 4.1.3. Threat of New Entrants
- 4.1.4. Threat of Substitutes
- 4.1.5. Competitive Rivalry
- 4.2. PESTEL analysis
- 4.3. BCG Analysis
- 4.3.1. Stars (High Growth, High Market Share)
- 4.3.2. Cash Cows (Low Growth, High Market Share)
- 4.3.3. Question Mark (High Growth, Low Market Share)
- 4.3.4. Dogs (Low Growth, Low Market Share)
- 4.4. Ansoff Matrix Analysis
- 4.5. Supply Chain Analysis
- 4.6. Regulatory Landscape
- 4.7. Current Market Potential and Opportunity Assessment (TAM–SAM–SOM Framework)
- 4.8. NRP Analyst Note
- 4.1. Porters Five Forces
- 5. Market Analysis, Insights and Forecast 2021-2033
- 5.1. Market Analysis, Insights and Forecast - by Type
- 5.1.1. Mono-Rhamnolipids
- 5.1.2. Di-Rhamnolipids
- 5.2. Market Analysis, Insights and Forecast - by Application
- 5.2.1. Surfactants
- 5.2.2. Cosmetics
- 5.2.3. Agriculture
- 5.2.4. Food
- 5.2.5. Pharmaceutical
- 5.2.6. Other Applications
- 5.3. Market Analysis, Insights and Forecast - by Region
- 5.3.1. Asia Pacific
- 5.3.2. North America
- 5.3.3. Europe
- 5.3.4. South America
- 5.3.5. Middle East and Africa
- 5.1. Market Analysis, Insights and Forecast - by Type
- 6. Global Rhamnolipids Market Analysis, Insights and Forecast, 2021-2033
- 6.1. Market Analysis, Insights and Forecast - by Type
- 6.1.1. Mono-Rhamnolipids
- 6.1.2. Di-Rhamnolipids
- 6.2. Market Analysis, Insights and Forecast - by Application
- 6.2.1. Surfactants
- 6.2.2. Cosmetics
- 6.2.3. Agriculture
- 6.2.4. Food
- 6.2.5. Pharmaceutical
- 6.2.6. Other Applications
- 6.1. Market Analysis, Insights and Forecast - by Type
- 7. Asia Pacific Rhamnolipids Market Analysis, Insights and Forecast, 2020-2032
- 7.1. Market Analysis, Insights and Forecast - by Type
- 7.1.1. Mono-Rhamnolipids
- 7.1.2. Di-Rhamnolipids
- 7.2. Market Analysis, Insights and Forecast - by Application
- 7.2.1. Surfactants
- 7.2.2. Cosmetics
- 7.2.3. Agriculture
- 7.2.4. Food
- 7.2.5. Pharmaceutical
- 7.2.6. Other Applications
- 7.1. Market Analysis, Insights and Forecast - by Type
- 8. North America Rhamnolipids Market Analysis, Insights and Forecast, 2020-2032
- 8.1. Market Analysis, Insights and Forecast - by Type
- 8.1.1. Mono-Rhamnolipids
- 8.1.2. Di-Rhamnolipids
- 8.2. Market Analysis, Insights and Forecast - by Application
- 8.2.1. Surfactants
- 8.2.2. Cosmetics
- 8.2.3. Agriculture
- 8.2.4. Food
- 8.2.5. Pharmaceutical
- 8.2.6. Other Applications
- 8.1. Market Analysis, Insights and Forecast - by Type
- 9. Europe Rhamnolipids Market Analysis, Insights and Forecast, 2020-2032
- 9.1. Market Analysis, Insights and Forecast - by Type
- 9.1.1. Mono-Rhamnolipids
- 9.1.2. Di-Rhamnolipids
- 9.2. Market Analysis, Insights and Forecast - by Application
- 9.2.1. Surfactants
- 9.2.2. Cosmetics
- 9.2.3. Agriculture
- 9.2.4. Food
- 9.2.5. Pharmaceutical
- 9.2.6. Other Applications
- 9.1. Market Analysis, Insights and Forecast - by Type
- 10. South America Rhamnolipids Market Analysis, Insights and Forecast, 2020-2032
- 10.1. Market Analysis, Insights and Forecast - by Type
- 10.1.1. Mono-Rhamnolipids
- 10.1.2. Di-Rhamnolipids
- 10.2. Market Analysis, Insights and Forecast - by Application
- 10.2.1. Surfactants
- 10.2.2. Cosmetics
- 10.2.3. Agriculture
- 10.2.4. Food
- 10.2.5. Pharmaceutical
- 10.2.6. Other Applications
- 10.1. Market Analysis, Insights and Forecast - by Type
- 11. Middle East and Africa Rhamnolipids Market Analysis, Insights and Forecast, 2020-2032
- 11.1. Market Analysis, Insights and Forecast - by Type
- 11.1.1. Mono-Rhamnolipids
- 11.1.2. Di-Rhamnolipids
- 11.2. Market Analysis, Insights and Forecast - by Application
- 11.2.1. Surfactants
- 11.2.2. Cosmetics
- 11.2.3. Agriculture
- 11.2.4. Food
- 11.2.5. Pharmaceutical
- 11.2.6. Other Applications
- 11.1. Market Analysis, Insights and Forecast - by Type
- 12. Competitive Analysis
- 12.1. Company Profiles
- 12.1.1 Biotensidon GmbH
- 12.1.1.1. Company Overview
- 12.1.1.2. Products
- 12.1.1.3. Company Financials
- 12.1.1.4. SWOT Analysis
- 12.1.2 TensioGreen*List Not Exhaustive
- 12.1.2.1. Company Overview
- 12.1.2.2. Products
- 12.1.2.3. Company Financials
- 12.1.2.4. SWOT Analysis
- 12.1.3 GlycoSurf
- 12.1.3.1. Company Overview
- 12.1.3.2. Products
- 12.1.3.3. Company Financials
- 12.1.3.4. SWOT Analysis
- 12.1.4 AGAE Technologies LLC
- 12.1.4.1. Company Overview
- 12.1.4.2. Products
- 12.1.4.3. Company Financials
- 12.1.4.4. SWOT Analysis
- 12.1.5 Evonik Industries AG
- 12.1.5.1. Company Overview
- 12.1.5.2. Products
- 12.1.5.3. Company Financials
- 12.1.5.4. SWOT Analysis
- 12.1.6 Stepan Company
- 12.1.6.1. Company Overview
- 12.1.6.2. Products
- 12.1.6.3. Company Financials
- 12.1.6.4. SWOT Analysis
- 12.1.7 Jeneil Biotech
- 12.1.7.1. Company Overview
- 12.1.7.2. Products
- 12.1.7.3. Company Financials
- 12.1.7.4. SWOT Analysis
- 12.1.8 DEGUAN Biosurfactant Supplier
- 12.1.8.1. Company Overview
- 12.1.8.2. Products
- 12.1.8.3. Company Financials
- 12.1.8.4. SWOT Analysis
- 12.1.1 Biotensidon GmbH
- 12.2. Market Entropy
- 12.2.1 Company's Key Areas Served
- 12.2.2 Recent Developments
- 12.3. Company Market Share Analysis 2025
- 12.3.1 Top 5 Companies Market Share Analysis
- 12.3.2 Top 3 Companies Market Share Analysis
- 12.4. List of Potential Customers
- 13. Research Methodology
List of Figures
- Figure 1: Global Rhamnolipids Market Revenue Breakdown (billion, %) by Region 2025 & 2033
- Figure 2: Global Rhamnolipids Market Volume Breakdown (Million, %) by Region 2025 & 2033
- Figure 3: Asia Pacific Rhamnolipids Market Revenue (billion), by Type 2025 & 2033
- Figure 4: Asia Pacific Rhamnolipids Market Volume (Million), by Type 2025 & 2033
- Figure 5: Asia Pacific Rhamnolipids Market Revenue Share (%), by Type 2025 & 2033
- Figure 6: Asia Pacific Rhamnolipids Market Volume Share (%), by Type 2025 & 2033
- Figure 7: Asia Pacific Rhamnolipids Market Revenue (billion), by Application 2025 & 2033
- Figure 8: Asia Pacific Rhamnolipids Market Volume (Million), by Application 2025 & 2033
- Figure 9: Asia Pacific Rhamnolipids Market Revenue Share (%), by Application 2025 & 2033
- Figure 10: Asia Pacific Rhamnolipids Market Volume Share (%), by Application 2025 & 2033
- Figure 11: Asia Pacific Rhamnolipids Market Revenue (billion), by Country 2025 & 2033
- Figure 12: Asia Pacific Rhamnolipids Market Volume (Million), by Country 2025 & 2033
- Figure 13: Asia Pacific Rhamnolipids Market Revenue Share (%), by Country 2025 & 2033
- Figure 14: Asia Pacific Rhamnolipids Market Volume Share (%), by Country 2025 & 2033
- Figure 15: North America Rhamnolipids Market Revenue (billion), by Type 2025 & 2033
- Figure 16: North America Rhamnolipids Market Volume (Million), by Type 2025 & 2033
- Figure 17: North America Rhamnolipids Market Revenue Share (%), by Type 2025 & 2033
- Figure 18: North America Rhamnolipids Market Volume Share (%), by Type 2025 & 2033
- Figure 19: North America Rhamnolipids Market Revenue (billion), by Application 2025 & 2033
- Figure 20: North America Rhamnolipids Market Volume (Million), by Application 2025 & 2033
- Figure 21: North America Rhamnolipids Market Revenue Share (%), by Application 2025 & 2033
- Figure 22: North America Rhamnolipids Market Volume Share (%), by Application 2025 & 2033
- Figure 23: North America Rhamnolipids Market Revenue (billion), by Country 2025 & 2033
- Figure 24: North America Rhamnolipids Market Volume (Million), by Country 2025 & 2033
- Figure 25: North America Rhamnolipids Market Revenue Share (%), by Country 2025 & 2033
- Figure 26: North America Rhamnolipids Market Volume Share (%), by Country 2025 & 2033
- Figure 27: Europe Rhamnolipids Market Revenue (billion), by Type 2025 & 2033
- Figure 28: Europe Rhamnolipids Market Volume (Million), by Type 2025 & 2033
- Figure 29: Europe Rhamnolipids Market Revenue Share (%), by Type 2025 & 2033
- Figure 30: Europe Rhamnolipids Market Volume Share (%), by Type 2025 & 2033
- Figure 31: Europe Rhamnolipids Market Revenue (billion), by Application 2025 & 2033
- Figure 32: Europe Rhamnolipids Market Volume (Million), by Application 2025 & 2033
- Figure 33: Europe Rhamnolipids Market Revenue Share (%), by Application 2025 & 2033
- Figure 34: Europe Rhamnolipids Market Volume Share (%), by Application 2025 & 2033
- Figure 35: Europe Rhamnolipids Market Revenue (billion), by Country 2025 & 2033
- Figure 36: Europe Rhamnolipids Market Volume (Million), by Country 2025 & 2033
- Figure 37: Europe Rhamnolipids Market Revenue Share (%), by Country 2025 & 2033
- Figure 38: Europe Rhamnolipids Market Volume Share (%), by Country 2025 & 2033
- Figure 39: South America Rhamnolipids Market Revenue (billion), by Type 2025 & 2033
- Figure 40: South America Rhamnolipids Market Volume (Million), by Type 2025 & 2033
- Figure 41: South America Rhamnolipids Market Revenue Share (%), by Type 2025 & 2033
- Figure 42: South America Rhamnolipids Market Volume Share (%), by Type 2025 & 2033
- Figure 43: South America Rhamnolipids Market Revenue (billion), by Application 2025 & 2033
- Figure 44: South America Rhamnolipids Market Volume (Million), by Application 2025 & 2033
- Figure 45: South America Rhamnolipids Market Revenue Share (%), by Application 2025 & 2033
- Figure 46: South America Rhamnolipids Market Volume Share (%), by Application 2025 & 2033
- Figure 47: South America Rhamnolipids Market Revenue (billion), by Country 2025 & 2033
- Figure 48: South America Rhamnolipids Market Volume (Million), by Country 2025 & 2033
- Figure 49: South America Rhamnolipids Market Revenue Share (%), by Country 2025 & 2033
- Figure 50: South America Rhamnolipids Market Volume Share (%), by Country 2025 & 2033
- Figure 51: Middle East and Africa Rhamnolipids Market Revenue (billion), by Type 2025 & 2033
- Figure 52: Middle East and Africa Rhamnolipids Market Volume (Million), by Type 2025 & 2033
- Figure 53: Middle East and Africa Rhamnolipids Market Revenue Share (%), by Type 2025 & 2033
- Figure 54: Middle East and Africa Rhamnolipids Market Volume Share (%), by Type 2025 & 2033
- Figure 55: Middle East and Africa Rhamnolipids Market Revenue (billion), by Application 2025 & 2033
- Figure 56: Middle East and Africa Rhamnolipids Market Volume (Million), by Application 2025 & 2033
- Figure 57: Middle East and Africa Rhamnolipids Market Revenue Share (%), by Application 2025 & 2033
- Figure 58: Middle East and Africa Rhamnolipids Market Volume Share (%), by Application 2025 & 2033
- Figure 59: Middle East and Africa Rhamnolipids Market Revenue (billion), by Country 2025 & 2033
- Figure 60: Middle East and Africa Rhamnolipids Market Volume (Million), by Country 2025 & 2033
- Figure 61: Middle East and Africa Rhamnolipids Market Revenue Share (%), by Country 2025 & 2033
- Figure 62: Middle East and Africa Rhamnolipids Market Volume Share (%), by Country 2025 & 2033
List of Tables
- Table 1: Global Rhamnolipids Market Revenue billion Forecast, by Type 2020 & 2033
- Table 2: Global Rhamnolipids Market Volume Million Forecast, by Type 2020 & 2033
- Table 3: Global Rhamnolipids Market Revenue billion Forecast, by Application 2020 & 2033
- Table 4: Global Rhamnolipids Market Volume Million Forecast, by Application 2020 & 2033
- Table 5: Global Rhamnolipids Market Revenue billion Forecast, by Region 2020 & 2033
- Table 6: Global Rhamnolipids Market Volume Million Forecast, by Region 2020 & 2033
- Table 7: Global Rhamnolipids Market Revenue billion Forecast, by Type 2020 & 2033
- Table 8: Global Rhamnolipids Market Volume Million Forecast, by Type 2020 & 2033
- Table 9: Global Rhamnolipids Market Revenue billion Forecast, by Application 2020 & 2033
- Table 10: Global Rhamnolipids Market Volume Million Forecast, by Application 2020 & 2033
- Table 11: Global Rhamnolipids Market Revenue billion Forecast, by Country 2020 & 2033
- Table 12: Global Rhamnolipids Market Volume Million Forecast, by Country 2020 & 2033
- Table 13: Global Rhamnolipids Market Revenue billion Forecast, by Type 2020 & 2033
- Table 14: Global Rhamnolipids Market Volume Million Forecast, by Type 2020 & 2033
- Table 15: Global Rhamnolipids Market Revenue billion Forecast, by Application 2020 & 2033
- Table 16: Global Rhamnolipids Market Volume Million Forecast, by Application 2020 & 2033
- Table 17: Global Rhamnolipids Market Revenue billion Forecast, by Country 2020 & 2033
- Table 18: Global Rhamnolipids Market Volume Million Forecast, by Country 2020 & 2033
- Table 19: Global Rhamnolipids Market Revenue billion Forecast, by Type 2020 & 2033
- Table 20: Global Rhamnolipids Market Volume Million Forecast, by Type 2020 & 2033
- Table 21: Global Rhamnolipids Market Revenue billion Forecast, by Application 2020 & 2033
- Table 22: Global Rhamnolipids Market Volume Million Forecast, by Application 2020 & 2033
- Table 23: Global Rhamnolipids Market Revenue billion Forecast, by Country 2020 & 2033
- Table 24: Global Rhamnolipids Market Volume Million Forecast, by Country 2020 & 2033
- Table 25: Global Rhamnolipids Market Revenue billion Forecast, by Type 2020 & 2033
- Table 26: Global Rhamnolipids Market Volume Million Forecast, by Type 2020 & 2033
- Table 27: Global Rhamnolipids Market Revenue billion Forecast, by Application 2020 & 2033
- Table 28: Global Rhamnolipids Market Volume Million Forecast, by Application 2020 & 2033
- Table 29: Global Rhamnolipids Market Revenue billion Forecast, by Country 2020 & 2033
- Table 30: Global Rhamnolipids Market Volume Million Forecast, by Country 2020 & 2033
- Table 31: Global Rhamnolipids Market Revenue billion Forecast, by Type 2020 & 2033
- Table 32: Global Rhamnolipids Market Volume Million Forecast, by Type 2020 & 2033
- Table 33: Global Rhamnolipids Market Revenue billion Forecast, by Application 2020 & 2033
- Table 34: Global Rhamnolipids Market Volume Million Forecast, by Application 2020 & 2033
- Table 35: Global Rhamnolipids Market Revenue billion Forecast, by Country 2020 & 2033
- Table 36: Global Rhamnolipids Market Volume Million Forecast, by Country 2020 & 2033
Frequently Asked Questions
1. What is the projected Compound Annual Growth Rate (CAGR) of the Rhamnolipids Market?
The projected CAGR is approximately 15.09%.
2. Which companies are prominent players in the Rhamnolipids Market?
Key companies in the market include Biotensidon GmbH, TensioGreen*List Not Exhaustive, GlycoSurf, AGAE Technologies LLC, Evonik Industries AG, Stepan Company, Jeneil Biotech, DEGUAN Biosurfactant Supplier.
3. What are the main segments of the Rhamnolipids Market?
The market segments include Type, Application.
4. Can you provide details about the market size?
The market size is estimated to be USD 7.52 billion as of 2022.
5. What are some drivers contributing to market growth?
Emergence of Eco-friendly Surfactant; Increasing Demand For Personal Care Products.
6. What are the notable trends driving market growth?
Growing Demand of Rhamnolipids from Surfactants.
7. Are there any restraints impacting market growth?
Limitation in the Production of Rhamnolipids on an Industrial Scale.
8. Can you provide examples of recent developments in the market?
September 2022: AGAE Technologies, LLC announced the discovery of employing certain strains and mediums under optimized fermentation conditions to obtain record-high rhamnolipid yields at the lowest possible cost. When compared to traditionally optimized fermentation settings, the fermentation methods enhanced yields by approximately 200% while lowering production costs to about one-third of the conventionally optimized conditions.
9. What pricing options are available for accessing the report?
Pricing options include single-user, multi-user, and enterprise licenses priced at USD 4750, USD 5250, and USD 8750 respectively.
10. Is the market size provided in terms of value or volume?
The market size is provided in terms of value, measured in billion and volume, measured in Million.
11. Are there any specific market keywords associated with the report?
Yes, the market keyword associated with the report is "Rhamnolipids Market," which aids in identifying and referencing the specific market segment covered.
12. How do I determine which pricing option suits my needs best?
The pricing options vary based on user requirements and access needs. Individual users may opt for single-user licenses, while businesses requiring broader access may choose multi-user or enterprise licenses for cost-effective access to the report.
13. Are there any additional resources or data provided in the Rhamnolipids Market report?
While the report offers comprehensive insights, it's advisable to review the specific contents or supplementary materials provided to ascertain if additional resources or data are available.
14. How can I stay updated on further developments or reports in the Rhamnolipids Market?
To stay informed about further developments, trends, and reports in the Rhamnolipids Market, consider subscribing to industry newsletters, following relevant companies and organizations, or regularly checking reputable industry news sources and publications.
Methodology
Step 1 - Identification of Relevant Samples Size from Population Database


Step 2 - Approaches for Defining Global Market Size (Value, Volume* & Price*)

Note*: In applicable scenarios
Step 3 - Data Sources
Primary Research
- Web Analytics
- Survey Reports
- Research Institute
- Latest Research Reports
- Opinion Leaders
Secondary Research
- Annual Reports
- White Paper
- Latest Press Release
- Industry Association
- Paid Database
- Investor Presentations

Step 4 - Data Triangulation
Involves using different sources of information in order to increase the validity of a study
These sources are likely to be stakeholders in a program - participants, other researchers, program staff, other community members, and so on.
Then we put all data in single framework & apply various statistical tools to find out the dynamic on the market.
During the analysis stage, feedback from the stakeholder groups would be compared to determine areas of agreement as well as areas of divergence