

Key Insights
The global Rubber Process Oil market is projected for steady expansion, expected to reach approximately 3.73 million by 2025, with a Compound Annual Growth Rate (CAGR) of 2.93%. This growth is significantly driven by sustained demand for tires and automotive components, crucial sectors for the rubber industry. The expanding automotive sector in emerging economies and the essential role of rubber in vehicle manufacturing reinforce this market's resilience. Additionally, increasing applications in footwear and diverse consumer goods contribute to the demand for specialized rubber process oils, underscoring their versatility across various industrial sectors.
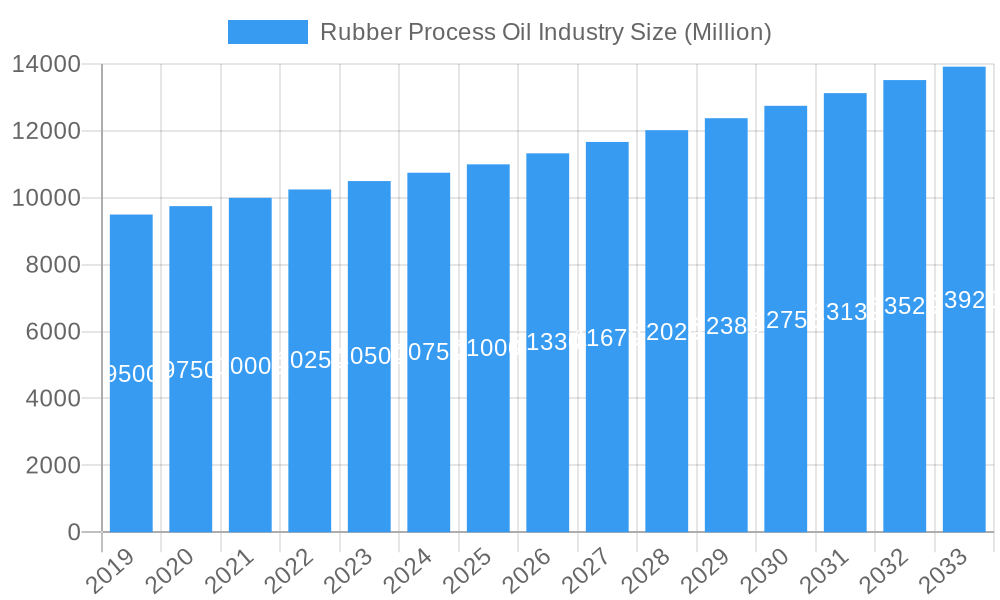
Rubber Process Oil Industry Market Size (In Million)
Key market drivers include ongoing advancements in rubber compounding technology, leading to the development of high-performance tires and more durable rubber products. The automotive industry's focus on enhancing fuel efficiency and reducing tire wear further propels the adoption of advanced rubber process oils. Conversely, market restraints involve fluctuating raw material prices, particularly those linked to crude oil, and stringent environmental regulations. Nevertheless, the shift towards sustainable and eco-friendly rubber processing solutions presents new opportunities, with companies investing in R&D for greener alternatives to capture larger market shares. The Asia Pacific region is anticipated to remain the dominant market due to its robust manufacturing base and escalating consumption of rubber products.
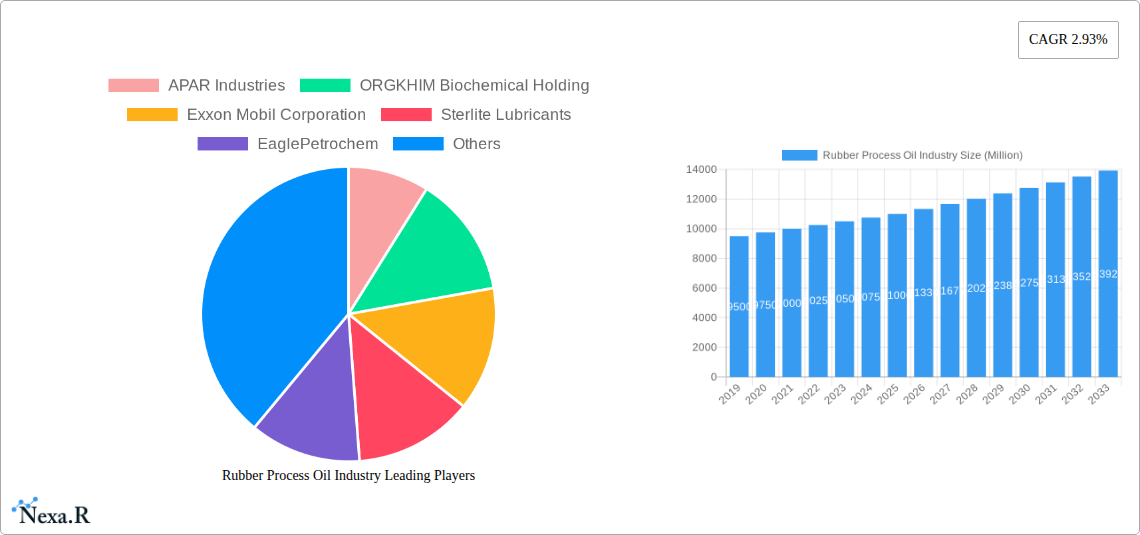
Rubber Process Oil Industry Company Market Share
Report Description: Global Rubber Process Oil Market Size, Share, and Growth Forecast (2019-2033)
This comprehensive report analyzes the dynamic Rubber Process Oil industry, detailing market size, growth trends, and future projections from 2019 to 2033, with a base year of 2025. It offers critical insights for stakeholders seeking to capitalize on the expanding rubber chemical market by examining the global rubber process oil market structure, key players, and emerging opportunities across various segments and applications.
Global Rubber Process Oil Market Dynamics & Structure
The Rubber Process Oil market is moderately concentrated, characterized by substantial investment in technological innovation by key players to develop high-performance products. Regulatory frameworks governing environmental impact and product safety significantly shape market dynamics. Growth is driven by increasing demand for rubber products across diverse applications and advancements in rubber compounding technology. While competitive product substitutes exist, they are generally outpaced by the tailored performance benefits of specialized rubber process oils. End-user demographics are shifting towards environmentally conscious consumers and industries prioritizing sustainable solutions. Merger and acquisition (M&A) trends are evident as companies aim to expand product portfolios and geographical reach, consolidating market share and enhancing operational efficiencies.
Rubber Process Oil Industry Growth Trends & Insights
The Rubber Process Oil market is poised for robust growth, projected to expand at a Compound Annual Growth Rate (CAGR) of approximately 2.93% during the forecast period (2025-2033). This expansion is propelled by escalating global demand for rubber tires and other rubber-based components, particularly from the burgeoning automotive industry in emerging economies. Technological disruptions, such as the development of novel rubber formulations requiring specialized process oils for optimal performance, are accelerating adoption rates. Consumer behavior shifts towards enhanced vehicle safety, fuel efficiency, and extended tire lifespan directly influence the demand for high-quality rubber process oils. The market size is estimated to reach over 3.73 million by 2025, with significant growth anticipated in the coming years. Innovations in eco-friendly and sustainable rubber process oils are gaining traction, aligning with global environmental initiatives and increasing consumer preferences for green products. The integration of advanced manufacturing techniques and continuous R&D efforts by leading manufacturers are key factors contributing to the market's sustained upward trajectory. The para-rubber oil market and aromatic rubber oil market are expected to witness substantial growth driven by their widespread use in tire manufacturing.
Dominant Regions, Countries, or Segments in Rubber Process Oil Industry
Asia Pacific currently leads the Rubber Process Oil market, driven by its substantial manufacturing base, particularly in China and India, which are leading global producers of tires and rubber goods. The tire and automobile components segment is the largest application area, accounting for an estimated over 65% of the market share in 2025. This dominance is fueled by increasing global vehicle production and stringent requirements for high-performance tires enhancing safety and fuel efficiency. The aromatic rubber process oil segment, historically dominant due to its excellent solvency and compatibility with various elastomers, continues to hold a substantial market share. However, the paraffinic rubber process oil segment is experiencing rapid growth due to increasing environmental regulations and a shift towards less toxic alternatives, particularly in North America and Europe.
Key drivers for Asia Pacific's dominance include:
Within the product type segment, aromatic rubber process oil is projected to maintain a leading position, estimated at over 40% of the market in 2025, due to its widespread use in tire manufacturing for its excellent solvency and plasticizing properties. However, paraffinic rubber process oil is expected to witness the highest growth rate, driven by increasing environmental concerns and regulatory pressures against certain aromatic compounds. The application segment of tire and automobile components is expected to dominate, representing an estimated 68% of the market value in 2025, due to the continuous expansion of the global automotive industry.
Rubber Process Oil Industry Product Landscape
The Rubber Process Oil industry product landscape is characterized by continuous innovation focused on enhancing performance, sustainability, and application-specific properties. Manufacturers are developing advanced aromatic, paraffinic, and naphthenic rubber process oils with improved solvency, lower volatility, and better compatibility with a wider range of synthetic and natural rubbers. These products are crucial for optimizing the processing of rubber compounds, improving the physical properties of finished goods like tires, footwear, and industrial belts, and meeting stringent regulatory requirements. Unique selling propositions often lie in tailored formulations that offer specific benefits such as enhanced grip, reduced rolling resistance, or improved aging resistance.
Key Drivers, Barriers & Challenges in Rubber Process Oil Industry
Key Drivers:
Barriers & Challenges:
Emerging Opportunities in Rubber Process Oil Industry
Emerging opportunities within the Rubber Process Oil industry include the development and adoption of bio-based and sustainable rubber process oils, catering to the growing demand for eco-friendly products. The expanding electric vehicle (EV) market presents a significant opportunity, as EVs often require specialized tire compounds demanding advanced process oils for enhanced performance and durability. Furthermore, untapped potential in emerging economies, particularly in Africa and parts of Southeast Asia, offers significant growth avenues. Innovation in process oils for niche applications such as medical devices and specialized industrial components also presents lucrative prospects.
Growth Accelerators in the Rubber Process Oil Industry Industry
Catalysts driving long-term growth in the Rubber Process Oil industry include significant investments in research and development by leading companies to create next-generation process oils with superior performance characteristics and reduced environmental impact. Strategic partnerships between rubber chemical manufacturers and tire producers foster collaborative innovation, leading to tailored solutions that meet specific industry needs. Market expansion strategies, including targeting under-penetrated regions and diversifying product portfolios to cater to a broader range of rubber applications, are also crucial growth accelerators. The increasing focus on circular economy principles within the rubber industry is expected to drive demand for process oils that facilitate the use of recycled rubber.
Key Players Shaping the Rubber Process Oil Industry Market
Notable Milestones in Rubber Process Oil Industry Sector
In-Depth Rubber Process Oil Industry Market Outlook
The future market potential for the Rubber Process Oil industry is highly promising, driven by continuous innovation and evolving market demands. Growth accelerators such as the increasing adoption of electric vehicles, the development of advanced rubber compounds, and expansion into emerging markets will shape the industry landscape. Strategic opportunities lie in capitalizing on the shift towards sustainable and environmentally friendly rubber process oil solutions, investing in R&D for specialized applications, and forging strong partnerships across the value chain. The market is expected to witness sustained growth, offering significant opportunities for stakeholders to expand their presence and profitability.
- Market Concentration: Moderate, with leading companies holding significant market share.
- Technological Innovation Drivers: Development of eco-friendly oils, enhanced performance characteristics, and specialized formulations for niche applications.
- Regulatory Frameworks: Strict adherence to environmental standards and product safety regulations.
- Competitive Product Substitutes: Limited alternatives offer comparable performance and cost-effectiveness.
- End-User Demographics: Growing demand from the automotive sector, tire manufacturers, and industries focused on durability and sustainability.
- M&A Trends: Strategic acquisitions to gain market access, diversify product offerings, and achieve economies of scale.
- Economic Policies: Favorable government policies supporting the automotive and manufacturing sectors.
- Infrastructure Development: Significant investments in road networks and transportation infrastructure, boosting vehicle demand.
- Lower Manufacturing Costs: Competitive production costs attract global tire and rubber product manufacturers.
- Growing Middle Class: Increased disposable income leading to higher vehicle ownership.
- Growth in Automotive Sector: The expanding global automotive industry, with its consistent demand for tires and other rubber components, is the primary growth engine.
- Technological Advancements in Rubber Compounding: Innovations in rubber technology necessitate specialized process oils for achieving desired material properties.
- Increased Demand for High-Performance Tires: Consumer and regulatory demand for tires offering better grip, fuel efficiency, and durability directly translates to higher-quality process oil needs.
- Infrastructure Development: Global investments in infrastructure projects drive demand for industrial rubber products.
- Volatile Raw Material Prices: Fluctuations in crude oil prices, the primary feedstock for rubber process oils, create price volatility and impact profit margins.
- Stringent Environmental Regulations: Increasing scrutiny and regulations regarding the environmental impact of certain process oils, particularly aromatic types, necessitate investment in cleaner alternatives.
- Supply Chain Disruptions: Geopolitical events and logistical challenges can disrupt the supply chain, leading to shortages and price hikes.
- Intense Competition: The presence of numerous global and regional players leads to significant competitive pressure and price sensitivity.
- APAR Industries
- ORGKHIM Biochemical Holding
- Exxon Mobil Corporation
- Sterlite Lubricants
- Eagle Petrochem
- Repsol
- LODHA Petro
- Chevron Corporation
- Witmans Industries Pvt Ltd*List Not Exhaustive
- TotalEnergies
- HF Sinclair Corporation
- Panama Petrochem Ltd
- CPC Corporation
- 2023: Introduction of a new generation of low-PAH (Polycyclic Aromatic Hydrocarbons) aromatic oils to meet stricter regulatory demands in Europe and North America.
- 2022: Significant investment in R&D by leading manufacturers to develop bio-based rubber process oils derived from renewable resources.
- 2021: Merger of two key regional players to expand their product portfolio and geographical reach within the Asian market.
- 2020: Launch of specialized naphthenic process oils designed for enhanced low-temperature performance in tire applications.
- 2019: Increased focus on sustainability initiatives, with major companies committing to reducing their carbon footprint in the production of rubber process oils.
Rubber Process Oil Industry Segmentation
-
1. Product Type
- 1.1. Aromatic
- 1.2. Paraffinic
- 1.3. Naphthenic
-
2. Application
- 2.1. Tire and Automobile Components
- 2.2. Footwear
- 2.3. Consumer Goods
- 2.4. Other Applications
Rubber Process Oil Industry Segmentation By Geography
-
1. Asia Pacific
- 1.1. China
- 1.2. India
- 1.3. Japan
- 1.4. South Korea
- 1.5. Rest of Asia Pacific
-
2. North America
- 2.1. United States
- 2.2. Canada
- 2.3. Mexico
-
3. Europe
- 3.1. Germany
- 3.2. United Kingdom
- 3.3. France
- 3.4. Italy
- 3.5. Rest of Europe
-
4. South America
- 4.1. Brazil
- 4.2. Argentina
- 4.3. Rest of South America
-
5. Middle East and Africa
- 5.1. Saudi Arabia
- 5.2. South Africa
- 5.3. Rest of Middle East and Africa
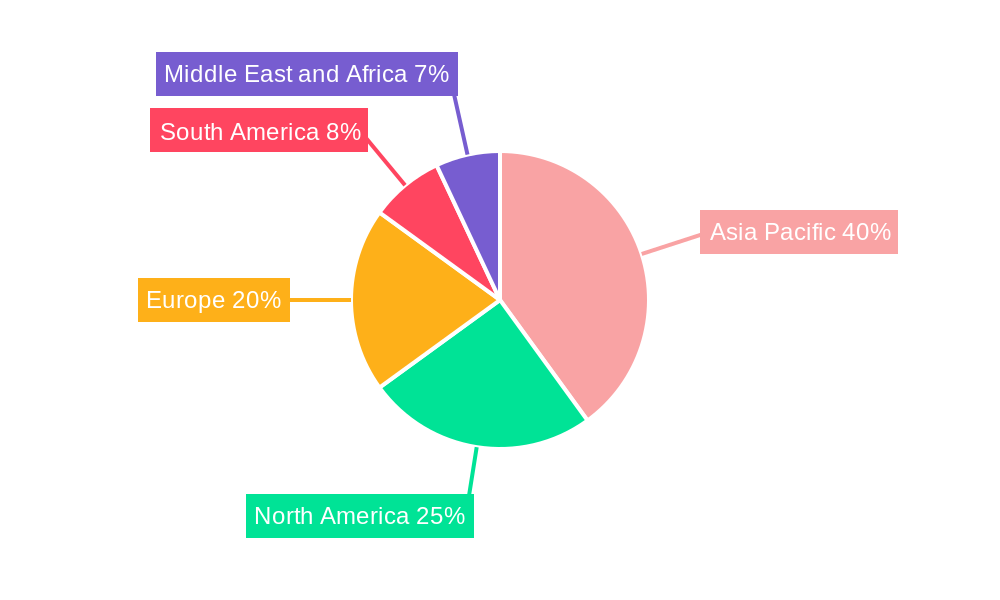
Rubber Process Oil Industry Regional Market Share
Geographic Coverage of Rubber Process Oil Industry
Rubber Process Oil Industry REPORT HIGHLIGHTS
| Aspects | Details |
|---|---|
| Study Period | 2020-2034 |
| Base Year | 2025 |
| Estimated Year | 2026 |
| Forecast Period | 2026-2034 |
| Historical Period | 2020-2025 |
| Growth Rate | CAGR of 2.93% from 2020-2034 |
| Segmentation |
|
Table of Contents
- 1. Introduction
- 1.1. Research Scope
- 1.2. Market Segmentation
- 1.3. Research Objective
- 1.4. Definitions and Assumptions
- 2. Executive Summary
- 2.1. Market Snapshot
- 3. Market Dynamics
- 3.1. Market Drivers
- 3.2. Market Restrains
- 3.3. Market Trends
- 3.4. Market Opportunities
- 4. Market Factor Analysis
- 4.1. Porters Five Forces
- 4.1.1. Bargaining Power of Suppliers
- 4.1.2. Bargaining Power of Buyers
- 4.1.3. Threat of New Entrants
- 4.1.4. Threat of Substitutes
- 4.1.5. Competitive Rivalry
- 4.2. PESTEL analysis
- 4.3. BCG Analysis
- 4.3.1. Stars (High Growth, High Market Share)
- 4.3.2. Cash Cows (Low Growth, High Market Share)
- 4.3.3. Question Mark (High Growth, Low Market Share)
- 4.3.4. Dogs (Low Growth, Low Market Share)
- 4.4. Ansoff Matrix Analysis
- 4.5. Supply Chain Analysis
- 4.6. Regulatory Landscape
- 4.7. Current Market Potential and Opportunity Assessment (TAM–SAM–SOM Framework)
- 4.8. NRP Analyst Note
- 4.1. Porters Five Forces
- 5. Market Analysis, Insights and Forecast 2021-2033
- 5.1. Market Analysis, Insights and Forecast - by Product Type
- 5.1.1. Aromatic
- 5.1.2. Paraffinic
- 5.1.3. Naphthenic
- 5.2. Market Analysis, Insights and Forecast - by Application
- 5.2.1. Tire and Automobile Components
- 5.2.2. Footwear
- 5.2.3. Consumer Goods
- 5.2.4. Other Applications
- 5.3. Market Analysis, Insights and Forecast - by Region
- 5.3.1. Asia Pacific
- 5.3.2. North America
- 5.3.3. Europe
- 5.3.4. South America
- 5.3.5. Middle East and Africa
- 5.1. Market Analysis, Insights and Forecast - by Product Type
- 6. Global Rubber Process Oil Industry Analysis, Insights and Forecast, 2021-2033
- 6.1. Market Analysis, Insights and Forecast - by Product Type
- 6.1.1. Aromatic
- 6.1.2. Paraffinic
- 6.1.3. Naphthenic
- 6.2. Market Analysis, Insights and Forecast - by Application
- 6.2.1. Tire and Automobile Components
- 6.2.2. Footwear
- 6.2.3. Consumer Goods
- 6.2.4. Other Applications
- 6.1. Market Analysis, Insights and Forecast - by Product Type
- 7. Asia Pacific Rubber Process Oil Industry Analysis, Insights and Forecast, 2020-2032
- 7.1. Market Analysis, Insights and Forecast - by Product Type
- 7.1.1. Aromatic
- 7.1.2. Paraffinic
- 7.1.3. Naphthenic
- 7.2. Market Analysis, Insights and Forecast - by Application
- 7.2.1. Tire and Automobile Components
- 7.2.2. Footwear
- 7.2.3. Consumer Goods
- 7.2.4. Other Applications
- 7.1. Market Analysis, Insights and Forecast - by Product Type
- 8. North America Rubber Process Oil Industry Analysis, Insights and Forecast, 2020-2032
- 8.1. Market Analysis, Insights and Forecast - by Product Type
- 8.1.1. Aromatic
- 8.1.2. Paraffinic
- 8.1.3. Naphthenic
- 8.2. Market Analysis, Insights and Forecast - by Application
- 8.2.1. Tire and Automobile Components
- 8.2.2. Footwear
- 8.2.3. Consumer Goods
- 8.2.4. Other Applications
- 8.1. Market Analysis, Insights and Forecast - by Product Type
- 9. Europe Rubber Process Oil Industry Analysis, Insights and Forecast, 2020-2032
- 9.1. Market Analysis, Insights and Forecast - by Product Type
- 9.1.1. Aromatic
- 9.1.2. Paraffinic
- 9.1.3. Naphthenic
- 9.2. Market Analysis, Insights and Forecast - by Application
- 9.2.1. Tire and Automobile Components
- 9.2.2. Footwear
- 9.2.3. Consumer Goods
- 9.2.4. Other Applications
- 9.1. Market Analysis, Insights and Forecast - by Product Type
- 10. South America Rubber Process Oil Industry Analysis, Insights and Forecast, 2020-2032
- 10.1. Market Analysis, Insights and Forecast - by Product Type
- 10.1.1. Aromatic
- 10.1.2. Paraffinic
- 10.1.3. Naphthenic
- 10.2. Market Analysis, Insights and Forecast - by Application
- 10.2.1. Tire and Automobile Components
- 10.2.2. Footwear
- 10.2.3. Consumer Goods
- 10.2.4. Other Applications
- 10.1. Market Analysis, Insights and Forecast - by Product Type
- 11. Middle East and Africa Rubber Process Oil Industry Analysis, Insights and Forecast, 2020-2032
- 11.1. Market Analysis, Insights and Forecast - by Product Type
- 11.1.1. Aromatic
- 11.1.2. Paraffinic
- 11.1.3. Naphthenic
- 11.2. Market Analysis, Insights and Forecast - by Application
- 11.2.1. Tire and Automobile Components
- 11.2.2. Footwear
- 11.2.3. Consumer Goods
- 11.2.4. Other Applications
- 11.1. Market Analysis, Insights and Forecast - by Product Type
- 12. Competitive Analysis
- 12.1. Company Profiles
- 12.1.1 APAR Industries
- 12.1.1.1. Company Overview
- 12.1.1.2. Products
- 12.1.1.3. Company Financials
- 12.1.1.4. SWOT Analysis
- 12.1.2 ORGKHIM Biochemical Holding
- 12.1.2.1. Company Overview
- 12.1.2.2. Products
- 12.1.2.3. Company Financials
- 12.1.2.4. SWOT Analysis
- 12.1.3 Exxon Mobil Corporation
- 12.1.3.1. Company Overview
- 12.1.3.2. Products
- 12.1.3.3. Company Financials
- 12.1.3.4. SWOT Analysis
- 12.1.4 Sterlite Lubricants
- 12.1.4.1. Company Overview
- 12.1.4.2. Products
- 12.1.4.3. Company Financials
- 12.1.4.4. SWOT Analysis
- 12.1.5 EaglePetrochem
- 12.1.5.1. Company Overview
- 12.1.5.2. Products
- 12.1.5.3. Company Financials
- 12.1.5.4. SWOT Analysis
- 12.1.6 Repsol
- 12.1.6.1. Company Overview
- 12.1.6.2. Products
- 12.1.6.3. Company Financials
- 12.1.6.4. SWOT Analysis
- 12.1.7 LODHA Petro
- 12.1.7.1. Company Overview
- 12.1.7.2. Products
- 12.1.7.3. Company Financials
- 12.1.7.4. SWOT Analysis
- 12.1.8 Chevron Corporation
- 12.1.8.1. Company Overview
- 12.1.8.2. Products
- 12.1.8.3. Company Financials
- 12.1.8.4. SWOT Analysis
- 12.1.9 Witmans Industries Pvt Ltd*List Not Exhaustive
- 12.1.9.1. Company Overview
- 12.1.9.2. Products
- 12.1.9.3. Company Financials
- 12.1.9.4. SWOT Analysis
- 12.1.10 TotalEnergies
- 12.1.10.1. Company Overview
- 12.1.10.2. Products
- 12.1.10.3. Company Financials
- 12.1.10.4. SWOT Analysis
- 12.1.11 HF Sinclair Corporation
- 12.1.11.1. Company Overview
- 12.1.11.2. Products
- 12.1.11.3. Company Financials
- 12.1.11.4. SWOT Analysis
- 12.1.12 Panama Petrochem Ltd
- 12.1.12.1. Company Overview
- 12.1.12.2. Products
- 12.1.12.3. Company Financials
- 12.1.12.4. SWOT Analysis
- 12.1.13 CPC Corporation
- 12.1.13.1. Company Overview
- 12.1.13.2. Products
- 12.1.13.3. Company Financials
- 12.1.13.4. SWOT Analysis
- 12.1.1 APAR Industries
- 12.2. Market Entropy
- 12.2.1 Company's Key Areas Served
- 12.2.2 Recent Developments
- 12.3. Company Market Share Analysis 2025
- 12.3.1 Top 5 Companies Market Share Analysis
- 12.3.2 Top 3 Companies Market Share Analysis
- 12.4. List of Potential Customers
- 13. Research Methodology
List of Figures
- Figure 1: Global Rubber Process Oil Industry Revenue Breakdown (million, %) by Region 2025 & 2033
- Figure 2: Global Rubber Process Oil Industry Volume Breakdown (Million, %) by Region 2025 & 2033
- Figure 3: Asia Pacific Rubber Process Oil Industry Revenue (million), by Product Type 2025 & 2033
- Figure 4: Asia Pacific Rubber Process Oil Industry Volume (Million), by Product Type 2025 & 2033
- Figure 5: Asia Pacific Rubber Process Oil Industry Revenue Share (%), by Product Type 2025 & 2033
- Figure 6: Asia Pacific Rubber Process Oil Industry Volume Share (%), by Product Type 2025 & 2033
- Figure 7: Asia Pacific Rubber Process Oil Industry Revenue (million), by Application 2025 & 2033
- Figure 8: Asia Pacific Rubber Process Oil Industry Volume (Million), by Application 2025 & 2033
- Figure 9: Asia Pacific Rubber Process Oil Industry Revenue Share (%), by Application 2025 & 2033
- Figure 10: Asia Pacific Rubber Process Oil Industry Volume Share (%), by Application 2025 & 2033
- Figure 11: Asia Pacific Rubber Process Oil Industry Revenue (million), by Country 2025 & 2033
- Figure 12: Asia Pacific Rubber Process Oil Industry Volume (Million), by Country 2025 & 2033
- Figure 13: Asia Pacific Rubber Process Oil Industry Revenue Share (%), by Country 2025 & 2033
- Figure 14: Asia Pacific Rubber Process Oil Industry Volume Share (%), by Country 2025 & 2033
- Figure 15: North America Rubber Process Oil Industry Revenue (million), by Product Type 2025 & 2033
- Figure 16: North America Rubber Process Oil Industry Volume (Million), by Product Type 2025 & 2033
- Figure 17: North America Rubber Process Oil Industry Revenue Share (%), by Product Type 2025 & 2033
- Figure 18: North America Rubber Process Oil Industry Volume Share (%), by Product Type 2025 & 2033
- Figure 19: North America Rubber Process Oil Industry Revenue (million), by Application 2025 & 2033
- Figure 20: North America Rubber Process Oil Industry Volume (Million), by Application 2025 & 2033
- Figure 21: North America Rubber Process Oil Industry Revenue Share (%), by Application 2025 & 2033
- Figure 22: North America Rubber Process Oil Industry Volume Share (%), by Application 2025 & 2033
- Figure 23: North America Rubber Process Oil Industry Revenue (million), by Country 2025 & 2033
- Figure 24: North America Rubber Process Oil Industry Volume (Million), by Country 2025 & 2033
- Figure 25: North America Rubber Process Oil Industry Revenue Share (%), by Country 2025 & 2033
- Figure 26: North America Rubber Process Oil Industry Volume Share (%), by Country 2025 & 2033
- Figure 27: Europe Rubber Process Oil Industry Revenue (million), by Product Type 2025 & 2033
- Figure 28: Europe Rubber Process Oil Industry Volume (Million), by Product Type 2025 & 2033
- Figure 29: Europe Rubber Process Oil Industry Revenue Share (%), by Product Type 2025 & 2033
- Figure 30: Europe Rubber Process Oil Industry Volume Share (%), by Product Type 2025 & 2033
- Figure 31: Europe Rubber Process Oil Industry Revenue (million), by Application 2025 & 2033
- Figure 32: Europe Rubber Process Oil Industry Volume (Million), by Application 2025 & 2033
- Figure 33: Europe Rubber Process Oil Industry Revenue Share (%), by Application 2025 & 2033
- Figure 34: Europe Rubber Process Oil Industry Volume Share (%), by Application 2025 & 2033
- Figure 35: Europe Rubber Process Oil Industry Revenue (million), by Country 2025 & 2033
- Figure 36: Europe Rubber Process Oil Industry Volume (Million), by Country 2025 & 2033
- Figure 37: Europe Rubber Process Oil Industry Revenue Share (%), by Country 2025 & 2033
- Figure 38: Europe Rubber Process Oil Industry Volume Share (%), by Country 2025 & 2033
- Figure 39: South America Rubber Process Oil Industry Revenue (million), by Product Type 2025 & 2033
- Figure 40: South America Rubber Process Oil Industry Volume (Million), by Product Type 2025 & 2033
- Figure 41: South America Rubber Process Oil Industry Revenue Share (%), by Product Type 2025 & 2033
- Figure 42: South America Rubber Process Oil Industry Volume Share (%), by Product Type 2025 & 2033
- Figure 43: South America Rubber Process Oil Industry Revenue (million), by Application 2025 & 2033
- Figure 44: South America Rubber Process Oil Industry Volume (Million), by Application 2025 & 2033
- Figure 45: South America Rubber Process Oil Industry Revenue Share (%), by Application 2025 & 2033
- Figure 46: South America Rubber Process Oil Industry Volume Share (%), by Application 2025 & 2033
- Figure 47: South America Rubber Process Oil Industry Revenue (million), by Country 2025 & 2033
- Figure 48: South America Rubber Process Oil Industry Volume (Million), by Country 2025 & 2033
- Figure 49: South America Rubber Process Oil Industry Revenue Share (%), by Country 2025 & 2033
- Figure 50: South America Rubber Process Oil Industry Volume Share (%), by Country 2025 & 2033
- Figure 51: Middle East and Africa Rubber Process Oil Industry Revenue (million), by Product Type 2025 & 2033
- Figure 52: Middle East and Africa Rubber Process Oil Industry Volume (Million), by Product Type 2025 & 2033
- Figure 53: Middle East and Africa Rubber Process Oil Industry Revenue Share (%), by Product Type 2025 & 2033
- Figure 54: Middle East and Africa Rubber Process Oil Industry Volume Share (%), by Product Type 2025 & 2033
- Figure 55: Middle East and Africa Rubber Process Oil Industry Revenue (million), by Application 2025 & 2033
- Figure 56: Middle East and Africa Rubber Process Oil Industry Volume (Million), by Application 2025 & 2033
- Figure 57: Middle East and Africa Rubber Process Oil Industry Revenue Share (%), by Application 2025 & 2033
- Figure 58: Middle East and Africa Rubber Process Oil Industry Volume Share (%), by Application 2025 & 2033
- Figure 59: Middle East and Africa Rubber Process Oil Industry Revenue (million), by Country 2025 & 2033
- Figure 60: Middle East and Africa Rubber Process Oil Industry Volume (Million), by Country 2025 & 2033
- Figure 61: Middle East and Africa Rubber Process Oil Industry Revenue Share (%), by Country 2025 & 2033
- Figure 62: Middle East and Africa Rubber Process Oil Industry Volume Share (%), by Country 2025 & 2033
List of Tables
- Table 1: Global Rubber Process Oil Industry Revenue million Forecast, by Product Type 2020 & 2033
- Table 2: Global Rubber Process Oil Industry Volume Million Forecast, by Product Type 2020 & 2033
- Table 3: Global Rubber Process Oil Industry Revenue million Forecast, by Application 2020 & 2033
- Table 4: Global Rubber Process Oil Industry Volume Million Forecast, by Application 2020 & 2033
- Table 5: Global Rubber Process Oil Industry Revenue million Forecast, by Region 2020 & 2033
- Table 6: Global Rubber Process Oil Industry Volume Million Forecast, by Region 2020 & 2033
- Table 7: Global Rubber Process Oil Industry Revenue million Forecast, by Product Type 2020 & 2033
- Table 8: Global Rubber Process Oil Industry Volume Million Forecast, by Product Type 2020 & 2033
- Table 9: Global Rubber Process Oil Industry Revenue million Forecast, by Application 2020 & 2033
- Table 10: Global Rubber Process Oil Industry Volume Million Forecast, by Application 2020 & 2033
- Table 11: Global Rubber Process Oil Industry Revenue million Forecast, by Country 2020 & 2033
- Table 12: Global Rubber Process Oil Industry Volume Million Forecast, by Country 2020 & 2033
- Table 13: China Rubber Process Oil Industry Revenue (million) Forecast, by Application 2020 & 2033
- Table 14: China Rubber Process Oil Industry Volume (Million) Forecast, by Application 2020 & 2033
- Table 15: India Rubber Process Oil Industry Revenue (million) Forecast, by Application 2020 & 2033
- Table 16: India Rubber Process Oil Industry Volume (Million) Forecast, by Application 2020 & 2033
- Table 17: Japan Rubber Process Oil Industry Revenue (million) Forecast, by Application 2020 & 2033
- Table 18: Japan Rubber Process Oil Industry Volume (Million) Forecast, by Application 2020 & 2033
- Table 19: South Korea Rubber Process Oil Industry Revenue (million) Forecast, by Application 2020 & 2033
- Table 20: South Korea Rubber Process Oil Industry Volume (Million) Forecast, by Application 2020 & 2033
- Table 21: Rest of Asia Pacific Rubber Process Oil Industry Revenue (million) Forecast, by Application 2020 & 2033
- Table 22: Rest of Asia Pacific Rubber Process Oil Industry Volume (Million) Forecast, by Application 2020 & 2033
- Table 23: Global Rubber Process Oil Industry Revenue million Forecast, by Product Type 2020 & 2033
- Table 24: Global Rubber Process Oil Industry Volume Million Forecast, by Product Type 2020 & 2033
- Table 25: Global Rubber Process Oil Industry Revenue million Forecast, by Application 2020 & 2033
- Table 26: Global Rubber Process Oil Industry Volume Million Forecast, by Application 2020 & 2033
- Table 27: Global Rubber Process Oil Industry Revenue million Forecast, by Country 2020 & 2033
- Table 28: Global Rubber Process Oil Industry Volume Million Forecast, by Country 2020 & 2033
- Table 29: United States Rubber Process Oil Industry Revenue (million) Forecast, by Application 2020 & 2033
- Table 30: United States Rubber Process Oil Industry Volume (Million) Forecast, by Application 2020 & 2033
- Table 31: Canada Rubber Process Oil Industry Revenue (million) Forecast, by Application 2020 & 2033
- Table 32: Canada Rubber Process Oil Industry Volume (Million) Forecast, by Application 2020 & 2033
- Table 33: Mexico Rubber Process Oil Industry Revenue (million) Forecast, by Application 2020 & 2033
- Table 34: Mexico Rubber Process Oil Industry Volume (Million) Forecast, by Application 2020 & 2033
- Table 35: Global Rubber Process Oil Industry Revenue million Forecast, by Product Type 2020 & 2033
- Table 36: Global Rubber Process Oil Industry Volume Million Forecast, by Product Type 2020 & 2033
- Table 37: Global Rubber Process Oil Industry Revenue million Forecast, by Application 2020 & 2033
- Table 38: Global Rubber Process Oil Industry Volume Million Forecast, by Application 2020 & 2033
- Table 39: Global Rubber Process Oil Industry Revenue million Forecast, by Country 2020 & 2033
- Table 40: Global Rubber Process Oil Industry Volume Million Forecast, by Country 2020 & 2033
- Table 41: Germany Rubber Process Oil Industry Revenue (million) Forecast, by Application 2020 & 2033
- Table 42: Germany Rubber Process Oil Industry Volume (Million) Forecast, by Application 2020 & 2033
- Table 43: United Kingdom Rubber Process Oil Industry Revenue (million) Forecast, by Application 2020 & 2033
- Table 44: United Kingdom Rubber Process Oil Industry Volume (Million) Forecast, by Application 2020 & 2033
- Table 45: France Rubber Process Oil Industry Revenue (million) Forecast, by Application 2020 & 2033
- Table 46: France Rubber Process Oil Industry Volume (Million) Forecast, by Application 2020 & 2033
- Table 47: Italy Rubber Process Oil Industry Revenue (million) Forecast, by Application 2020 & 2033
- Table 48: Italy Rubber Process Oil Industry Volume (Million) Forecast, by Application 2020 & 2033
- Table 49: Rest of Europe Rubber Process Oil Industry Revenue (million) Forecast, by Application 2020 & 2033
- Table 50: Rest of Europe Rubber Process Oil Industry Volume (Million) Forecast, by Application 2020 & 2033
- Table 51: Global Rubber Process Oil Industry Revenue million Forecast, by Product Type 2020 & 2033
- Table 52: Global Rubber Process Oil Industry Volume Million Forecast, by Product Type 2020 & 2033
- Table 53: Global Rubber Process Oil Industry Revenue million Forecast, by Application 2020 & 2033
- Table 54: Global Rubber Process Oil Industry Volume Million Forecast, by Application 2020 & 2033
- Table 55: Global Rubber Process Oil Industry Revenue million Forecast, by Country 2020 & 2033
- Table 56: Global Rubber Process Oil Industry Volume Million Forecast, by Country 2020 & 2033
- Table 57: Brazil Rubber Process Oil Industry Revenue (million) Forecast, by Application 2020 & 2033
- Table 58: Brazil Rubber Process Oil Industry Volume (Million) Forecast, by Application 2020 & 2033
- Table 59: Argentina Rubber Process Oil Industry Revenue (million) Forecast, by Application 2020 & 2033
- Table 60: Argentina Rubber Process Oil Industry Volume (Million) Forecast, by Application 2020 & 2033
- Table 61: Rest of South America Rubber Process Oil Industry Revenue (million) Forecast, by Application 2020 & 2033
- Table 62: Rest of South America Rubber Process Oil Industry Volume (Million) Forecast, by Application 2020 & 2033
- Table 63: Global Rubber Process Oil Industry Revenue million Forecast, by Product Type 2020 & 2033
- Table 64: Global Rubber Process Oil Industry Volume Million Forecast, by Product Type 2020 & 2033
- Table 65: Global Rubber Process Oil Industry Revenue million Forecast, by Application 2020 & 2033
- Table 66: Global Rubber Process Oil Industry Volume Million Forecast, by Application 2020 & 2033
- Table 67: Global Rubber Process Oil Industry Revenue million Forecast, by Country 2020 & 2033
- Table 68: Global Rubber Process Oil Industry Volume Million Forecast, by Country 2020 & 2033
- Table 69: Saudi Arabia Rubber Process Oil Industry Revenue (million) Forecast, by Application 2020 & 2033
- Table 70: Saudi Arabia Rubber Process Oil Industry Volume (Million) Forecast, by Application 2020 & 2033
- Table 71: South Africa Rubber Process Oil Industry Revenue (million) Forecast, by Application 2020 & 2033
- Table 72: South Africa Rubber Process Oil Industry Volume (Million) Forecast, by Application 2020 & 2033
- Table 73: Rest of Middle East and Africa Rubber Process Oil Industry Revenue (million) Forecast, by Application 2020 & 2033
- Table 74: Rest of Middle East and Africa Rubber Process Oil Industry Volume (Million) Forecast, by Application 2020 & 2033
Frequently Asked Questions
1. What is the projected Compound Annual Growth Rate (CAGR) of the Rubber Process Oil Industry?
The projected CAGR is approximately 2.93%.
2. Which companies are prominent players in the Rubber Process Oil Industry?
Key companies in the market include APAR Industries, ORGKHIM Biochemical Holding, Exxon Mobil Corporation, Sterlite Lubricants, EaglePetrochem, Repsol, LODHA Petro, Chevron Corporation, Witmans Industries Pvt Ltd*List Not Exhaustive, TotalEnergies, HF Sinclair Corporation, Panama Petrochem Ltd, CPC Corporation.
3. What are the main segments of the Rubber Process Oil Industry?
The market segments include Product Type, Application.
4. Can you provide details about the market size?
The market size is estimated to be USD 3.73 million as of 2022.
5. What are some drivers contributing to market growth?
Increasing Demand for Tire and Automotive Components; Growing Demand for Footwear; Others.
6. What are the notable trends driving market growth?
Growing Demand of Rubber Process Oil from Tire and Automobile Components.
7. Are there any restraints impacting market growth?
Volatility in Raw Material Price; Other Restraints.
8. Can you provide examples of recent developments in the market?
N/A
9. What pricing options are available for accessing the report?
Pricing options include single-user, multi-user, and enterprise licenses priced at USD 4750, USD 5250, and USD 8750 respectively.
10. Is the market size provided in terms of value or volume?
The market size is provided in terms of value, measured in million and volume, measured in Million.
11. Are there any specific market keywords associated with the report?
Yes, the market keyword associated with the report is "Rubber Process Oil Industry," which aids in identifying and referencing the specific market segment covered.
12. How do I determine which pricing option suits my needs best?
The pricing options vary based on user requirements and access needs. Individual users may opt for single-user licenses, while businesses requiring broader access may choose multi-user or enterprise licenses for cost-effective access to the report.
13. Are there any additional resources or data provided in the Rubber Process Oil Industry report?
While the report offers comprehensive insights, it's advisable to review the specific contents or supplementary materials provided to ascertain if additional resources or data are available.
14. How can I stay updated on further developments or reports in the Rubber Process Oil Industry?
To stay informed about further developments, trends, and reports in the Rubber Process Oil Industry, consider subscribing to industry newsletters, following relevant companies and organizations, or regularly checking reputable industry news sources and publications.
Methodology
Step 1 - Identification of Relevant Samples Size from Population Database


Step 2 - Approaches for Defining Global Market Size (Value, Volume* & Price*)

Note*: In applicable scenarios
Step 3 - Data Sources
Primary Research
- Web Analytics
- Survey Reports
- Research Institute
- Latest Research Reports
- Opinion Leaders
Secondary Research
- Annual Reports
- White Paper
- Latest Press Release
- Industry Association
- Paid Database
- Investor Presentations

Step 4 - Data Triangulation
Involves using different sources of information in order to increase the validity of a study
These sources are likely to be stakeholders in a program - participants, other researchers, program staff, other community members, and so on.
Then we put all data in single framework & apply various statistical tools to find out the dynamic on the market.
During the analysis stage, feedback from the stakeholder groups would be compared to determine areas of agreement as well as areas of divergence