

Key Insights
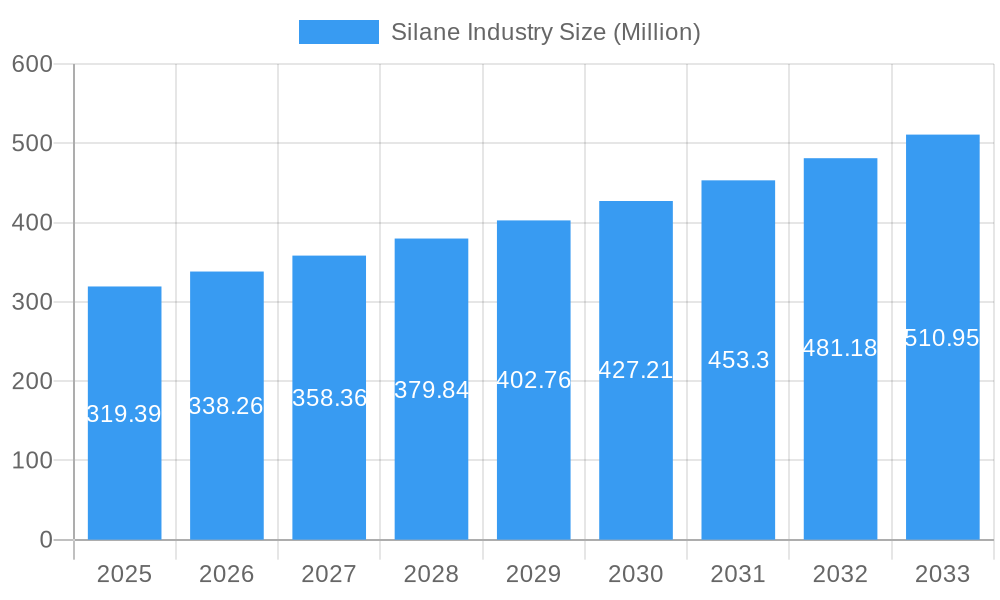
The global silane market, valued at $319.39 million in 2025, is projected to experience robust growth, driven by a compound annual growth rate (CAGR) of 5.7% from 2025 to 2033. This expansion is fueled by several key factors. The burgeoning construction industry, particularly in developing economies, significantly boosts demand for silanes in construction sealants, adhesives, and coatings, enhancing durability and performance. Simultaneously, the rising adoption of silanes in the plastics and rubber industries to improve adhesion, flexibility, and weather resistance further contributes to market growth. The automotive sector's increasing demand for high-performance materials also fuels silane consumption. Furthermore, the expanding electronics industry utilizes silanes in semiconductor manufacturing and related applications, driving specialized silane segment growth. Technological advancements leading to the development of new silane-based products with enhanced properties are another critical driver.
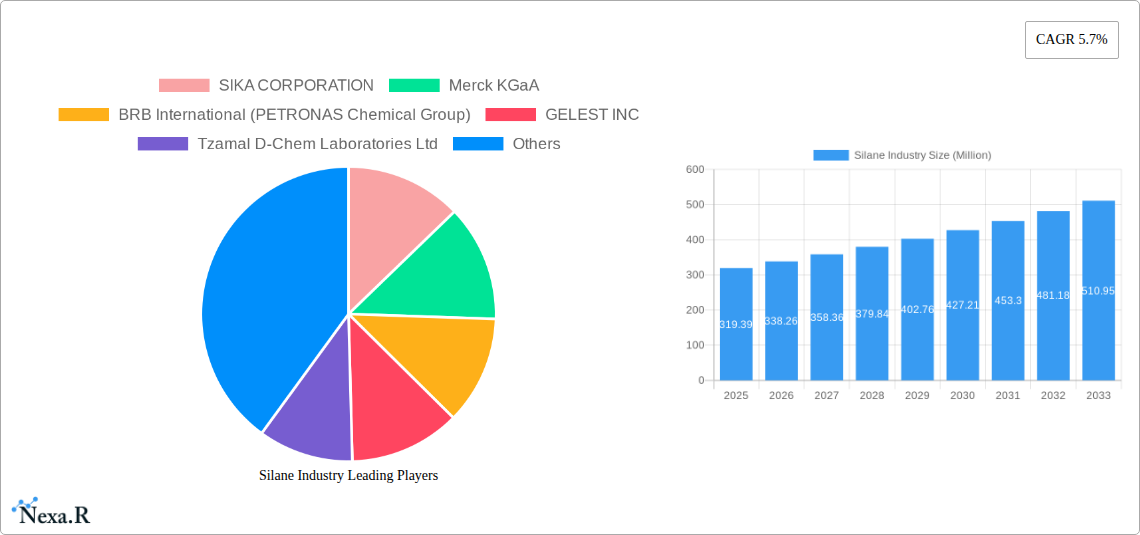
Silane Industry Market Size (In Million)
However, market growth is not without its challenges. Fluctuations in raw material prices, particularly for silicon-based materials, can impact silane production costs and profitability. Stringent environmental regulations concerning the use and disposal of certain silane compounds pose potential restraints. Competition among established players and the emergence of new entrants also contribute to a dynamic market landscape. Nevertheless, the overall positive outlook for the silane market remains strong, driven by the diverse and growing applications across multiple end-use sectors. Market segmentation reveals significant opportunities within specific application areas, such as high-performance coatings and specialized industrial applications, offering significant potential for growth in the coming years. Regional analysis indicates strong growth potential across Asia-Pacific, driven by significant infrastructure development and industrial expansion.
Silane Industry Company Market Share
Silane Industry Market Report: 2019-2033
This comprehensive report provides an in-depth analysis of the global silane industry, covering market dynamics, growth trends, regional segmentation, product landscape, key players, and future outlook. The study period spans from 2019 to 2033, with 2025 serving as the base and estimated year. The report is meticulously crafted for industry professionals, investors, and researchers seeking a robust understanding of this dynamic market. The total market size in 2025 is estimated at xx Million.
Silane Industry Market Dynamics & Structure
The global silane market is characterized by a moderate level of concentration, with a few key players asserting significant market influence. This dynamic is shaped by ongoing technological advancements, especially those aimed at enhancing silane performance and broadening their application spectrum. Stringent regulatory frameworks, particularly concerning environmental impact and safety protocols, are actively influencing industry practices and product development. The market also faces considerations from competition arising from alternative materials and the continuous emergence of novel silane types. While not excessively frequent, mergers and acquisitions (M&A) have historically played a role in reshaping the competitive landscape and consolidating market positions.
- Market Concentration: The market exhibits moderate concentration, with the top 5 players projected to collectively hold approximately 60% of the global market share by 2025.
- Technological Innovation: A primary focus is on developing high-performance silanes that offer enhanced properties, such as superior adhesion, increased durability, and improved water resistance, catering to evolving industry demands.
- Regulatory Landscape: Strict environmental regulations and evolving safety standards are significant drivers, influencing manufacturing processes, product formulations, and the overall lifecycle management of silane products.
- Competitive Substitutes: The market navigates competition from a range of alternative materials used in adhesives, sealants, and coating applications, necessitating continuous innovation and value proposition enhancement.
- M&A Activity: A moderate level of strategic M&A activity is observed, primarily driven by companies seeking to expand their market reach, acquire new technologies, or strengthen their product portfolios. Approximately [Insert Number] deals were recorded between 2019 and 2024, indicating strategic consolidation.
- End-User Demographics: The growth trajectory of the silane market is significantly propelled by escalating demand from pivotal end-use sectors, including construction, automotive, and electronics.
Silane Industry Growth Trends & Insights
The global silane market is poised for substantial growth throughout the projected forecast period, spanning from 2025 to 2033. This expansion is anticipated to be fueled by the increasing adoption and diversification of silane applications across a broad spectrum of industries. The market is expected to achieve a compound annual growth rate (CAGR) of [Insert CAGR]% between 2025 and 2033. Key contributing factors to this robust growth include the rising demand from critical end-use sectors, significant technological advancements leading to improved silane efficacy and performance, and continuous innovation in product formulations and synthesis methods. Furthermore, the growing market penetration of silanes in specialized and niche applications is contributing considerably to the overall market expansion. Consumer preferences are increasingly shifting towards products that offer enhanced durability, improved sustainability credentials, and greater cost-effectiveness, thereby driving the demand for advanced silane-based solutions that meet these evolving expectations.
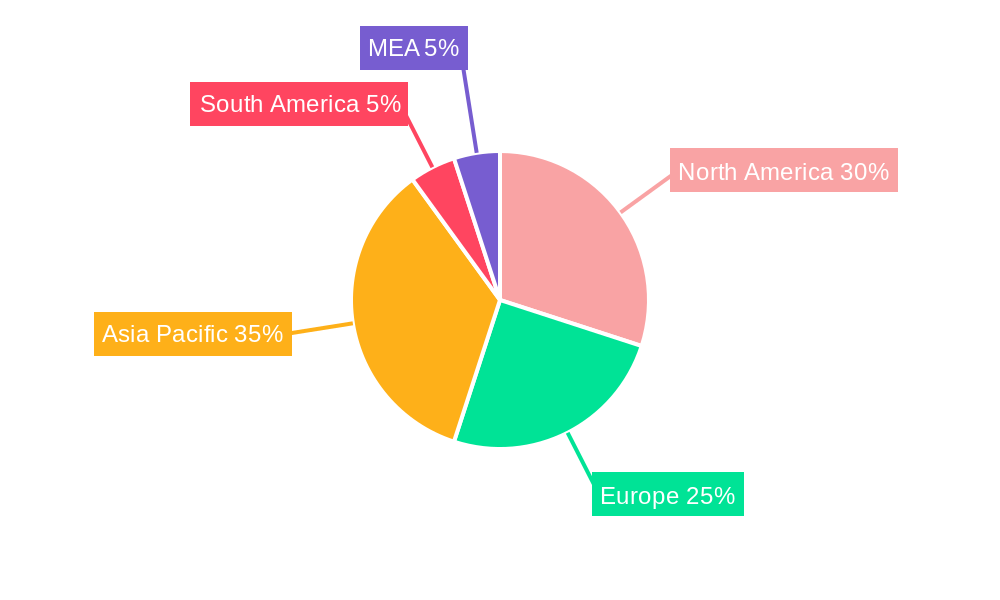
Dominant Regions, Countries, or Segments in Silane Industry
The Asia-Pacific region is anticipated to emerge as the dominant force in the global silane market. This prominence is attributed to its robust economic expansion, continuous infrastructure development, and substantial investments within the construction and automotive industries. Within this region, China and India are expected to be significant contributors to the overall growth. Examining the product segments, Alkyl silanes are projected to maintain the largest market share due to their extensive and versatile applications across a multitude of industries. Concurrently, the Building & Construction segment stands out as the most significant application area, benefiting directly from the ongoing global expansion of infrastructure projects and the demand for advanced building materials.
- Key Drivers in Asia-Pacific: Rapid urbanization, a rising trend in disposable incomes, and substantial government investments in large-scale infrastructure projects are key growth enablers for the silane market in the Asia-Pacific region.
- Alkyl Silane Dominance: The broad spectrum of applications for alkyl silanes across diverse industrial sectors underpins their leading position in the market.
- Building & Construction Segment Leadership: The continuous and widespread expansion of the global construction sector is the primary driver for the leadership of the Building & Construction segment in silane consumption.
- Market Share: The Asia-Pacific region is estimated to command approximately 45% of the global market share in 2025, underscoring its significant influence.
Silane Industry Product Landscape
The silane technology sector is in a state of continuous evolution, marked by ongoing product innovations that consistently enhance performance characteristics and unlock new application possibilities. Manufacturers are strategically prioritizing the development of silanes that offer superior adhesion, increased water repellency, and improved long-term durability. These advancements are largely driven by the escalating demand for high-performance materials across key sectors such as construction, electronics, and automotive manufacturing. Differentiating factors and unique selling propositions in the current landscape include silanes engineered for enhanced thermal stability, superior chemical resistance, and the development of more environmentally friendly and sustainable formulations.
Key Drivers, Barriers & Challenges in Silane Industry
Key Drivers:
- Growing demand from construction and automotive industries.
- Technological advancements leading to enhanced silane properties.
- Increasing awareness of silane's environmental benefits.
Key Challenges:
- Volatility in raw material prices.
- Stringent environmental regulations.
- Intense competition from substitute materials. The competitive landscape impacts market share, resulting in a price war that can affect profitability.
Emerging Opportunities in Silane Industry
- Untapped markets in developing economies.
- Innovative applications in renewable energy and healthcare.
- Growing demand for eco-friendly and sustainable silane solutions.
Growth Accelerators in the Silane Industry
Technological breakthroughs, strategic partnerships, and expansion into new markets will drive long-term growth. Research and development focusing on advanced silane formulations and applications will propel innovation. Strategic alliances with key industry players will accelerate market penetration and enhance market reach. Expansion into emerging markets will unlock significant growth opportunities.
Key Players Shaping the Silane Industry Market
- SIKA CORPORATION
- Merck KGaA
- BRB International (PETRONAS Chemical Group)
- GELEST INC
- Tzamal D-Chem Laboratories Ltd
- Momentive
- Genesee Polymers Corporation
- Dow
- Alfa Aesar (Thermo Fisher Scientific)
- Shin-Etsu Chemical Co Ltd
- Prochimia Surfaces
- United Chemical Technologies
- Wacker Chemie AG
- Evonik
Notable Milestones in Silane Industry Sector
- 2020: Launch of a new generation of high-performance silanes by SIKA CORPORATION.
- 2022: Merck KGaA acquires a smaller silane producer, expanding its product portfolio.
- 2023: Significant investments by Dow in expanding its silane production capacity. (Further milestones can be added here based on available data.)
In-Depth Silane Industry Market Outlook
The silane industry is robustly positioned for substantial future growth. This expansion will be propelled by a confluence of factors, including relentless innovation in product development, strategic diversification into emerging application areas, and consistently strong demand from core end-use sectors. The acceleration of market expansion will be further amplified by strategic collaborations between industry stakeholders and increased investments in dedicated research and development initiatives. A pronounced focus on sustainability and the development of eco-friendly solutions will undoubtedly shape the future trajectory and competitive landscape of the silane market. Overall, the market presents significant and promising opportunities for both established industry leaders and agile new entrants seeking to carve out a niche.
Silane Industry Segmentation
-
1. Type
- 1.1. Alkyl
- 1.2. Amino
- 1.3. Epoxy
- 1.4. Methacryloxy
- 1.5. Phenyl
- 1.6. Vinyl
- 1.7. Others
-
2. Application
- 2.1. Plastics, Rubber and Composites
- 2.2. Building & Construction
- 2.3. Paints & Coatings
- 2.4. Adhesives & Sealants
- 2.5. Mineral & Filler Treatment
- 2.6. Others (Semi-Conductors, Pharmaceutical, etc.,)
Silane Industry Segmentation By Geography
-
1. Asia Pacific
- 1.1. China
- 1.2. India
- 1.3. Japan
- 1.4. South Korea
- 1.5. Rest of Asia Pacific
-
2. North America
- 2.1. United States
- 2.2. Canada
- 2.3. Mexico
-
3. Europe
- 3.1. Germany
- 3.2. United Kingdom
- 3.3. Italy
- 3.4. France
- 3.5. Rest of Europe
-
4. South America
- 4.1. Brazil
- 4.2. Argentina
- 4.3. Rest of South America
-
5. Middle East and Africa
- 5.1. Saudi Arabia
- 5.2. South Africa
- 5.3. Rest of Middle East and Africa
Silane Industry Regional Market Share
Geographic Coverage of Silane Industry
Silane Industry REPORT HIGHLIGHTS
| Aspects | Details |
|---|---|
| Study Period | 2020-2034 |
| Base Year | 2025 |
| Estimated Year | 2026 |
| Forecast Period | 2026-2034 |
| Historical Period | 2020-2025 |
| Growth Rate | CAGR of 5.7% from 2020-2034 |
| Segmentation |
|
Table of Contents
- 1. Introduction
- 1.1. Research Scope
- 1.2. Market Segmentation
- 1.3. Research Objective
- 1.4. Definitions and Assumptions
- 2. Executive Summary
- 2.1. Market Snapshot
- 3. Market Dynamics
- 3.1. Market Drivers
- 3.2. Market Restrains
- 3.3. Market Trends
- 3.4. Market Opportunities
- 4. Market Factor Analysis
- 4.1. Porters Five Forces
- 4.1.1. Bargaining Power of Suppliers
- 4.1.2. Bargaining Power of Buyers
- 4.1.3. Threat of New Entrants
- 4.1.4. Threat of Substitutes
- 4.1.5. Competitive Rivalry
- 4.2. PESTEL analysis
- 4.3. BCG Analysis
- 4.3.1. Stars (High Growth, High Market Share)
- 4.3.2. Cash Cows (Low Growth, High Market Share)
- 4.3.3. Question Mark (High Growth, Low Market Share)
- 4.3.4. Dogs (Low Growth, Low Market Share)
- 4.4. Ansoff Matrix Analysis
- 4.5. Supply Chain Analysis
- 4.6. Regulatory Landscape
- 4.7. Current Market Potential and Opportunity Assessment (TAM–SAM–SOM Framework)
- 4.8. NRP Analyst Note
- 4.1. Porters Five Forces
- 5. Market Analysis, Insights and Forecast 2021-2033
- 5.1. Market Analysis, Insights and Forecast - by Type
- 5.1.1. Alkyl
- 5.1.2. Amino
- 5.1.3. Epoxy
- 5.1.4. Methacryloxy
- 5.1.5. Phenyl
- 5.1.6. Vinyl
- 5.1.7. Others
- 5.2. Market Analysis, Insights and Forecast - by Application
- 5.2.1. Plastics, Rubber and Composites
- 5.2.2. Building & Construction
- 5.2.3. Paints & Coatings
- 5.2.4. Adhesives & Sealants
- 5.2.5. Mineral & Filler Treatment
- 5.2.6. Others (Semi-Conductors, Pharmaceutical, etc.,)
- 5.3. Market Analysis, Insights and Forecast - by Region
- 5.3.1. Asia Pacific
- 5.3.2. North America
- 5.3.3. Europe
- 5.3.4. South America
- 5.3.5. Middle East and Africa
- 5.1. Market Analysis, Insights and Forecast - by Type
- 6. Global Silane Industry Analysis, Insights and Forecast, 2021-2033
- 6.1. Market Analysis, Insights and Forecast - by Type
- 6.1.1. Alkyl
- 6.1.2. Amino
- 6.1.3. Epoxy
- 6.1.4. Methacryloxy
- 6.1.5. Phenyl
- 6.1.6. Vinyl
- 6.1.7. Others
- 6.2. Market Analysis, Insights and Forecast - by Application
- 6.2.1. Plastics, Rubber and Composites
- 6.2.2. Building & Construction
- 6.2.3. Paints & Coatings
- 6.2.4. Adhesives & Sealants
- 6.2.5. Mineral & Filler Treatment
- 6.2.6. Others (Semi-Conductors, Pharmaceutical, etc.,)
- 6.1. Market Analysis, Insights and Forecast - by Type
- 7. Asia Pacific Silane Industry Analysis, Insights and Forecast, 2020-2032
- 7.1. Market Analysis, Insights and Forecast - by Type
- 7.1.1. Alkyl
- 7.1.2. Amino
- 7.1.3. Epoxy
- 7.1.4. Methacryloxy
- 7.1.5. Phenyl
- 7.1.6. Vinyl
- 7.1.7. Others
- 7.2. Market Analysis, Insights and Forecast - by Application
- 7.2.1. Plastics, Rubber and Composites
- 7.2.2. Building & Construction
- 7.2.3. Paints & Coatings
- 7.2.4. Adhesives & Sealants
- 7.2.5. Mineral & Filler Treatment
- 7.2.6. Others (Semi-Conductors, Pharmaceutical, etc.,)
- 7.1. Market Analysis, Insights and Forecast - by Type
- 8. North America Silane Industry Analysis, Insights and Forecast, 2020-2032
- 8.1. Market Analysis, Insights and Forecast - by Type
- 8.1.1. Alkyl
- 8.1.2. Amino
- 8.1.3. Epoxy
- 8.1.4. Methacryloxy
- 8.1.5. Phenyl
- 8.1.6. Vinyl
- 8.1.7. Others
- 8.2. Market Analysis, Insights and Forecast - by Application
- 8.2.1. Plastics, Rubber and Composites
- 8.2.2. Building & Construction
- 8.2.3. Paints & Coatings
- 8.2.4. Adhesives & Sealants
- 8.2.5. Mineral & Filler Treatment
- 8.2.6. Others (Semi-Conductors, Pharmaceutical, etc.,)
- 8.1. Market Analysis, Insights and Forecast - by Type
- 9. Europe Silane Industry Analysis, Insights and Forecast, 2020-2032
- 9.1. Market Analysis, Insights and Forecast - by Type
- 9.1.1. Alkyl
- 9.1.2. Amino
- 9.1.3. Epoxy
- 9.1.4. Methacryloxy
- 9.1.5. Phenyl
- 9.1.6. Vinyl
- 9.1.7. Others
- 9.2. Market Analysis, Insights and Forecast - by Application
- 9.2.1. Plastics, Rubber and Composites
- 9.2.2. Building & Construction
- 9.2.3. Paints & Coatings
- 9.2.4. Adhesives & Sealants
- 9.2.5. Mineral & Filler Treatment
- 9.2.6. Others (Semi-Conductors, Pharmaceutical, etc.,)
- 9.1. Market Analysis, Insights and Forecast - by Type
- 10. South America Silane Industry Analysis, Insights and Forecast, 2020-2032
- 10.1. Market Analysis, Insights and Forecast - by Type
- 10.1.1. Alkyl
- 10.1.2. Amino
- 10.1.3. Epoxy
- 10.1.4. Methacryloxy
- 10.1.5. Phenyl
- 10.1.6. Vinyl
- 10.1.7. Others
- 10.2. Market Analysis, Insights and Forecast - by Application
- 10.2.1. Plastics, Rubber and Composites
- 10.2.2. Building & Construction
- 10.2.3. Paints & Coatings
- 10.2.4. Adhesives & Sealants
- 10.2.5. Mineral & Filler Treatment
- 10.2.6. Others (Semi-Conductors, Pharmaceutical, etc.,)
- 10.1. Market Analysis, Insights and Forecast - by Type
- 11. Middle East and Africa Silane Industry Analysis, Insights and Forecast, 2020-2032
- 11.1. Market Analysis, Insights and Forecast - by Type
- 11.1.1. Alkyl
- 11.1.2. Amino
- 11.1.3. Epoxy
- 11.1.4. Methacryloxy
- 11.1.5. Phenyl
- 11.1.6. Vinyl
- 11.1.7. Others
- 11.2. Market Analysis, Insights and Forecast - by Application
- 11.2.1. Plastics, Rubber and Composites
- 11.2.2. Building & Construction
- 11.2.3. Paints & Coatings
- 11.2.4. Adhesives & Sealants
- 11.2.5. Mineral & Filler Treatment
- 11.2.6. Others (Semi-Conductors, Pharmaceutical, etc.,)
- 11.1. Market Analysis, Insights and Forecast - by Type
- 12. Competitive Analysis
- 12.1. Company Profiles
- 12.1.1 SIKA CORPORATION
- 12.1.1.1. Company Overview
- 12.1.1.2. Products
- 12.1.1.3. Company Financials
- 12.1.1.4. SWOT Analysis
- 12.1.2 Merck KGaA
- 12.1.2.1. Company Overview
- 12.1.2.2. Products
- 12.1.2.3. Company Financials
- 12.1.2.4. SWOT Analysis
- 12.1.3 BRB International (PETRONAS Chemical Group)
- 12.1.3.1. Company Overview
- 12.1.3.2. Products
- 12.1.3.3. Company Financials
- 12.1.3.4. SWOT Analysis
- 12.1.4 GELEST INC
- 12.1.4.1. Company Overview
- 12.1.4.2. Products
- 12.1.4.3. Company Financials
- 12.1.4.4. SWOT Analysis
- 12.1.5 Tzamal D-Chem Laboratories Ltd
- 12.1.5.1. Company Overview
- 12.1.5.2. Products
- 12.1.5.3. Company Financials
- 12.1.5.4. SWOT Analysis
- 12.1.6 Momentive
- 12.1.6.1. Company Overview
- 12.1.6.2. Products
- 12.1.6.3. Company Financials
- 12.1.6.4. SWOT Analysis
- 12.1.7 Genesee Polymers Corporation
- 12.1.7.1. Company Overview
- 12.1.7.2. Products
- 12.1.7.3. Company Financials
- 12.1.7.4. SWOT Analysis
- 12.1.8 Dow
- 12.1.8.1. Company Overview
- 12.1.8.2. Products
- 12.1.8.3. Company Financials
- 12.1.8.4. SWOT Analysis
- 12.1.9 Alfa Aesar (Thermo Fisher Scientific)
- 12.1.9.1. Company Overview
- 12.1.9.2. Products
- 12.1.9.3. Company Financials
- 12.1.9.4. SWOT Analysis
- 12.1.10 Shin-Etsu Chemical Co Ltd
- 12.1.10.1. Company Overview
- 12.1.10.2. Products
- 12.1.10.3. Company Financials
- 12.1.10.4. SWOT Analysis
- 12.1.11 Prochimia Surfaces
- 12.1.11.1. Company Overview
- 12.1.11.2. Products
- 12.1.11.3. Company Financials
- 12.1.11.4. SWOT Analysis
- 12.1.12 United Chemical Technologies
- 12.1.12.1. Company Overview
- 12.1.12.2. Products
- 12.1.12.3. Company Financials
- 12.1.12.4. SWOT Analysis
- 12.1.13 Wacker Chemie AG
- 12.1.13.1. Company Overview
- 12.1.13.2. Products
- 12.1.13.3. Company Financials
- 12.1.13.4. SWOT Analysis
- 12.1.14 Evonik
- 12.1.14.1. Company Overview
- 12.1.14.2. Products
- 12.1.14.3. Company Financials
- 12.1.14.4. SWOT Analysis
- 12.1.1 SIKA CORPORATION
- 12.2. Market Entropy
- 12.2.1 Company's Key Areas Served
- 12.2.2 Recent Developments
- 12.3. Company Market Share Analysis 2025
- 12.3.1 Top 5 Companies Market Share Analysis
- 12.3.2 Top 3 Companies Market Share Analysis
- 12.4. List of Potential Customers
- 13. Research Methodology
List of Figures
- Figure 1: Global Silane Industry Revenue Breakdown (Million, %) by Region 2025 & 2033
- Figure 2: Global Silane Industry Volume Breakdown (K Tons, %) by Region 2025 & 2033
- Figure 3: Asia Pacific Silane Industry Revenue (Million), by Type 2025 & 2033
- Figure 4: Asia Pacific Silane Industry Volume (K Tons), by Type 2025 & 2033
- Figure 5: Asia Pacific Silane Industry Revenue Share (%), by Type 2025 & 2033
- Figure 6: Asia Pacific Silane Industry Volume Share (%), by Type 2025 & 2033
- Figure 7: Asia Pacific Silane Industry Revenue (Million), by Application 2025 & 2033
- Figure 8: Asia Pacific Silane Industry Volume (K Tons), by Application 2025 & 2033
- Figure 9: Asia Pacific Silane Industry Revenue Share (%), by Application 2025 & 2033
- Figure 10: Asia Pacific Silane Industry Volume Share (%), by Application 2025 & 2033
- Figure 11: Asia Pacific Silane Industry Revenue (Million), by Country 2025 & 2033
- Figure 12: Asia Pacific Silane Industry Volume (K Tons), by Country 2025 & 2033
- Figure 13: Asia Pacific Silane Industry Revenue Share (%), by Country 2025 & 2033
- Figure 14: Asia Pacific Silane Industry Volume Share (%), by Country 2025 & 2033
- Figure 15: North America Silane Industry Revenue (Million), by Type 2025 & 2033
- Figure 16: North America Silane Industry Volume (K Tons), by Type 2025 & 2033
- Figure 17: North America Silane Industry Revenue Share (%), by Type 2025 & 2033
- Figure 18: North America Silane Industry Volume Share (%), by Type 2025 & 2033
- Figure 19: North America Silane Industry Revenue (Million), by Application 2025 & 2033
- Figure 20: North America Silane Industry Volume (K Tons), by Application 2025 & 2033
- Figure 21: North America Silane Industry Revenue Share (%), by Application 2025 & 2033
- Figure 22: North America Silane Industry Volume Share (%), by Application 2025 & 2033
- Figure 23: North America Silane Industry Revenue (Million), by Country 2025 & 2033
- Figure 24: North America Silane Industry Volume (K Tons), by Country 2025 & 2033
- Figure 25: North America Silane Industry Revenue Share (%), by Country 2025 & 2033
- Figure 26: North America Silane Industry Volume Share (%), by Country 2025 & 2033
- Figure 27: Europe Silane Industry Revenue (Million), by Type 2025 & 2033
- Figure 28: Europe Silane Industry Volume (K Tons), by Type 2025 & 2033
- Figure 29: Europe Silane Industry Revenue Share (%), by Type 2025 & 2033
- Figure 30: Europe Silane Industry Volume Share (%), by Type 2025 & 2033
- Figure 31: Europe Silane Industry Revenue (Million), by Application 2025 & 2033
- Figure 32: Europe Silane Industry Volume (K Tons), by Application 2025 & 2033
- Figure 33: Europe Silane Industry Revenue Share (%), by Application 2025 & 2033
- Figure 34: Europe Silane Industry Volume Share (%), by Application 2025 & 2033
- Figure 35: Europe Silane Industry Revenue (Million), by Country 2025 & 2033
- Figure 36: Europe Silane Industry Volume (K Tons), by Country 2025 & 2033
- Figure 37: Europe Silane Industry Revenue Share (%), by Country 2025 & 2033
- Figure 38: Europe Silane Industry Volume Share (%), by Country 2025 & 2033
- Figure 39: South America Silane Industry Revenue (Million), by Type 2025 & 2033
- Figure 40: South America Silane Industry Volume (K Tons), by Type 2025 & 2033
- Figure 41: South America Silane Industry Revenue Share (%), by Type 2025 & 2033
- Figure 42: South America Silane Industry Volume Share (%), by Type 2025 & 2033
- Figure 43: South America Silane Industry Revenue (Million), by Application 2025 & 2033
- Figure 44: South America Silane Industry Volume (K Tons), by Application 2025 & 2033
- Figure 45: South America Silane Industry Revenue Share (%), by Application 2025 & 2033
- Figure 46: South America Silane Industry Volume Share (%), by Application 2025 & 2033
- Figure 47: South America Silane Industry Revenue (Million), by Country 2025 & 2033
- Figure 48: South America Silane Industry Volume (K Tons), by Country 2025 & 2033
- Figure 49: South America Silane Industry Revenue Share (%), by Country 2025 & 2033
- Figure 50: South America Silane Industry Volume Share (%), by Country 2025 & 2033
- Figure 51: Middle East and Africa Silane Industry Revenue (Million), by Type 2025 & 2033
- Figure 52: Middle East and Africa Silane Industry Volume (K Tons), by Type 2025 & 2033
- Figure 53: Middle East and Africa Silane Industry Revenue Share (%), by Type 2025 & 2033
- Figure 54: Middle East and Africa Silane Industry Volume Share (%), by Type 2025 & 2033
- Figure 55: Middle East and Africa Silane Industry Revenue (Million), by Application 2025 & 2033
- Figure 56: Middle East and Africa Silane Industry Volume (K Tons), by Application 2025 & 2033
- Figure 57: Middle East and Africa Silane Industry Revenue Share (%), by Application 2025 & 2033
- Figure 58: Middle East and Africa Silane Industry Volume Share (%), by Application 2025 & 2033
- Figure 59: Middle East and Africa Silane Industry Revenue (Million), by Country 2025 & 2033
- Figure 60: Middle East and Africa Silane Industry Volume (K Tons), by Country 2025 & 2033
- Figure 61: Middle East and Africa Silane Industry Revenue Share (%), by Country 2025 & 2033
- Figure 62: Middle East and Africa Silane Industry Volume Share (%), by Country 2025 & 2033
List of Tables
- Table 1: Global Silane Industry Revenue Million Forecast, by Type 2020 & 2033
- Table 2: Global Silane Industry Volume K Tons Forecast, by Type 2020 & 2033
- Table 3: Global Silane Industry Revenue Million Forecast, by Application 2020 & 2033
- Table 4: Global Silane Industry Volume K Tons Forecast, by Application 2020 & 2033
- Table 5: Global Silane Industry Revenue Million Forecast, by Region 2020 & 2033
- Table 6: Global Silane Industry Volume K Tons Forecast, by Region 2020 & 2033
- Table 7: Global Silane Industry Revenue Million Forecast, by Type 2020 & 2033
- Table 8: Global Silane Industry Volume K Tons Forecast, by Type 2020 & 2033
- Table 9: Global Silane Industry Revenue Million Forecast, by Application 2020 & 2033
- Table 10: Global Silane Industry Volume K Tons Forecast, by Application 2020 & 2033
- Table 11: Global Silane Industry Revenue Million Forecast, by Country 2020 & 2033
- Table 12: Global Silane Industry Volume K Tons Forecast, by Country 2020 & 2033
- Table 13: China Silane Industry Revenue (Million) Forecast, by Application 2020 & 2033
- Table 14: China Silane Industry Volume (K Tons) Forecast, by Application 2020 & 2033
- Table 15: India Silane Industry Revenue (Million) Forecast, by Application 2020 & 2033
- Table 16: India Silane Industry Volume (K Tons) Forecast, by Application 2020 & 2033
- Table 17: Japan Silane Industry Revenue (Million) Forecast, by Application 2020 & 2033
- Table 18: Japan Silane Industry Volume (K Tons) Forecast, by Application 2020 & 2033
- Table 19: South Korea Silane Industry Revenue (Million) Forecast, by Application 2020 & 2033
- Table 20: South Korea Silane Industry Volume (K Tons) Forecast, by Application 2020 & 2033
- Table 21: Rest of Asia Pacific Silane Industry Revenue (Million) Forecast, by Application 2020 & 2033
- Table 22: Rest of Asia Pacific Silane Industry Volume (K Tons) Forecast, by Application 2020 & 2033
- Table 23: Global Silane Industry Revenue Million Forecast, by Type 2020 & 2033
- Table 24: Global Silane Industry Volume K Tons Forecast, by Type 2020 & 2033
- Table 25: Global Silane Industry Revenue Million Forecast, by Application 2020 & 2033
- Table 26: Global Silane Industry Volume K Tons Forecast, by Application 2020 & 2033
- Table 27: Global Silane Industry Revenue Million Forecast, by Country 2020 & 2033
- Table 28: Global Silane Industry Volume K Tons Forecast, by Country 2020 & 2033
- Table 29: United States Silane Industry Revenue (Million) Forecast, by Application 2020 & 2033
- Table 30: United States Silane Industry Volume (K Tons) Forecast, by Application 2020 & 2033
- Table 31: Canada Silane Industry Revenue (Million) Forecast, by Application 2020 & 2033
- Table 32: Canada Silane Industry Volume (K Tons) Forecast, by Application 2020 & 2033
- Table 33: Mexico Silane Industry Revenue (Million) Forecast, by Application 2020 & 2033
- Table 34: Mexico Silane Industry Volume (K Tons) Forecast, by Application 2020 & 2033
- Table 35: Global Silane Industry Revenue Million Forecast, by Type 2020 & 2033
- Table 36: Global Silane Industry Volume K Tons Forecast, by Type 2020 & 2033
- Table 37: Global Silane Industry Revenue Million Forecast, by Application 2020 & 2033
- Table 38: Global Silane Industry Volume K Tons Forecast, by Application 2020 & 2033
- Table 39: Global Silane Industry Revenue Million Forecast, by Country 2020 & 2033
- Table 40: Global Silane Industry Volume K Tons Forecast, by Country 2020 & 2033
- Table 41: Germany Silane Industry Revenue (Million) Forecast, by Application 2020 & 2033
- Table 42: Germany Silane Industry Volume (K Tons) Forecast, by Application 2020 & 2033
- Table 43: United Kingdom Silane Industry Revenue (Million) Forecast, by Application 2020 & 2033
- Table 44: United Kingdom Silane Industry Volume (K Tons) Forecast, by Application 2020 & 2033
- Table 45: Italy Silane Industry Revenue (Million) Forecast, by Application 2020 & 2033
- Table 46: Italy Silane Industry Volume (K Tons) Forecast, by Application 2020 & 2033
- Table 47: France Silane Industry Revenue (Million) Forecast, by Application 2020 & 2033
- Table 48: France Silane Industry Volume (K Tons) Forecast, by Application 2020 & 2033
- Table 49: Rest of Europe Silane Industry Revenue (Million) Forecast, by Application 2020 & 2033
- Table 50: Rest of Europe Silane Industry Volume (K Tons) Forecast, by Application 2020 & 2033
- Table 51: Global Silane Industry Revenue Million Forecast, by Type 2020 & 2033
- Table 52: Global Silane Industry Volume K Tons Forecast, by Type 2020 & 2033
- Table 53: Global Silane Industry Revenue Million Forecast, by Application 2020 & 2033
- Table 54: Global Silane Industry Volume K Tons Forecast, by Application 2020 & 2033
- Table 55: Global Silane Industry Revenue Million Forecast, by Country 2020 & 2033
- Table 56: Global Silane Industry Volume K Tons Forecast, by Country 2020 & 2033
- Table 57: Brazil Silane Industry Revenue (Million) Forecast, by Application 2020 & 2033
- Table 58: Brazil Silane Industry Volume (K Tons) Forecast, by Application 2020 & 2033
- Table 59: Argentina Silane Industry Revenue (Million) Forecast, by Application 2020 & 2033
- Table 60: Argentina Silane Industry Volume (K Tons) Forecast, by Application 2020 & 2033
- Table 61: Rest of South America Silane Industry Revenue (Million) Forecast, by Application 2020 & 2033
- Table 62: Rest of South America Silane Industry Volume (K Tons) Forecast, by Application 2020 & 2033
- Table 63: Global Silane Industry Revenue Million Forecast, by Type 2020 & 2033
- Table 64: Global Silane Industry Volume K Tons Forecast, by Type 2020 & 2033
- Table 65: Global Silane Industry Revenue Million Forecast, by Application 2020 & 2033
- Table 66: Global Silane Industry Volume K Tons Forecast, by Application 2020 & 2033
- Table 67: Global Silane Industry Revenue Million Forecast, by Country 2020 & 2033
- Table 68: Global Silane Industry Volume K Tons Forecast, by Country 2020 & 2033
- Table 69: Saudi Arabia Silane Industry Revenue (Million) Forecast, by Application 2020 & 2033
- Table 70: Saudi Arabia Silane Industry Volume (K Tons) Forecast, by Application 2020 & 2033
- Table 71: South Africa Silane Industry Revenue (Million) Forecast, by Application 2020 & 2033
- Table 72: South Africa Silane Industry Volume (K Tons) Forecast, by Application 2020 & 2033
- Table 73: Rest of Middle East and Africa Silane Industry Revenue (Million) Forecast, by Application 2020 & 2033
- Table 74: Rest of Middle East and Africa Silane Industry Volume (K Tons) Forecast, by Application 2020 & 2033
Frequently Asked Questions
1. What is the projected Compound Annual Growth Rate (CAGR) of the Silane Industry?
The projected CAGR is approximately 5.7%.
2. Which companies are prominent players in the Silane Industry?
Key companies in the market include SIKA CORPORATION, Merck KGaA, BRB International (PETRONAS Chemical Group), GELEST INC, Tzamal D-Chem Laboratories Ltd, Momentive, Genesee Polymers Corporation, Dow, Alfa Aesar (Thermo Fisher Scientific), Shin-Etsu Chemical Co Ltd, Prochimia Surfaces, United Chemical Technologies, Wacker Chemie AG, Evonik.
3. What are the main segments of the Silane Industry?
The market segments include Type, Application.
4. Can you provide details about the market size?
The market size is estimated to be USD 319.39 Million as of 2022.
5. What are some drivers contributing to market growth?
; Growing Demand form the Construction Industry; Growing Demand for Light-Weight Composites; Increasing Demand from Automotive Industry.
6. What are the notable trends driving market growth?
Growing Demand from the Construction Industry.
7. Are there any restraints impacting market growth?
; Higher Production Costs; Unfavorable Conditions Arising Due to the COVID-19 Outbreak.
8. Can you provide examples of recent developments in the market?
N/A
9. What pricing options are available for accessing the report?
Pricing options include single-user, multi-user, and enterprise licenses priced at USD 4750, USD 5250, and USD 8750 respectively.
10. Is the market size provided in terms of value or volume?
The market size is provided in terms of value, measured in Million and volume, measured in K Tons.
11. Are there any specific market keywords associated with the report?
Yes, the market keyword associated with the report is "Silane Industry," which aids in identifying and referencing the specific market segment covered.
12. How do I determine which pricing option suits my needs best?
The pricing options vary based on user requirements and access needs. Individual users may opt for single-user licenses, while businesses requiring broader access may choose multi-user or enterprise licenses for cost-effective access to the report.
13. Are there any additional resources or data provided in the Silane Industry report?
While the report offers comprehensive insights, it's advisable to review the specific contents or supplementary materials provided to ascertain if additional resources or data are available.
14. How can I stay updated on further developments or reports in the Silane Industry?
To stay informed about further developments, trends, and reports in the Silane Industry, consider subscribing to industry newsletters, following relevant companies and organizations, or regularly checking reputable industry news sources and publications.
Methodology
Step 1 - Identification of Relevant Samples Size from Population Database


Step 2 - Approaches for Defining Global Market Size (Value, Volume* & Price*)

Note*: In applicable scenarios
Step 3 - Data Sources
Primary Research
- Web Analytics
- Survey Reports
- Research Institute
- Latest Research Reports
- Opinion Leaders
Secondary Research
- Annual Reports
- White Paper
- Latest Press Release
- Industry Association
- Paid Database
- Investor Presentations

Step 4 - Data Triangulation
Involves using different sources of information in order to increase the validity of a study
These sources are likely to be stakeholders in a program - participants, other researchers, program staff, other community members, and so on.
Then we put all data in single framework & apply various statistical tools to find out the dynamic on the market.
During the analysis stage, feedback from the stakeholder groups would be compared to determine areas of agreement as well as areas of divergence