

Key Insights
The South American water treatment chemicals market is experiencing substantial growth, propelled by rapid industrialization, increasing urbanization, and more stringent environmental regulations. With a projected compound annual growth rate (CAGR) of 7.4%, the market is set to expand significantly from its current size of $2.9 billion in the base year 2024, extending through 2033. This upward trajectory is primarily driven by the escalating demand for safe and potable water, particularly in densely populated urban areas facing water scarcity. Additionally, the expanding mining, energy, and food & beverage sectors are significant contributors to chemical demand, necessitating advanced water treatment solutions. Key growth factors also include heightened awareness of waterborne diseases and the critical need for efficient wastewater management. The market is segmented by chemical type (coagulants, flocculants, disinfectants), application (municipal, industrial), and region (Brazil, Argentina, Chile). Prominent market players, including Nouryon, Ecolab, Solenis, Kemira, Solvay, Lonza, Kurita Water Industries Ltd, SNF, and Suez, are making strategic investments in research and development to enhance product efficacy and sustainability. However, economic volatility in some South American nations and potential infrastructure challenges in upgrading water treatment facilities may present market restraints.
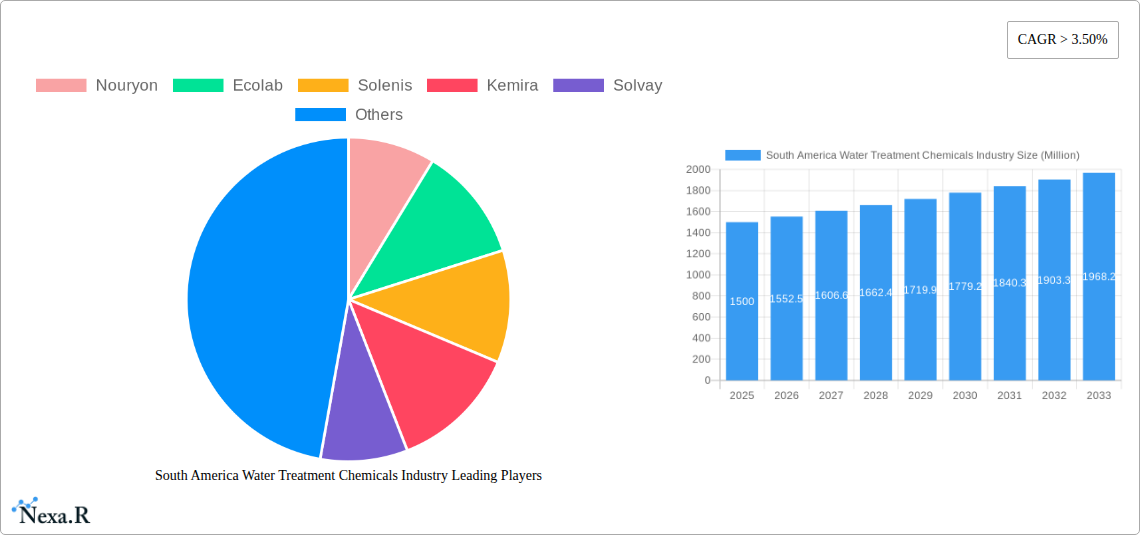
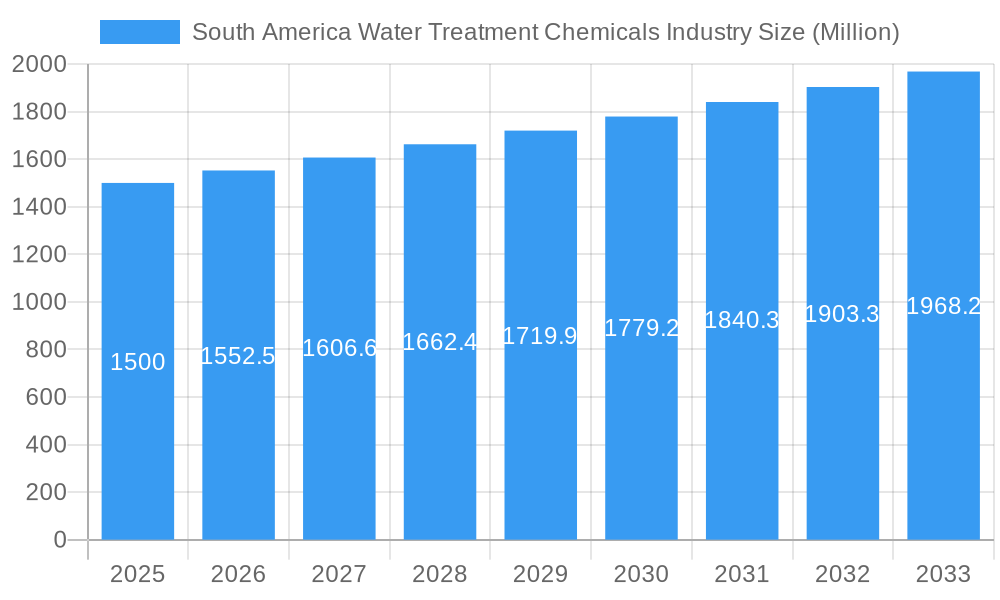
South America Water Treatment Chemicals Industry Market Size (In Billion)
The forecast period (2025-2033) predicts sustained market expansion, largely influenced by government initiatives promoting sustainable water management practices. These initiatives include investments in water infrastructure development and the adoption of advanced water treatment technologies. Furthermore, the increasing enforcement of stringent water quality standards is a key driver for market growth. The competitive landscape is marked by the presence of both multinational corporations and local enterprises. While global players leverage established brand recognition and technological prowess, local companies capitalize on cost efficiencies and localized market understanding. This dynamic market presents considerable opportunities for both established and emerging businesses within South America's expanding water treatment chemicals sector.
South America Water Treatment Chemicals Industry Company Market Share
South America Water Treatment Chemicals Industry Market Report: 2019-2033
This comprehensive report provides an in-depth analysis of the South America water treatment chemicals industry, offering invaluable insights for industry professionals, investors, and strategic planners. Covering the period 2019-2033, with a base year of 2025 and a forecast period of 2025-2033, this report unveils market dynamics, growth trends, and key players shaping this vital sector. The report analyzes parent markets like industrial water treatment and child markets like potable water treatment, providing a granular view of market segmentation. Market values are presented in million units.
South America Water Treatment Chemicals Industry Market Dynamics & Structure
This section analyzes the market's competitive landscape, technological advancements, regulatory influences, and market trends. The South American water treatment chemicals market exhibits a moderately concentrated structure, with key players holding significant market shares. However, the presence of numerous smaller, regional players fosters competition.
- Market Concentration: The top 5 players hold approximately xx% of the market share in 2025, while the remaining share is dispersed among numerous smaller companies.
- Technological Innovation: Advancements in membrane technology, automation, and digitalization are driving innovation, improving treatment efficiency and reducing operational costs. However, high upfront investment costs pose a barrier to entry for smaller players.
- Regulatory Framework: Stringent environmental regulations regarding water quality and discharge are driving demand for advanced treatment chemicals. Variability in regulations across different South American countries presents a challenge.
- Competitive Product Substitutes: Bio-based and sustainable alternatives to conventional water treatment chemicals are emerging, posing a competitive threat to established players.
- End-User Demographics: The primary end-users include municipalities, industrial sectors (mining, power generation, manufacturing), and agriculture. The growth of urban populations and industrialization fuels market expansion.
- M&A Trends: The industry witnessed xx M&A deals between 2019 and 2024, primarily driven by consolidation efforts and expansion into new markets. Larger companies are acquiring smaller specialized firms to enhance their product portfolio and geographic reach.
South America Water Treatment Chemicals Industry Growth Trends & Insights
The South American water treatment chemicals market experienced significant growth between 2019 and 2024, driven by factors such as increasing industrialization, urbanization, and stringent environmental regulations. The market size is estimated to be xx million in 2025 and is projected to grow at a CAGR of xx% during the forecast period (2025-2033), reaching xx million by 2033. This growth is propelled by rising demand for clean water in various sectors, adoption of advanced treatment technologies, and increasing investments in water infrastructure projects across the region. Shifting consumer behavior towards sustainable and environmentally friendly solutions also plays a significant role. Technological disruptions, such as the adoption of IoT-enabled monitoring systems and AI-driven optimization, are enhancing efficiency and driving market growth. Market penetration of advanced treatment technologies remains relatively low, presenting significant opportunities for future growth.
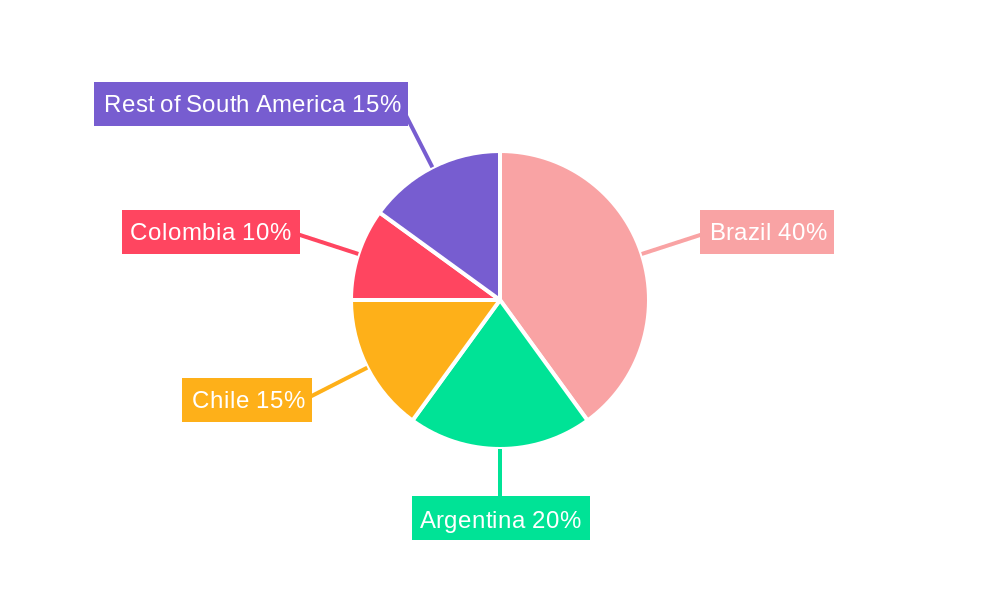
Dominant Regions, Countries, or Segments in South America Water Treatment Chemicals Industry
Brazil holds the largest market share in South America, driven by its robust industrial sector and significant investments in water infrastructure. Other key markets include Colombia, Argentina, and Chile.
- Key Drivers:
- Brazil: Strong economic growth, industrial development, and significant government investments in water infrastructure projects.
- Colombia: Expanding industrial sector, particularly mining and agriculture, increasing demand for water treatment solutions.
- Argentina: Growing urbanization and improvements in water management infrastructure.
- Chile: Emphasis on water conservation and efficient water management, driven by arid climatic conditions.
The industrial segment dominates the market, followed by the municipal and agricultural segments. Growth in the industrial segment is driven by the expanding manufacturing, mining, and power generation sectors. The municipal segment's growth is influenced by government initiatives focused on improving water quality and sanitation.
South America Water Treatment Chemicals Industry Product Landscape
The market offers a wide range of products, including coagulants, flocculants, disinfectants, scale inhibitors, corrosion inhibitors, and biocides. Recent product innovations focus on environmentally friendly and sustainable formulations, with enhanced performance characteristics. These innovations include bio-based chemicals, products with reduced toxicity, and those designed for improved efficiency and reduced sludge generation. Unique selling propositions include tailored solutions for specific water challenges and enhanced sustainability features.
Key Drivers, Barriers & Challenges in South America Water Treatment Chemicals Industry
Key Drivers:
- Increasing industrialization and urbanization
- Stringent environmental regulations
- Growing demand for clean water across sectors
- Investments in water infrastructure projects
Challenges & Restraints:
- Economic volatility in some South American countries can hinder investment in water infrastructure.
- Fluctuating raw material prices impacting production costs.
- Supply chain disruptions due to geopolitical factors.
- Competition from cheaper, lower-quality imported products.
Emerging Opportunities in South America Water Treatment Chemicals Industry
- Growing demand for sustainable and environmentally friendly solutions
- Increasing adoption of advanced treatment technologies
- Untapped potential in rural and underserved areas
- Expanding applications in agriculture and desalination
Growth Accelerators in the South America Water Treatment Chemicals Industry Industry
Technological advancements, such as the development of more efficient and sustainable water treatment chemicals, are major growth drivers. Strategic partnerships between chemical companies and water treatment service providers are accelerating market penetration. Expanding into new markets, particularly in underserved regions, presents significant growth potential.
Notable Milestones in South America Water Treatment Chemicals Industry Sector
- 2021: Launch of a new bio-based coagulant by Nouryon in Brazil.
- 2022: Acquisition of a regional water treatment company by Ecolab in Argentina.
- 2023: Implementation of new water quality regulations in Colombia.
- 2024: Solenis expands its manufacturing facility in Brazil to meet increasing demand.
In-Depth South America Water Treatment Chemicals Industry Market Outlook
The South American water treatment chemicals market is poised for robust growth over the forecast period, driven by several factors. Continued investments in water infrastructure, coupled with increasing demand for sustainable and efficient treatment solutions, will fuel market expansion. The emergence of innovative technologies and strategic partnerships will further accelerate this growth, presenting significant opportunities for both established players and new entrants. The market's future is bright, with substantial potential for long-term sustainable growth.
South America Water Treatment Chemicals Industry Segmentation
-
1. Product Type
- 1.1. Flocculant & Coagulants
- 1.2. Biocides & Disinfectants
- 1.3. Defoamers & Defoaming Agents
- 1.4. pH & Adjusters & Softeners
- 1.5. Scale & Corrosion Inhibitors
- 1.6. Others
-
2. End-user Industry
- 2.1. Power
- 2.2. Oil & Gas
- 2.3. Chemical Manufcaturing
- 2.4. Mining & Mineral Processing
- 2.5. Mining and Mineral Processing
- 2.6. Food & Beverage
- 2.7. Pulp & Ppaer
- 2.8. Others
-
3. Geography
- 3.1. Brazil
- 3.2. Argentina
- 3.3. Rest of South America
South America Water Treatment Chemicals Industry Segmentation By Geography
- 1. Brazil
- 2. Argentina
- 3. Rest of South America
South America Water Treatment Chemicals Industry Regional Market Share
Geographic Coverage of South America Water Treatment Chemicals Industry
South America Water Treatment Chemicals Industry REPORT HIGHLIGHTS
| Aspects | Details |
|---|---|
| Study Period | 2020-2034 |
| Base Year | 2025 |
| Estimated Year | 2026 |
| Forecast Period | 2026-2034 |
| Historical Period | 2020-2025 |
| Growth Rate | CAGR of 7.4% from 2020-2034 |
| Segmentation |
|
Table of Contents
- 1. Introduction
- 1.1. Research Scope
- 1.2. Market Segmentation
- 1.3. Research Objective
- 1.4. Definitions and Assumptions
- 2. Executive Summary
- 2.1. Market Snapshot
- 3. Market Dynamics
- 3.1. Market Drivers
- 3.2. Market Restrains
- 3.3. Market Trends
- 3.4. Market Opportunities
- 4. Market Factor Analysis
- 4.1. Porters Five Forces
- 4.1.1. Bargaining Power of Suppliers
- 4.1.2. Bargaining Power of Buyers
- 4.1.3. Threat of New Entrants
- 4.1.4. Threat of Substitutes
- 4.1.5. Competitive Rivalry
- 4.2. PESTEL analysis
- 4.3. BCG Analysis
- 4.3.1. Stars (High Growth, High Market Share)
- 4.3.2. Cash Cows (Low Growth, High Market Share)
- 4.3.3. Question Mark (High Growth, Low Market Share)
- 4.3.4. Dogs (Low Growth, Low Market Share)
- 4.4. Ansoff Matrix Analysis
- 4.5. Supply Chain Analysis
- 4.6. Regulatory Landscape
- 4.7. Current Market Potential and Opportunity Assessment (TAM–SAM–SOM Framework)
- 4.8. NRP Analyst Note
- 4.1. Porters Five Forces
- 5. Market Analysis, Insights and Forecast 2021-2033
- 5.1. Market Analysis, Insights and Forecast - by Product Type
- 5.1.1. Flocculant & Coagulants
- 5.1.2. Biocides & Disinfectants
- 5.1.3. Defoamers & Defoaming Agents
- 5.1.4. pH & Adjusters & Softeners
- 5.1.5. Scale & Corrosion Inhibitors
- 5.1.6. Others
- 5.2. Market Analysis, Insights and Forecast - by End-user Industry
- 5.2.1. Power
- 5.2.2. Oil & Gas
- 5.2.3. Chemical Manufcaturing
- 5.2.4. Mining & Mineral Processing
- 5.2.5. Mining and Mineral Processing
- 5.2.6. Food & Beverage
- 5.2.7. Pulp & Ppaer
- 5.2.8. Others
- 5.3. Market Analysis, Insights and Forecast - by Geography
- 5.3.1. Brazil
- 5.3.2. Argentina
- 5.3.3. Rest of South America
- 5.4. Market Analysis, Insights and Forecast - by Region
- 5.4.1. Brazil
- 5.4.2. Argentina
- 5.4.3. Rest of South America
- 5.1. Market Analysis, Insights and Forecast - by Product Type
- 6. Global South America Water Treatment Chemicals Industry Analysis, Insights and Forecast, 2021-2033
- 6.1. Market Analysis, Insights and Forecast - by Product Type
- 6.1.1. Flocculant & Coagulants
- 6.1.2. Biocides & Disinfectants
- 6.1.3. Defoamers & Defoaming Agents
- 6.1.4. pH & Adjusters & Softeners
- 6.1.5. Scale & Corrosion Inhibitors
- 6.1.6. Others
- 6.2. Market Analysis, Insights and Forecast - by End-user Industry
- 6.2.1. Power
- 6.2.2. Oil & Gas
- 6.2.3. Chemical Manufcaturing
- 6.2.4. Mining & Mineral Processing
- 6.2.5. Mining and Mineral Processing
- 6.2.6. Food & Beverage
- 6.2.7. Pulp & Ppaer
- 6.2.8. Others
- 6.3. Market Analysis, Insights and Forecast - by Geography
- 6.3.1. Brazil
- 6.3.2. Argentina
- 6.3.3. Rest of South America
- 6.1. Market Analysis, Insights and Forecast - by Product Type
- 7. Brazil South America Water Treatment Chemicals Industry Analysis, Insights and Forecast, 2020-2032
- 7.1. Market Analysis, Insights and Forecast - by Product Type
- 7.1.1. Flocculant & Coagulants
- 7.1.2. Biocides & Disinfectants
- 7.1.3. Defoamers & Defoaming Agents
- 7.1.4. pH & Adjusters & Softeners
- 7.1.5. Scale & Corrosion Inhibitors
- 7.1.6. Others
- 7.2. Market Analysis, Insights and Forecast - by End-user Industry
- 7.2.1. Power
- 7.2.2. Oil & Gas
- 7.2.3. Chemical Manufcaturing
- 7.2.4. Mining & Mineral Processing
- 7.2.5. Mining and Mineral Processing
- 7.2.6. Food & Beverage
- 7.2.7. Pulp & Ppaer
- 7.2.8. Others
- 7.3. Market Analysis, Insights and Forecast - by Geography
- 7.3.1. Brazil
- 7.3.2. Argentina
- 7.3.3. Rest of South America
- 7.1. Market Analysis, Insights and Forecast - by Product Type
- 8. Argentina South America Water Treatment Chemicals Industry Analysis, Insights and Forecast, 2020-2032
- 8.1. Market Analysis, Insights and Forecast - by Product Type
- 8.1.1. Flocculant & Coagulants
- 8.1.2. Biocides & Disinfectants
- 8.1.3. Defoamers & Defoaming Agents
- 8.1.4. pH & Adjusters & Softeners
- 8.1.5. Scale & Corrosion Inhibitors
- 8.1.6. Others
- 8.2. Market Analysis, Insights and Forecast - by End-user Industry
- 8.2.1. Power
- 8.2.2. Oil & Gas
- 8.2.3. Chemical Manufcaturing
- 8.2.4. Mining & Mineral Processing
- 8.2.5. Mining and Mineral Processing
- 8.2.6. Food & Beverage
- 8.2.7. Pulp & Ppaer
- 8.2.8. Others
- 8.3. Market Analysis, Insights and Forecast - by Geography
- 8.3.1. Brazil
- 8.3.2. Argentina
- 8.3.3. Rest of South America
- 8.1. Market Analysis, Insights and Forecast - by Product Type
- 9. Rest of South America South America Water Treatment Chemicals Industry Analysis, Insights and Forecast, 2020-2032
- 9.1. Market Analysis, Insights and Forecast - by Product Type
- 9.1.1. Flocculant & Coagulants
- 9.1.2. Biocides & Disinfectants
- 9.1.3. Defoamers & Defoaming Agents
- 9.1.4. pH & Adjusters & Softeners
- 9.1.5. Scale & Corrosion Inhibitors
- 9.1.6. Others
- 9.2. Market Analysis, Insights and Forecast - by End-user Industry
- 9.2.1. Power
- 9.2.2. Oil & Gas
- 9.2.3. Chemical Manufcaturing
- 9.2.4. Mining & Mineral Processing
- 9.2.5. Mining and Mineral Processing
- 9.2.6. Food & Beverage
- 9.2.7. Pulp & Ppaer
- 9.2.8. Others
- 9.3. Market Analysis, Insights and Forecast - by Geography
- 9.3.1. Brazil
- 9.3.2. Argentina
- 9.3.3. Rest of South America
- 9.1. Market Analysis, Insights and Forecast - by Product Type
- 10. Competitive Analysis
- 10.1. Company Profiles
- 10.1.1 Nouryon
- 10.1.1.1. Company Overview
- 10.1.1.2. Products
- 10.1.1.3. Company Financials
- 10.1.1.4. SWOT Analysis
- 10.1.2 Ecolab
- 10.1.2.1. Company Overview
- 10.1.2.2. Products
- 10.1.2.3. Company Financials
- 10.1.2.4. SWOT Analysis
- 10.1.3 Solenis
- 10.1.3.1. Company Overview
- 10.1.3.2. Products
- 10.1.3.3. Company Financials
- 10.1.3.4. SWOT Analysis
- 10.1.4 Kemira
- 10.1.4.1. Company Overview
- 10.1.4.2. Products
- 10.1.4.3. Company Financials
- 10.1.4.4. SWOT Analysis
- 10.1.5 Solvay
- 10.1.5.1. Company Overview
- 10.1.5.2. Products
- 10.1.5.3. Company Financials
- 10.1.5.4. SWOT Analysis
- 10.1.6 Lonza
- 10.1.6.1. Company Overview
- 10.1.6.2. Products
- 10.1.6.3. Company Financials
- 10.1.6.4. SWOT Analysis
- 10.1.7 Kurita Water industries Ltd
- 10.1.7.1. Company Overview
- 10.1.7.2. Products
- 10.1.7.3. Company Financials
- 10.1.7.4. SWOT Analysis
- 10.1.8 SNF
- 10.1.8.1. Company Overview
- 10.1.8.2. Products
- 10.1.8.3. Company Financials
- 10.1.8.4. SWOT Analysis
- 10.1.9 Suez*List Not Exhaustive
- 10.1.9.1. Company Overview
- 10.1.9.2. Products
- 10.1.9.3. Company Financials
- 10.1.9.4. SWOT Analysis
- 10.1.1 Nouryon
- 10.2. Market Entropy
- 10.2.1 Company's Key Areas Served
- 10.2.2 Recent Developments
- 10.3. Company Market Share Analysis 2025
- 10.3.1 Top 5 Companies Market Share Analysis
- 10.3.2 Top 3 Companies Market Share Analysis
- 10.4. List of Potential Customers
- 11. Research Methodology
List of Figures
- Figure 1: Global South America Water Treatment Chemicals Industry Revenue Breakdown (billion, %) by Region 2025 & 2033
- Figure 2: Brazil South America Water Treatment Chemicals Industry Revenue (billion), by Product Type 2025 & 2033
- Figure 3: Brazil South America Water Treatment Chemicals Industry Revenue Share (%), by Product Type 2025 & 2033
- Figure 4: Brazil South America Water Treatment Chemicals Industry Revenue (billion), by End-user Industry 2025 & 2033
- Figure 5: Brazil South America Water Treatment Chemicals Industry Revenue Share (%), by End-user Industry 2025 & 2033
- Figure 6: Brazil South America Water Treatment Chemicals Industry Revenue (billion), by Geography 2025 & 2033
- Figure 7: Brazil South America Water Treatment Chemicals Industry Revenue Share (%), by Geography 2025 & 2033
- Figure 8: Brazil South America Water Treatment Chemicals Industry Revenue (billion), by Country 2025 & 2033
- Figure 9: Brazil South America Water Treatment Chemicals Industry Revenue Share (%), by Country 2025 & 2033
- Figure 10: Argentina South America Water Treatment Chemicals Industry Revenue (billion), by Product Type 2025 & 2033
- Figure 11: Argentina South America Water Treatment Chemicals Industry Revenue Share (%), by Product Type 2025 & 2033
- Figure 12: Argentina South America Water Treatment Chemicals Industry Revenue (billion), by End-user Industry 2025 & 2033
- Figure 13: Argentina South America Water Treatment Chemicals Industry Revenue Share (%), by End-user Industry 2025 & 2033
- Figure 14: Argentina South America Water Treatment Chemicals Industry Revenue (billion), by Geography 2025 & 2033
- Figure 15: Argentina South America Water Treatment Chemicals Industry Revenue Share (%), by Geography 2025 & 2033
- Figure 16: Argentina South America Water Treatment Chemicals Industry Revenue (billion), by Country 2025 & 2033
- Figure 17: Argentina South America Water Treatment Chemicals Industry Revenue Share (%), by Country 2025 & 2033
- Figure 18: Rest of South America South America Water Treatment Chemicals Industry Revenue (billion), by Product Type 2025 & 2033
- Figure 19: Rest of South America South America Water Treatment Chemicals Industry Revenue Share (%), by Product Type 2025 & 2033
- Figure 20: Rest of South America South America Water Treatment Chemicals Industry Revenue (billion), by End-user Industry 2025 & 2033
- Figure 21: Rest of South America South America Water Treatment Chemicals Industry Revenue Share (%), by End-user Industry 2025 & 2033
- Figure 22: Rest of South America South America Water Treatment Chemicals Industry Revenue (billion), by Geography 2025 & 2033
- Figure 23: Rest of South America South America Water Treatment Chemicals Industry Revenue Share (%), by Geography 2025 & 2033
- Figure 24: Rest of South America South America Water Treatment Chemicals Industry Revenue (billion), by Country 2025 & 2033
- Figure 25: Rest of South America South America Water Treatment Chemicals Industry Revenue Share (%), by Country 2025 & 2033
List of Tables
- Table 1: Global South America Water Treatment Chemicals Industry Revenue billion Forecast, by Product Type 2020 & 2033
- Table 2: Global South America Water Treatment Chemicals Industry Revenue billion Forecast, by End-user Industry 2020 & 2033
- Table 3: Global South America Water Treatment Chemicals Industry Revenue billion Forecast, by Geography 2020 & 2033
- Table 4: Global South America Water Treatment Chemicals Industry Revenue billion Forecast, by Region 2020 & 2033
- Table 5: Global South America Water Treatment Chemicals Industry Revenue billion Forecast, by Product Type 2020 & 2033
- Table 6: Global South America Water Treatment Chemicals Industry Revenue billion Forecast, by End-user Industry 2020 & 2033
- Table 7: Global South America Water Treatment Chemicals Industry Revenue billion Forecast, by Geography 2020 & 2033
- Table 8: Global South America Water Treatment Chemicals Industry Revenue billion Forecast, by Country 2020 & 2033
- Table 9: Global South America Water Treatment Chemicals Industry Revenue billion Forecast, by Product Type 2020 & 2033
- Table 10: Global South America Water Treatment Chemicals Industry Revenue billion Forecast, by End-user Industry 2020 & 2033
- Table 11: Global South America Water Treatment Chemicals Industry Revenue billion Forecast, by Geography 2020 & 2033
- Table 12: Global South America Water Treatment Chemicals Industry Revenue billion Forecast, by Country 2020 & 2033
- Table 13: Global South America Water Treatment Chemicals Industry Revenue billion Forecast, by Product Type 2020 & 2033
- Table 14: Global South America Water Treatment Chemicals Industry Revenue billion Forecast, by End-user Industry 2020 & 2033
- Table 15: Global South America Water Treatment Chemicals Industry Revenue billion Forecast, by Geography 2020 & 2033
- Table 16: Global South America Water Treatment Chemicals Industry Revenue billion Forecast, by Country 2020 & 2033
Frequently Asked Questions
1. What is the projected Compound Annual Growth Rate (CAGR) of the South America Water Treatment Chemicals Industry?
The projected CAGR is approximately 7.4%.
2. Which companies are prominent players in the South America Water Treatment Chemicals Industry?
Key companies in the market include Nouryon, Ecolab, Solenis, Kemira, Solvay, Lonza, Kurita Water industries Ltd, SNF, Suez*List Not Exhaustive.
3. What are the main segments of the South America Water Treatment Chemicals Industry?
The market segments include Product Type, End-user Industry, Geography.
4. Can you provide details about the market size?
The market size is estimated to be USD 2.9 billion as of 2022.
5. What are some drivers contributing to market growth?
; Conformance to Stringent Environmental Regulations; Other Drivers.
6. What are the notable trends driving market growth?
Oil & Gas Industry to Dominate the Market.
7. Are there any restraints impacting market growth?
; Conformance to Stringent Environmental Regulations; Other Drivers.
8. Can you provide examples of recent developments in the market?
N/A
9. What pricing options are available for accessing the report?
Pricing options include single-user, multi-user, and enterprise licenses priced at USD 4750, USD 5250, and USD 8750 respectively.
10. Is the market size provided in terms of value or volume?
The market size is provided in terms of value, measured in billion.
11. Are there any specific market keywords associated with the report?
Yes, the market keyword associated with the report is "South America Water Treatment Chemicals Industry," which aids in identifying and referencing the specific market segment covered.
12. How do I determine which pricing option suits my needs best?
The pricing options vary based on user requirements and access needs. Individual users may opt for single-user licenses, while businesses requiring broader access may choose multi-user or enterprise licenses for cost-effective access to the report.
13. Are there any additional resources or data provided in the South America Water Treatment Chemicals Industry report?
While the report offers comprehensive insights, it's advisable to review the specific contents or supplementary materials provided to ascertain if additional resources or data are available.
14. How can I stay updated on further developments or reports in the South America Water Treatment Chemicals Industry?
To stay informed about further developments, trends, and reports in the South America Water Treatment Chemicals Industry, consider subscribing to industry newsletters, following relevant companies and organizations, or regularly checking reputable industry news sources and publications.
Methodology
Step 1 - Identification of Relevant Samples Size from Population Database


Step 2 - Approaches for Defining Global Market Size (Value, Volume* & Price*)

Note*: In applicable scenarios
Step 3 - Data Sources
Primary Research
- Web Analytics
- Survey Reports
- Research Institute
- Latest Research Reports
- Opinion Leaders
Secondary Research
- Annual Reports
- White Paper
- Latest Press Release
- Industry Association
- Paid Database
- Investor Presentations

Step 4 - Data Triangulation
Involves using different sources of information in order to increase the validity of a study
These sources are likely to be stakeholders in a program - participants, other researchers, program staff, other community members, and so on.
Then we put all data in single framework & apply various statistical tools to find out the dynamic on the market.
During the analysis stage, feedback from the stakeholder groups would be compared to determine areas of agreement as well as areas of divergence