

Key Insights
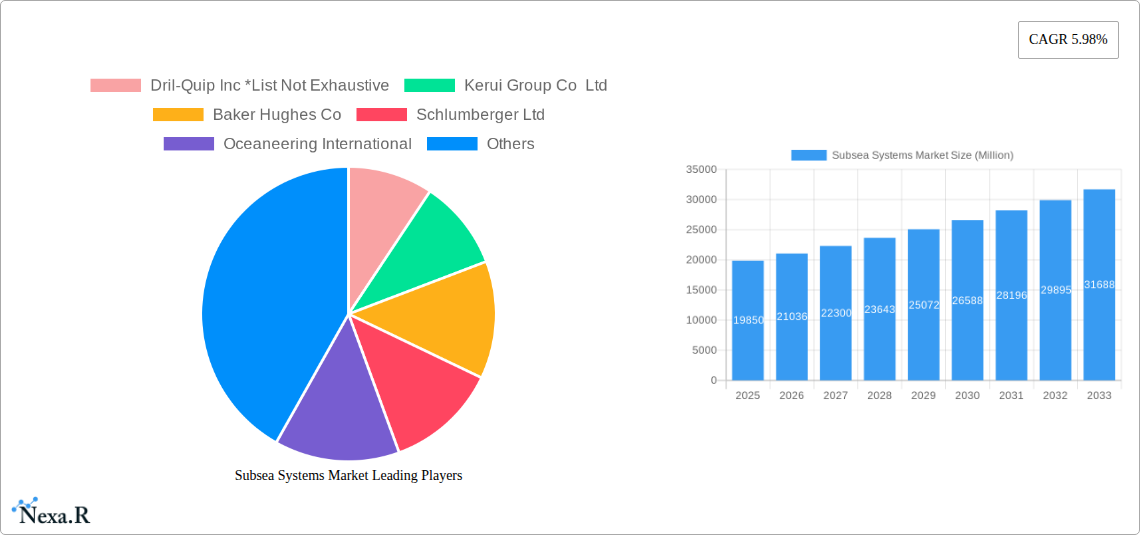
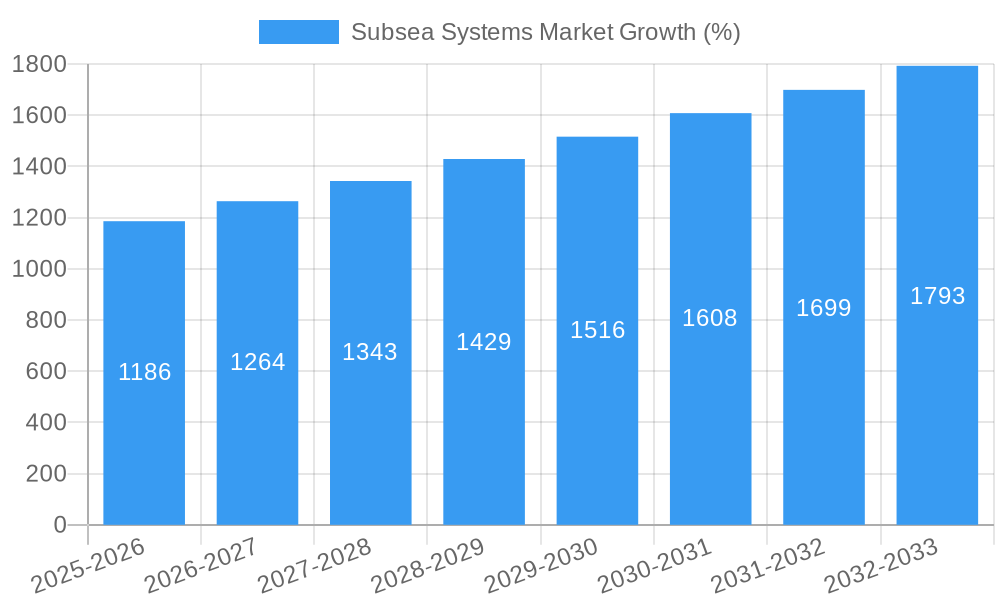
The subsea systems market, valued at $19.85 billion in 2025, is projected to experience robust growth, driven by the increasing demand for offshore oil and gas exploration and production. A compound annual growth rate (CAGR) of 5.98% from 2025 to 2033 indicates a significant expansion, reaching an estimated value exceeding $35 billion by 2033. This growth is fueled by several key factors: the ongoing exploration of deepwater reserves, technological advancements leading to more efficient and cost-effective subsea systems, and the increasing focus on maximizing recovery rates from existing fields. The Subsea Umbical Riser and Flowlines (SURF) segment currently dominates the market due to its crucial role in connecting subsea wells to surface facilities. However, significant growth is expected across all segments, including subsea processing systems and various components like trees, wellheads, and manifolds, driven by the need for enhanced production capabilities and reduced environmental impact. Major players such as Schlumberger, Baker Hughes, Subsea 7, and TechnipFMC are actively investing in research and development to improve system reliability, functionality, and operational efficiency. The Asia-Pacific region, particularly China and Southeast Asia, is anticipated to be a key driver of growth, fuelled by significant offshore energy investments and infrastructure development. Despite these positive trends, challenges such as high installation and maintenance costs, complex regulatory environments, and the increasing focus on renewable energy sources pose potential restraints on market expansion.
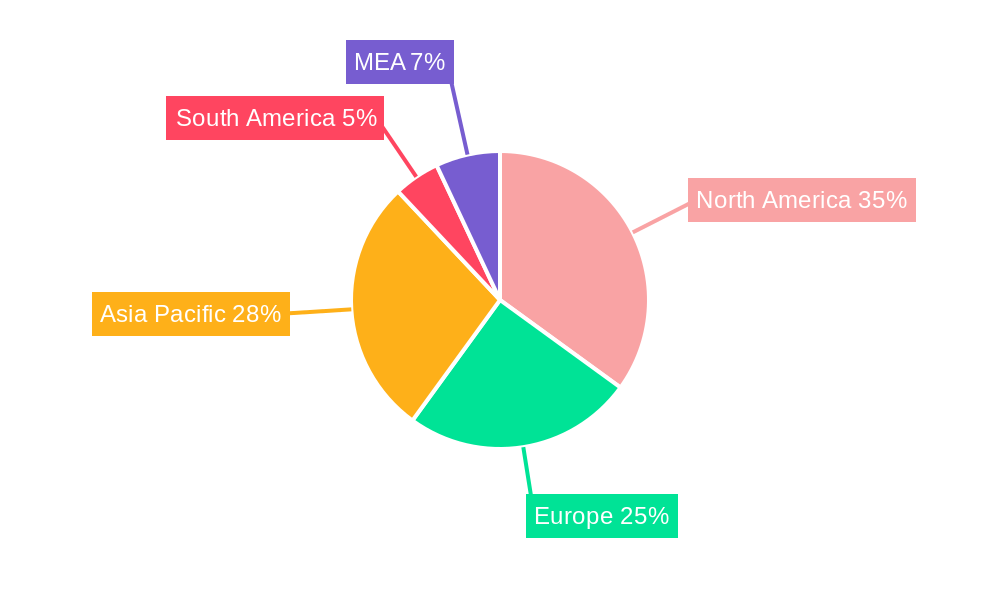
The geographic distribution of the subsea systems market reflects global energy demands. North America currently holds a substantial market share due to established offshore infrastructure and ongoing exploration activities. However, the Asia-Pacific region is poised for significant growth in the coming years, driven by increasing energy demand and substantial investments in offshore energy infrastructure. Europe and the Middle East and Africa regions also contribute significantly to the overall market, albeit at a slower growth rate compared to the Asia-Pacific region. The market segmentation by component reveals a diverse landscape, with SURF systems leading the charge due to their vital role in subsea operations. However, advancements in subsea processing systems and other components are creating new opportunities and driving market diversification. Competitive dynamics among major players are intense, with companies focusing on innovation, strategic partnerships, and geographical expansion to strengthen their market positions.
Subsea Systems Market: A Comprehensive Report (2019-2033)
This in-depth report provides a comprehensive analysis of the Subsea Systems market, encompassing market dynamics, growth trends, regional dominance, product landscape, key challenges and opportunities, and a detailed look at key players. The study period covers 2019-2033, with a base year of 2025 and a forecast period of 2025-2033. The market size is presented in Million units.
Subsea Systems Market Dynamics & Structure
The subsea systems market, encompassing parent markets like offshore oil & gas and renewable energy, and child markets such as Subsea Production Systems and Subsea Processing Systems, is characterized by a moderately concentrated structure. Key players like Schlumberger Ltd, Baker Hughes Co, and Subsea 7 SA hold significant market share, but smaller specialized companies are also contributing to innovation. The market is driven by technological advancements in areas such as automation, robotics, and digitalization, enabling more efficient and safer subsea operations. Stringent regulatory frameworks concerning environmental protection and operational safety influence market dynamics significantly. Competition from alternative energy sources and the increasing adoption of renewable energy are shaping the market's future. Mergers and acquisitions (M&A) activity is relatively frequent, with larger companies strategically acquiring smaller firms to enhance their technological capabilities and expand their market reach.
- Market Concentration: Moderately concentrated, with top 5 players holding approximately xx% market share in 2024.
- Technological Innovation: Focus on automation, robotics, and digitalization driving efficiency and safety improvements.
- Regulatory Frameworks: Stringent environmental and safety regulations impacting operational costs and technology adoption.
- Competitive Product Substitutes: Renewable energy sources posing a long-term challenge, particularly for traditional oil and gas subsea systems.
- End-User Demographics: Predominantly large multinational oil and gas companies, but increasing involvement of smaller exploration firms and renewable energy developers.
- M&A Trends: Significant M&A activity observed in the historical period (2019-2024), with an average of xx deals per year.
Subsea Systems Market Growth Trends & Insights
The Subsea Systems market experienced a Compound Annual Growth Rate (CAGR) of xx% during the historical period (2019-2024), driven primarily by increasing offshore oil and gas exploration and production activities, and a growing need for efficient subsea infrastructure. Technological advancements are playing a pivotal role, enabling deeper water operations and improved recovery rates. Market penetration of advanced subsea technologies is steadily increasing, with a focus on improved safety and automation. However, fluctuations in oil prices and geopolitical instability can impact growth. The forecast period (2025-2033) anticipates a CAGR of xx%, driven by increased investments in offshore wind energy and continued advancements in subsea technologies. Market adoption rates are expected to accelerate due to technological maturity and rising demand for energy security. Consumer behavior shows a preference for sustainable and efficient solutions, leading to increased adoption of subsea technologies that minimize environmental impact.
Dominant Regions, Countries, or Segments in Subsea Systems Market
The North Sea region remains a dominant market for subsea systems, driven by significant offshore oil and gas exploration and production activities. Other key regions include the Gulf of Mexico, Brazil, and West Africa. Within the component segment, Subsea Umbilical Riser and Flowlines (SURF) and Trees account for the largest market share, reflecting the fundamental nature of these components in subsea operations. Subsea Production Systems represent a significant portion of the total market, with increasing demand driven by the expansion of offshore oil and gas infrastructure.
- Key Drivers:
- North Sea: High levels of offshore oil & gas activity, coupled with robust government support for the energy sector.
- Gulf of Mexico: Mature oil and gas fields requiring upgrades and maintenance, plus new deepwater exploration projects.
- Brazil: Significant investments in pre-salt oil and gas reserves.
- West Africa: Growing exploration and production activities, attracting significant foreign investment.
- Dominance Factors:
- Existing Infrastructure: Established infrastructure in regions like the North Sea and Gulf of Mexico supports continuous growth.
- Government Policies: Supportive government regulations and financial incentives encourage investment in subsea infrastructure.
- Technological Advancements: Ongoing innovation in subsea technologies enables more efficient operations in challenging environments.
Subsea Systems Market Product Landscape
The subsea systems market showcases a range of products, including subsea production systems, processing systems, and associated components like SURF, trees, manifolds, and wellheads. Continuous innovation focuses on enhanced reliability, reduced operational costs, and improved safety. Recent advancements include increased automation, remote operations capabilities, and the integration of advanced sensors and data analytics. Unique selling propositions involve improved efficiency, reduced environmental impact, and increased safety, reflecting market demand for sustainable and reliable solutions.
Key Drivers, Barriers & Challenges in Subsea Systems Market
Key Drivers: Increased offshore oil and gas exploration and production, growing demand for renewable energy infrastructure (especially offshore wind), technological advancements, and supportive government policies in key regions. Specific examples include the increasing depth of offshore operations and the drive toward improved safety standards.
Key Challenges: High initial investment costs, volatile oil and gas prices impacting project feasibility, stringent regulatory requirements increasing compliance burdens, and complex supply chains susceptible to disruptions. These challenges can lead to project delays and increased operational costs, impacting market growth.
Emerging Opportunities in Subsea Systems Market
Emerging opportunities include the expansion into renewable energy sectors (offshore wind, wave, and tidal), the development of advanced subsea robotics and automation, and the integration of AI and machine learning for improved decision-making and predictive maintenance. Untapped markets in emerging economies with significant offshore resources also present significant growth potential.
Growth Accelerators in the Subsea Systems Market Industry
Technological breakthroughs, especially in areas like subsea robotics and AI-driven predictive maintenance, are critical growth accelerators. Strategic partnerships between technology providers and energy companies facilitate knowledge transfer and speed up innovation. Market expansion strategies focusing on emerging markets and renewable energy sectors are vital for long-term growth.
Key Players Shaping the Subsea Systems Market Market
- Dril-Quip Inc
- Kerui Group Co Ltd
- Baker Hughes Co
- Schlumberger Ltd
- Oceaneering International
- Akastor ASA
- Halliburton Co
- Subsea 7 SA
- National-Oilwell Varco Inc
- TechnipFMC PLC
Notable Milestones in Subsea Systems Market Sector
- February 2023: Equinor's new oil and gas discovery in the North Sea highlights the continued demand for subsea technologies in mature and proven fields.
- February 2022: The partnership between Innova and Teledyne Energy System showcasing hydrogen power for subsea control systems demonstrates the industry’s shift toward sustainable energy solutions.
- March 2022: BP's successful bid for exploration blocks in Indonesia indicates growing global interest in offshore energy exploration and the demand for associated subsea systems.
In-Depth Subsea Systems Market Market Outlook
The subsea systems market is poised for sustained growth, driven by the ongoing need for efficient and reliable subsea infrastructure in the oil and gas sector and the emerging renewable energy sector. Strategic investments in research and development, coupled with strategic partnerships and market expansions, will unlock significant future market potential. The continued focus on automation, digitalization, and sustainability presents numerous opportunities for innovation and market leadership.
Subsea Systems Market Segmentation
-
1. Type
- 1.1. Subsea Production Systems
- 1.2. Subsea Processing Systems
-
2. Component
- 2.1. Subsea Umbical Riser and Flowlines (SURF)
- 2.2. Trees
- 2.3. Wellhead
- 2.4. Manifolds
- 2.5. Other Components
Subsea Systems Market Segmentation By Geography
-
1. North America
- 1.1. Canada
- 1.2. Mexico
- 1.3. United States of America
- 1.4. Rest of the North America
-
2. Europe
- 2.1. Norway
- 2.2. United Kingdom
- 2.3. France
- 2.4. Italy
-
3. Asia Pacific
- 3.1. China
- 3.2. India
- 3.3. Japan
- 3.4. Rest of the Asia Pacific
-
4. South America
- 4.1. Brazil
- 4.2. Argentina
- 4.3. Rest of the South America
-
5. Middle East and Africa
- 5.1. United Arab Emirates
- 5.2. Saudi Arabia
- 5.3. Iran
- 5.4. Iraq
- 5.5. Rest of the Middle East and Africa
Subsea Systems Market REPORT HIGHLIGHTS
| Aspects | Details |
|---|---|
| Study Period | 2019-2033 |
| Base Year | 2024 |
| Estimated Year | 2025 |
| Forecast Period | 2025-2033 |
| Historical Period | 2019-2024 |
| Growth Rate | CAGR of 5.98% from 2019-2033 |
| Segmentation |
|
Table of Contents
- 1. Introduction
- 1.1. Research Scope
- 1.2. Market Segmentation
- 1.3. Research Methodology
- 1.4. Definitions and Assumptions
- 2. Executive Summary
- 2.1. Introduction
- 3. Market Dynamics
- 3.1. Introduction
- 3.2. Market Drivers
- 3.2.1 4.; Improved Viability Of Offshore Oil And Gas Projects4.; Rising Deep Water Oil & Gas Exploration And Production Activities In The Americas
- 3.2.2 Asia-pacific
- 3.2.3 And Middle-east & Africa Region
- 3.3. Market Restrains
- 3.3.1. 4.; Ban On Offshore Exploration And Production Activities In Multiple Regions
- 3.4. Market Trends
- 3.4.1. Subsea Production Segment to Dominate the Market
- 4. Market Factor Analysis
- 4.1. Porters Five Forces
- 4.2. Supply/Value Chain
- 4.3. PESTEL analysis
- 4.4. Market Entropy
- 4.5. Patent/Trademark Analysis
- 5. Global Subsea Systems Market Analysis, Insights and Forecast, 2019-2031
- 5.1. Market Analysis, Insights and Forecast - by Type
- 5.1.1. Subsea Production Systems
- 5.1.2. Subsea Processing Systems
- 5.2. Market Analysis, Insights and Forecast - by Component
- 5.2.1. Subsea Umbical Riser and Flowlines (SURF)
- 5.2.2. Trees
- 5.2.3. Wellhead
- 5.2.4. Manifolds
- 5.2.5. Other Components
- 5.3. Market Analysis, Insights and Forecast - by Region
- 5.3.1. North America
- 5.3.2. Europe
- 5.3.3. Asia Pacific
- 5.3.4. South America
- 5.3.5. Middle East and Africa
- 5.1. Market Analysis, Insights and Forecast - by Type
- 6. North America Subsea Systems Market Analysis, Insights and Forecast, 2019-2031
- 6.1. Market Analysis, Insights and Forecast - by Type
- 6.1.1. Subsea Production Systems
- 6.1.2. Subsea Processing Systems
- 6.2. Market Analysis, Insights and Forecast - by Component
- 6.2.1. Subsea Umbical Riser and Flowlines (SURF)
- 6.2.2. Trees
- 6.2.3. Wellhead
- 6.2.4. Manifolds
- 6.2.5. Other Components
- 6.1. Market Analysis, Insights and Forecast - by Type
- 7. Europe Subsea Systems Market Analysis, Insights and Forecast, 2019-2031
- 7.1. Market Analysis, Insights and Forecast - by Type
- 7.1.1. Subsea Production Systems
- 7.1.2. Subsea Processing Systems
- 7.2. Market Analysis, Insights and Forecast - by Component
- 7.2.1. Subsea Umbical Riser and Flowlines (SURF)
- 7.2.2. Trees
- 7.2.3. Wellhead
- 7.2.4. Manifolds
- 7.2.5. Other Components
- 7.1. Market Analysis, Insights and Forecast - by Type
- 8. Asia Pacific Subsea Systems Market Analysis, Insights and Forecast, 2019-2031
- 8.1. Market Analysis, Insights and Forecast - by Type
- 8.1.1. Subsea Production Systems
- 8.1.2. Subsea Processing Systems
- 8.2. Market Analysis, Insights and Forecast - by Component
- 8.2.1. Subsea Umbical Riser and Flowlines (SURF)
- 8.2.2. Trees
- 8.2.3. Wellhead
- 8.2.4. Manifolds
- 8.2.5. Other Components
- 8.1. Market Analysis, Insights and Forecast - by Type
- 9. South America Subsea Systems Market Analysis, Insights and Forecast, 2019-2031
- 9.1. Market Analysis, Insights and Forecast - by Type
- 9.1.1. Subsea Production Systems
- 9.1.2. Subsea Processing Systems
- 9.2. Market Analysis, Insights and Forecast - by Component
- 9.2.1. Subsea Umbical Riser and Flowlines (SURF)
- 9.2.2. Trees
- 9.2.3. Wellhead
- 9.2.4. Manifolds
- 9.2.5. Other Components
- 9.1. Market Analysis, Insights and Forecast - by Type
- 10. Middle East and Africa Subsea Systems Market Analysis, Insights and Forecast, 2019-2031
- 10.1. Market Analysis, Insights and Forecast - by Type
- 10.1.1. Subsea Production Systems
- 10.1.2. Subsea Processing Systems
- 10.2. Market Analysis, Insights and Forecast - by Component
- 10.2.1. Subsea Umbical Riser and Flowlines (SURF)
- 10.2.2. Trees
- 10.2.3. Wellhead
- 10.2.4. Manifolds
- 10.2.5. Other Components
- 10.1. Market Analysis, Insights and Forecast - by Type
- 11. North America Subsea Systems Market Analysis, Insights and Forecast, 2019-2031
- 11.1. Market Analysis, Insights and Forecast - By Country/Sub-region
- 11.1.1 United States
- 11.1.2 Canada
- 11.1.3 Mexico
- 12. Europe Subsea Systems Market Analysis, Insights and Forecast, 2019-2031
- 12.1. Market Analysis, Insights and Forecast - By Country/Sub-region
- 12.1.1 Germany
- 12.1.2 United Kingdom
- 12.1.3 France
- 12.1.4 Spain
- 12.1.5 Italy
- 12.1.6 Spain
- 12.1.7 Belgium
- 12.1.8 Netherland
- 12.1.9 Nordics
- 12.1.10 Rest of Europe
- 13. Asia Pacific Subsea Systems Market Analysis, Insights and Forecast, 2019-2031
- 13.1. Market Analysis, Insights and Forecast - By Country/Sub-region
- 13.1.1 China
- 13.1.2 Japan
- 13.1.3 India
- 13.1.4 South Korea
- 13.1.5 Southeast Asia
- 13.1.6 Australia
- 13.1.7 Indonesia
- 13.1.8 Phillipes
- 13.1.9 Singapore
- 13.1.10 Thailandc
- 13.1.11 Rest of Asia Pacific
- 14. South America Subsea Systems Market Analysis, Insights and Forecast, 2019-2031
- 14.1. Market Analysis, Insights and Forecast - By Country/Sub-region
- 14.1.1 Brazil
- 14.1.2 Argentina
- 14.1.3 Peru
- 14.1.4 Chile
- 14.1.5 Colombia
- 14.1.6 Ecuador
- 14.1.7 Venezuela
- 14.1.8 Rest of South America
- 15. North America Subsea Systems Market Analysis, Insights and Forecast, 2019-2031
- 15.1. Market Analysis, Insights and Forecast - By Country/Sub-region
- 15.1.1 United States
- 15.1.2 Canada
- 15.1.3 Mexico
- 16. MEA Subsea Systems Market Analysis, Insights and Forecast, 2019-2031
- 16.1. Market Analysis, Insights and Forecast - By Country/Sub-region
- 16.1.1 United Arab Emirates
- 16.1.2 Saudi Arabia
- 16.1.3 South Africa
- 16.1.4 Rest of Middle East and Africa
- 17. Competitive Analysis
- 17.1. Global Market Share Analysis 2024
- 17.2. Company Profiles
- 17.2.1 Dril-Quip Inc *List Not Exhaustive
- 17.2.1.1. Overview
- 17.2.1.2. Products
- 17.2.1.3. SWOT Analysis
- 17.2.1.4. Recent Developments
- 17.2.1.5. Financials (Based on Availability)
- 17.2.2 Kerui Group Co Ltd
- 17.2.2.1. Overview
- 17.2.2.2. Products
- 17.2.2.3. SWOT Analysis
- 17.2.2.4. Recent Developments
- 17.2.2.5. Financials (Based on Availability)
- 17.2.3 Baker Hughes Co
- 17.2.3.1. Overview
- 17.2.3.2. Products
- 17.2.3.3. SWOT Analysis
- 17.2.3.4. Recent Developments
- 17.2.3.5. Financials (Based on Availability)
- 17.2.4 Schlumberger Ltd
- 17.2.4.1. Overview
- 17.2.4.2. Products
- 17.2.4.3. SWOT Analysis
- 17.2.4.4. Recent Developments
- 17.2.4.5. Financials (Based on Availability)
- 17.2.5 Oceaneering International
- 17.2.5.1. Overview
- 17.2.5.2. Products
- 17.2.5.3. SWOT Analysis
- 17.2.5.4. Recent Developments
- 17.2.5.5. Financials (Based on Availability)
- 17.2.6 Akastor ASA
- 17.2.6.1. Overview
- 17.2.6.2. Products
- 17.2.6.3. SWOT Analysis
- 17.2.6.4. Recent Developments
- 17.2.6.5. Financials (Based on Availability)
- 17.2.7 Halliburton Co
- 17.2.7.1. Overview
- 17.2.7.2. Products
- 17.2.7.3. SWOT Analysis
- 17.2.7.4. Recent Developments
- 17.2.7.5. Financials (Based on Availability)
- 17.2.8 Subsea 7 SA
- 17.2.8.1. Overview
- 17.2.8.2. Products
- 17.2.8.3. SWOT Analysis
- 17.2.8.4. Recent Developments
- 17.2.8.5. Financials (Based on Availability)
- 17.2.9 National-Oilwell Varco Inc
- 17.2.9.1. Overview
- 17.2.9.2. Products
- 17.2.9.3. SWOT Analysis
- 17.2.9.4. Recent Developments
- 17.2.9.5. Financials (Based on Availability)
- 17.2.10 TechnipFMC PLC
- 17.2.10.1. Overview
- 17.2.10.2. Products
- 17.2.10.3. SWOT Analysis
- 17.2.10.4. Recent Developments
- 17.2.10.5. Financials (Based on Availability)
- 17.2.1 Dril-Quip Inc *List Not Exhaustive
List of Figures
- Figure 1: Global Subsea Systems Market Revenue Breakdown (Million, %) by Region 2024 & 2032
- Figure 2: North America Subsea Systems Market Revenue (Million), by Country 2024 & 2032
- Figure 3: North America Subsea Systems Market Revenue Share (%), by Country 2024 & 2032
- Figure 4: Europe Subsea Systems Market Revenue (Million), by Country 2024 & 2032
- Figure 5: Europe Subsea Systems Market Revenue Share (%), by Country 2024 & 2032
- Figure 6: Asia Pacific Subsea Systems Market Revenue (Million), by Country 2024 & 2032
- Figure 7: Asia Pacific Subsea Systems Market Revenue Share (%), by Country 2024 & 2032
- Figure 8: South America Subsea Systems Market Revenue (Million), by Country 2024 & 2032
- Figure 9: South America Subsea Systems Market Revenue Share (%), by Country 2024 & 2032
- Figure 10: North America Subsea Systems Market Revenue (Million), by Country 2024 & 2032
- Figure 11: North America Subsea Systems Market Revenue Share (%), by Country 2024 & 2032
- Figure 12: MEA Subsea Systems Market Revenue (Million), by Country 2024 & 2032
- Figure 13: MEA Subsea Systems Market Revenue Share (%), by Country 2024 & 2032
- Figure 14: North America Subsea Systems Market Revenue (Million), by Type 2024 & 2032
- Figure 15: North America Subsea Systems Market Revenue Share (%), by Type 2024 & 2032
- Figure 16: North America Subsea Systems Market Revenue (Million), by Component 2024 & 2032
- Figure 17: North America Subsea Systems Market Revenue Share (%), by Component 2024 & 2032
- Figure 18: North America Subsea Systems Market Revenue (Million), by Country 2024 & 2032
- Figure 19: North America Subsea Systems Market Revenue Share (%), by Country 2024 & 2032
- Figure 20: Europe Subsea Systems Market Revenue (Million), by Type 2024 & 2032
- Figure 21: Europe Subsea Systems Market Revenue Share (%), by Type 2024 & 2032
- Figure 22: Europe Subsea Systems Market Revenue (Million), by Component 2024 & 2032
- Figure 23: Europe Subsea Systems Market Revenue Share (%), by Component 2024 & 2032
- Figure 24: Europe Subsea Systems Market Revenue (Million), by Country 2024 & 2032
- Figure 25: Europe Subsea Systems Market Revenue Share (%), by Country 2024 & 2032
- Figure 26: Asia Pacific Subsea Systems Market Revenue (Million), by Type 2024 & 2032
- Figure 27: Asia Pacific Subsea Systems Market Revenue Share (%), by Type 2024 & 2032
- Figure 28: Asia Pacific Subsea Systems Market Revenue (Million), by Component 2024 & 2032
- Figure 29: Asia Pacific Subsea Systems Market Revenue Share (%), by Component 2024 & 2032
- Figure 30: Asia Pacific Subsea Systems Market Revenue (Million), by Country 2024 & 2032
- Figure 31: Asia Pacific Subsea Systems Market Revenue Share (%), by Country 2024 & 2032
- Figure 32: South America Subsea Systems Market Revenue (Million), by Type 2024 & 2032
- Figure 33: South America Subsea Systems Market Revenue Share (%), by Type 2024 & 2032
- Figure 34: South America Subsea Systems Market Revenue (Million), by Component 2024 & 2032
- Figure 35: South America Subsea Systems Market Revenue Share (%), by Component 2024 & 2032
- Figure 36: South America Subsea Systems Market Revenue (Million), by Country 2024 & 2032
- Figure 37: South America Subsea Systems Market Revenue Share (%), by Country 2024 & 2032
- Figure 38: Middle East and Africa Subsea Systems Market Revenue (Million), by Type 2024 & 2032
- Figure 39: Middle East and Africa Subsea Systems Market Revenue Share (%), by Type 2024 & 2032
- Figure 40: Middle East and Africa Subsea Systems Market Revenue (Million), by Component 2024 & 2032
- Figure 41: Middle East and Africa Subsea Systems Market Revenue Share (%), by Component 2024 & 2032
- Figure 42: Middle East and Africa Subsea Systems Market Revenue (Million), by Country 2024 & 2032
- Figure 43: Middle East and Africa Subsea Systems Market Revenue Share (%), by Country 2024 & 2032
List of Tables
- Table 1: Global Subsea Systems Market Revenue Million Forecast, by Region 2019 & 2032
- Table 2: Global Subsea Systems Market Revenue Million Forecast, by Type 2019 & 2032
- Table 3: Global Subsea Systems Market Revenue Million Forecast, by Component 2019 & 2032
- Table 4: Global Subsea Systems Market Revenue Million Forecast, by Region 2019 & 2032
- Table 5: Global Subsea Systems Market Revenue Million Forecast, by Country 2019 & 2032
- Table 6: United States Subsea Systems Market Revenue (Million) Forecast, by Application 2019 & 2032
- Table 7: Canada Subsea Systems Market Revenue (Million) Forecast, by Application 2019 & 2032
- Table 8: Mexico Subsea Systems Market Revenue (Million) Forecast, by Application 2019 & 2032
- Table 9: Global Subsea Systems Market Revenue Million Forecast, by Country 2019 & 2032
- Table 10: Germany Subsea Systems Market Revenue (Million) Forecast, by Application 2019 & 2032
- Table 11: United Kingdom Subsea Systems Market Revenue (Million) Forecast, by Application 2019 & 2032
- Table 12: France Subsea Systems Market Revenue (Million) Forecast, by Application 2019 & 2032
- Table 13: Spain Subsea Systems Market Revenue (Million) Forecast, by Application 2019 & 2032
- Table 14: Italy Subsea Systems Market Revenue (Million) Forecast, by Application 2019 & 2032
- Table 15: Spain Subsea Systems Market Revenue (Million) Forecast, by Application 2019 & 2032
- Table 16: Belgium Subsea Systems Market Revenue (Million) Forecast, by Application 2019 & 2032
- Table 17: Netherland Subsea Systems Market Revenue (Million) Forecast, by Application 2019 & 2032
- Table 18: Nordics Subsea Systems Market Revenue (Million) Forecast, by Application 2019 & 2032
- Table 19: Rest of Europe Subsea Systems Market Revenue (Million) Forecast, by Application 2019 & 2032
- Table 20: Global Subsea Systems Market Revenue Million Forecast, by Country 2019 & 2032
- Table 21: China Subsea Systems Market Revenue (Million) Forecast, by Application 2019 & 2032
- Table 22: Japan Subsea Systems Market Revenue (Million) Forecast, by Application 2019 & 2032
- Table 23: India Subsea Systems Market Revenue (Million) Forecast, by Application 2019 & 2032
- Table 24: South Korea Subsea Systems Market Revenue (Million) Forecast, by Application 2019 & 2032
- Table 25: Southeast Asia Subsea Systems Market Revenue (Million) Forecast, by Application 2019 & 2032
- Table 26: Australia Subsea Systems Market Revenue (Million) Forecast, by Application 2019 & 2032
- Table 27: Indonesia Subsea Systems Market Revenue (Million) Forecast, by Application 2019 & 2032
- Table 28: Phillipes Subsea Systems Market Revenue (Million) Forecast, by Application 2019 & 2032
- Table 29: Singapore Subsea Systems Market Revenue (Million) Forecast, by Application 2019 & 2032
- Table 30: Thailandc Subsea Systems Market Revenue (Million) Forecast, by Application 2019 & 2032
- Table 31: Rest of Asia Pacific Subsea Systems Market Revenue (Million) Forecast, by Application 2019 & 2032
- Table 32: Global Subsea Systems Market Revenue Million Forecast, by Country 2019 & 2032
- Table 33: Brazil Subsea Systems Market Revenue (Million) Forecast, by Application 2019 & 2032
- Table 34: Argentina Subsea Systems Market Revenue (Million) Forecast, by Application 2019 & 2032
- Table 35: Peru Subsea Systems Market Revenue (Million) Forecast, by Application 2019 & 2032
- Table 36: Chile Subsea Systems Market Revenue (Million) Forecast, by Application 2019 & 2032
- Table 37: Colombia Subsea Systems Market Revenue (Million) Forecast, by Application 2019 & 2032
- Table 38: Ecuador Subsea Systems Market Revenue (Million) Forecast, by Application 2019 & 2032
- Table 39: Venezuela Subsea Systems Market Revenue (Million) Forecast, by Application 2019 & 2032
- Table 40: Rest of South America Subsea Systems Market Revenue (Million) Forecast, by Application 2019 & 2032
- Table 41: Global Subsea Systems Market Revenue Million Forecast, by Country 2019 & 2032
- Table 42: United States Subsea Systems Market Revenue (Million) Forecast, by Application 2019 & 2032
- Table 43: Canada Subsea Systems Market Revenue (Million) Forecast, by Application 2019 & 2032
- Table 44: Mexico Subsea Systems Market Revenue (Million) Forecast, by Application 2019 & 2032
- Table 45: Global Subsea Systems Market Revenue Million Forecast, by Country 2019 & 2032
- Table 46: United Arab Emirates Subsea Systems Market Revenue (Million) Forecast, by Application 2019 & 2032
- Table 47: Saudi Arabia Subsea Systems Market Revenue (Million) Forecast, by Application 2019 & 2032
- Table 48: South Africa Subsea Systems Market Revenue (Million) Forecast, by Application 2019 & 2032
- Table 49: Rest of Middle East and Africa Subsea Systems Market Revenue (Million) Forecast, by Application 2019 & 2032
- Table 50: Global Subsea Systems Market Revenue Million Forecast, by Type 2019 & 2032
- Table 51: Global Subsea Systems Market Revenue Million Forecast, by Component 2019 & 2032
- Table 52: Global Subsea Systems Market Revenue Million Forecast, by Country 2019 & 2032
- Table 53: Canada Subsea Systems Market Revenue (Million) Forecast, by Application 2019 & 2032
- Table 54: Mexico Subsea Systems Market Revenue (Million) Forecast, by Application 2019 & 2032
- Table 55: United States of America Subsea Systems Market Revenue (Million) Forecast, by Application 2019 & 2032
- Table 56: Rest of the North America Subsea Systems Market Revenue (Million) Forecast, by Application 2019 & 2032
- Table 57: Global Subsea Systems Market Revenue Million Forecast, by Type 2019 & 2032
- Table 58: Global Subsea Systems Market Revenue Million Forecast, by Component 2019 & 2032
- Table 59: Global Subsea Systems Market Revenue Million Forecast, by Country 2019 & 2032
- Table 60: Norway Subsea Systems Market Revenue (Million) Forecast, by Application 2019 & 2032
- Table 61: United Kingdom Subsea Systems Market Revenue (Million) Forecast, by Application 2019 & 2032
- Table 62: France Subsea Systems Market Revenue (Million) Forecast, by Application 2019 & 2032
- Table 63: Italy Subsea Systems Market Revenue (Million) Forecast, by Application 2019 & 2032
- Table 64: Global Subsea Systems Market Revenue Million Forecast, by Type 2019 & 2032
- Table 65: Global Subsea Systems Market Revenue Million Forecast, by Component 2019 & 2032
- Table 66: Global Subsea Systems Market Revenue Million Forecast, by Country 2019 & 2032
- Table 67: China Subsea Systems Market Revenue (Million) Forecast, by Application 2019 & 2032
- Table 68: India Subsea Systems Market Revenue (Million) Forecast, by Application 2019 & 2032
- Table 69: Japan Subsea Systems Market Revenue (Million) Forecast, by Application 2019 & 2032
- Table 70: Rest of the Asia Pacific Subsea Systems Market Revenue (Million) Forecast, by Application 2019 & 2032
- Table 71: Global Subsea Systems Market Revenue Million Forecast, by Type 2019 & 2032
- Table 72: Global Subsea Systems Market Revenue Million Forecast, by Component 2019 & 2032
- Table 73: Global Subsea Systems Market Revenue Million Forecast, by Country 2019 & 2032
- Table 74: Brazil Subsea Systems Market Revenue (Million) Forecast, by Application 2019 & 2032
- Table 75: Argentina Subsea Systems Market Revenue (Million) Forecast, by Application 2019 & 2032
- Table 76: Rest of the South America Subsea Systems Market Revenue (Million) Forecast, by Application 2019 & 2032
- Table 77: Global Subsea Systems Market Revenue Million Forecast, by Type 2019 & 2032
- Table 78: Global Subsea Systems Market Revenue Million Forecast, by Component 2019 & 2032
- Table 79: Global Subsea Systems Market Revenue Million Forecast, by Country 2019 & 2032
- Table 80: United Arab Emirates Subsea Systems Market Revenue (Million) Forecast, by Application 2019 & 2032
- Table 81: Saudi Arabia Subsea Systems Market Revenue (Million) Forecast, by Application 2019 & 2032
- Table 82: Iran Subsea Systems Market Revenue (Million) Forecast, by Application 2019 & 2032
- Table 83: Iraq Subsea Systems Market Revenue (Million) Forecast, by Application 2019 & 2032
- Table 84: Rest of the Middle East and Africa Subsea Systems Market Revenue (Million) Forecast, by Application 2019 & 2032
Frequently Asked Questions
1. What is the projected Compound Annual Growth Rate (CAGR) of the Subsea Systems Market?
The projected CAGR is approximately 5.98%.
2. Which companies are prominent players in the Subsea Systems Market?
Key companies in the market include Dril-Quip Inc *List Not Exhaustive, Kerui Group Co Ltd, Baker Hughes Co, Schlumberger Ltd, Oceaneering International, Akastor ASA, Halliburton Co, Subsea 7 SA, National-Oilwell Varco Inc, TechnipFMC PLC.
3. What are the main segments of the Subsea Systems Market?
The market segments include Type, Component.
4. Can you provide details about the market size?
The market size is estimated to be USD 19.85 Million as of 2022.
5. What are some drivers contributing to market growth?
4.; Improved Viability Of Offshore Oil And Gas Projects4.; Rising Deep Water Oil & Gas Exploration And Production Activities In The Americas. Asia-pacific. And Middle-east & Africa Region.
6. What are the notable trends driving market growth?
Subsea Production Segment to Dominate the Market.
7. Are there any restraints impacting market growth?
4.; Ban On Offshore Exploration And Production Activities In Multiple Regions.
8. Can you provide examples of recent developments in the market?
February 2023: Equinor made a new commercial oil and gas discovery in the North Sea off Norway using a Transocean-owned rig. The discovery was made after the conclusion of drilling a wildcat well (31/1-3 S) and an appraisal well (31/1-3 A) in production license 923.
9. What pricing options are available for accessing the report?
Pricing options include single-user, multi-user, and enterprise licenses priced at USD 4750, USD 5250, and USD 8750 respectively.
10. Is the market size provided in terms of value or volume?
The market size is provided in terms of value, measured in Million.
11. Are there any specific market keywords associated with the report?
Yes, the market keyword associated with the report is "Subsea Systems Market," which aids in identifying and referencing the specific market segment covered.
12. How do I determine which pricing option suits my needs best?
The pricing options vary based on user requirements and access needs. Individual users may opt for single-user licenses, while businesses requiring broader access may choose multi-user or enterprise licenses for cost-effective access to the report.
13. Are there any additional resources or data provided in the Subsea Systems Market report?
While the report offers comprehensive insights, it's advisable to review the specific contents or supplementary materials provided to ascertain if additional resources or data are available.
14. How can I stay updated on further developments or reports in the Subsea Systems Market?
To stay informed about further developments, trends, and reports in the Subsea Systems Market, consider subscribing to industry newsletters, following relevant companies and organizations, or regularly checking reputable industry news sources and publications.
Methodology
Step 1 - Identification of Relevant Samples Size from Population Database


Step 2 - Approaches for Defining Global Market Size (Value, Volume* & Price*)

Note*: In applicable scenarios
Step 3 - Data Sources
Primary Research
- Web Analytics
- Survey Reports
- Research Institute
- Latest Research Reports
- Opinion Leaders
Secondary Research
- Annual Reports
- White Paper
- Latest Press Release
- Industry Association
- Paid Database
- Investor Presentations

Step 4 - Data Triangulation
Involves using different sources of information in order to increase the validity of a study
These sources are likely to be stakeholders in a program - participants, other researchers, program staff, other community members, and so on.
Then we put all data in single framework & apply various statistical tools to find out the dynamic on the market.
During the analysis stage, feedback from the stakeholder groups would be compared to determine areas of agreement as well as areas of divergence
