

Key Insights
The synthetic diamond market is poised for significant expansion, with an estimated Compound Annual Growth Rate (CAGR) of 2.7% from a base year of 2025. This growth is propelled by escalating demand in industrial applications, including cutting tools, abrasives, and heat sinks. Innovations in High Pressure High Temperature (HPHT) and Chemical Vapor Deposition (CVD) manufacturing processes are yielding higher quality and more cost-effective synthetic diamonds. The burgeoning popularity of lab-grown diamonds in jewelry, driven by ethical considerations and competitive pricing, is another key growth influencer. Continuous technological advancements are also broadening the application scope of synthetic diamonds into emerging sectors like electronics and photonics. Key markets include North America and Asia-Pacific, with China being a prominent region due to its robust industrial infrastructure and increasing consumer acceptance of lab-grown diamonds.
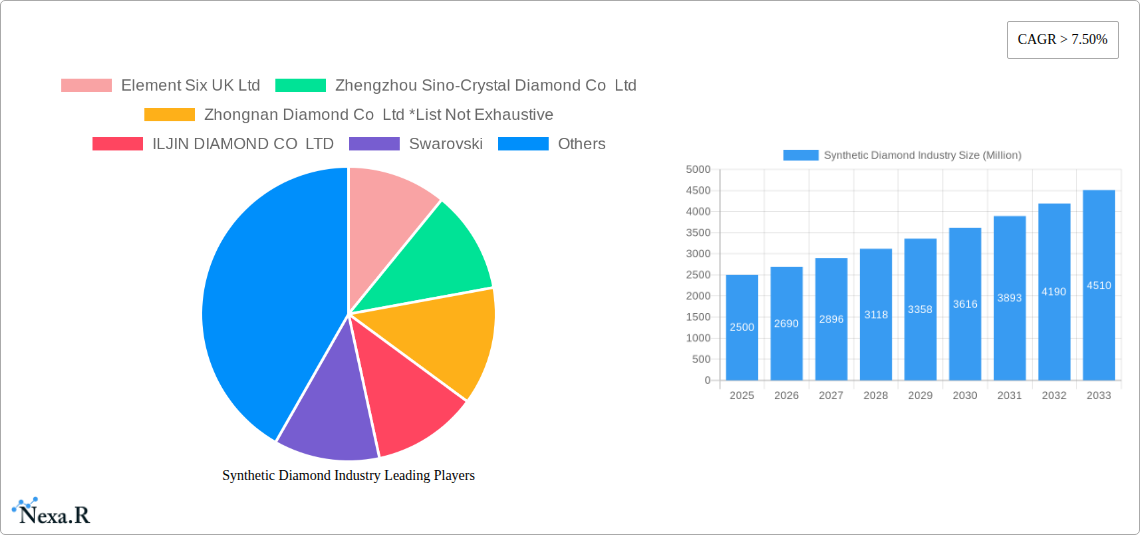
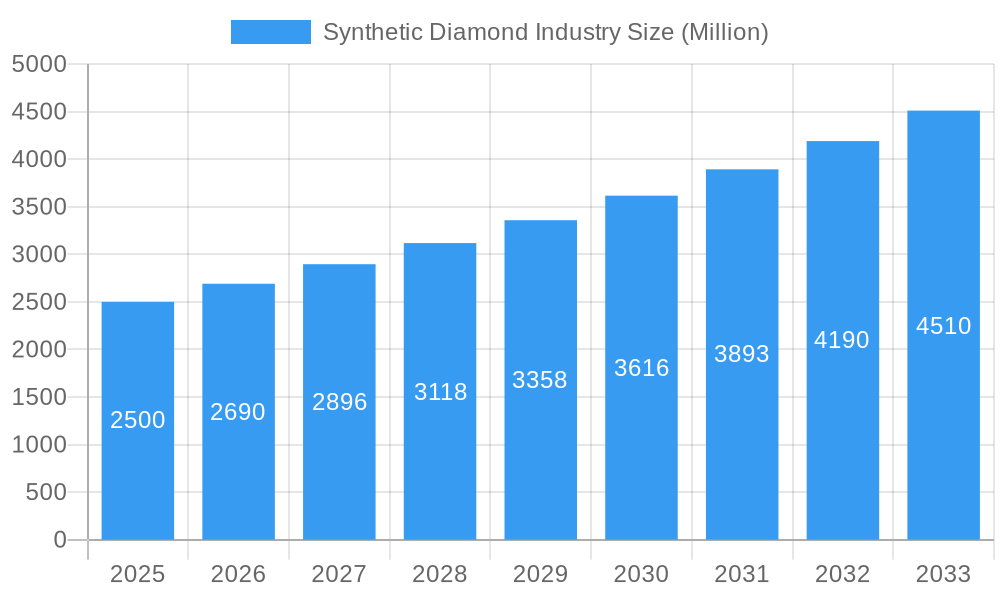
Synthetic Diamond Industry Market Size (In Billion)
Despite strong growth prospects, the market encounters challenges such as raw material price volatility and intense competition from established entities like Element Six and Swarovski, alongside emerging players. Concerns surrounding the energy intensity of certain production methods could also present long-term constraints. However, advancements in sustainable manufacturing and the diversification of synthetic diamond applications are anticipated to offset these challenges, ensuring sustained market development. Market segmentation by type (polished and rough) and manufacturing process (HPHT and CVD) offers crucial insights for identifying niche opportunities.
Synthetic Diamond Industry Company Market Share
Synthetic Diamond Industry: A Comprehensive Market Report (2019-2033)
This in-depth report provides a comprehensive analysis of the synthetic diamond industry, encompassing market dynamics, growth trends, regional dominance, product landscape, and key player strategies. The study period covers 2019-2033, with 2025 as the base and estimated year. This report is crucial for industry professionals, investors, and strategists seeking to understand and capitalize on the evolving landscape of this dynamic market, valued at xx Million in 2025 and projected to reach xx Million by 2033.
Synthetic Diamond Industry Market Dynamics & Structure
This section analyzes the competitive landscape, technological advancements, regulatory influences, and market trends shaping the synthetic diamond industry. The market is characterized by a moderate level of concentration, with key players such as Element Six UK Ltd, Zhengzhou Sino-Crystal Diamond Co Ltd, and ILJIN DIAMOND CO LTD holding significant market share. However, the emergence of new entrants and technological innovations are fostering increased competition.
- Market Concentration: Moderately concentrated, with the top 5 players holding approximately xx% of the global market share in 2025.
- Technological Innovation: Driven by advancements in HPHT and CVD manufacturing processes, leading to improved diamond quality and reduced production costs.
- Regulatory Framework: Varying regulations across different regions influence production and trade. Compliance requirements and environmental regulations impact operational costs.
- Competitive Product Substitutes: Naturally mined diamonds remain a primary competitor, although synthetic diamonds offer advantages in cost and ethical sourcing. Other materials with similar properties are also emerging as potential substitutes.
- End-User Demographics: Primarily jeweler, industrial and electronics industries. Growth is driven by increasing demand from the electronics and industrial sectors.
- M&A Trends: A moderate level of M&A activity is observed, driven by consolidation efforts among major players and the acquisition of smaller companies with specialized technologies. An estimated xx M&A deals were recorded between 2019 and 2024.
Synthetic Diamond Industry Growth Trends & Insights
The synthetic diamond market is experiencing robust growth, driven by rising demand from various sectors. Technological advancements, cost reductions, and increasing consumer awareness regarding ethical sourcing are key factors fueling this expansion. The market exhibited a CAGR of xx% during the historical period (2019-2024) and is projected to maintain a CAGR of xx% during the forecast period (2025-2033). Market penetration in key end-use sectors continues to increase, particularly in electronics, industrial applications and the jewelry sector. The adoption rate of synthetic diamonds is accelerating, driven by innovations in manufacturing processes. Consumer behavior shifts towards ethical and sustainable products further bolster market growth. The overall market size, considering both polished and rough diamonds, is anticipated to experience substantial expansion, exceeding xx Million by 2033.
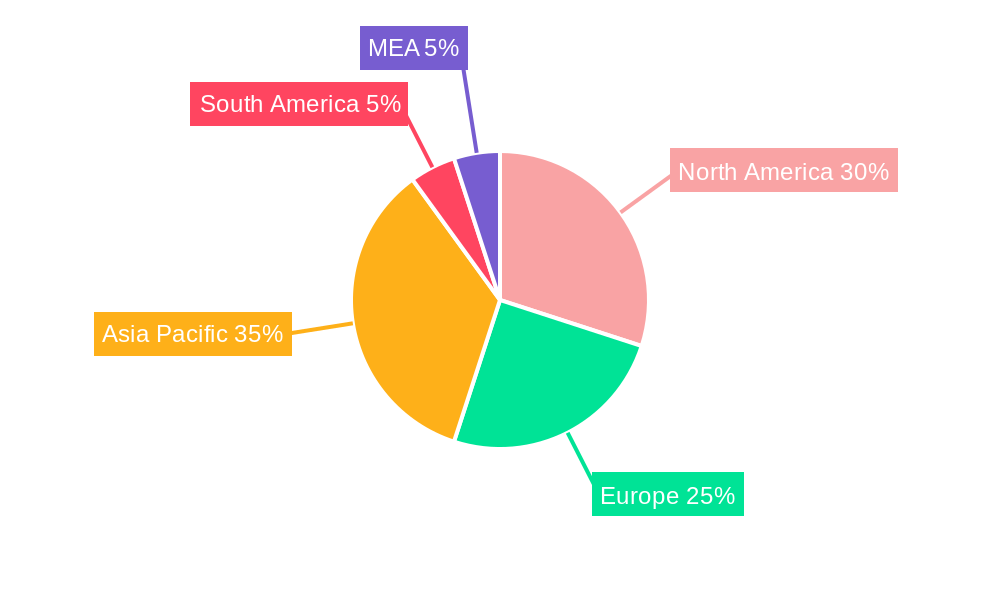
Dominant Regions, Countries, or Segments in Synthetic Diamond Industry
China and the US are the leading regions driving global growth. China's dominance stems from its robust manufacturing sector and substantial domestic demand. The US benefits from its advanced technological capabilities and strong presence in the electronics and industrial sectors. Within the product segmentation:
- Type: The polished diamond segment holds the largest market share, driven by increasing demand from the jewelry and luxury goods industries.
- Manufacturing Process: HPHT and CVD both contribute significantly to the production volume. The CVD method is gaining traction due to its potential for higher quality and efficiency.
Key Drivers: Government support for technological advancements in China and the US are driving substantial growth. Furthermore, established infrastructure and skilled labor contribute to regional dominance.
Synthetic Diamond Industry Product Landscape
Synthetic diamonds are available in various forms, including polished and rough diamonds, catering to diverse applications. The industry is witnessing continuous product innovation, with a focus on enhancing the quality, consistency, and cost-effectiveness of synthetic diamonds. Key innovations include improved crystal growth techniques, resulting in larger, more flawless diamonds, and the development of specialized diamond types for specific industrial applications, enhancing their performance metrics. Unique selling propositions include superior quality control, ethical sourcing, cost-effectiveness, and tailored properties for diverse applications.
Key Drivers, Barriers & Challenges in Synthetic Diamond Industry
Key Drivers:
- Technological advancements in HPHT and CVD methods leading to higher quality and lower costs.
- Increasing demand from electronics and industrial sectors.
- Growing consumer preference for ethical and sustainable products.
Key Challenges & Restraints:
- Competition from naturally mined diamonds.
- Price fluctuations in raw materials.
- Regulatory hurdles and environmental concerns.
- Supply chain disruptions potentially impacting production and distribution.
Emerging Opportunities in Synthetic Diamond Industry
Emerging opportunities lie in expanding applications in high-tech sectors (semiconductors, quantum computing), leveraging advancements in 3D printing, and exploring new markets in developing economies with growing consumer spending. Furthermore, tapping into the potential of lab-grown diamonds within sustainable jewelry offers a significant growth avenue.
Growth Accelerators in the Synthetic Diamond Industry Industry
Technological breakthroughs in diamond synthesis, strategic partnerships between producers and end-users, and expanding market penetration into diverse applications such as quantum sensing and high-power electronics are driving long-term industry growth.
Key Players Shaping the Synthetic Diamond Industry Market
- Element Six UK Ltd
- Zhengzhou Sino-Crystal Diamond Co Ltd
- Zhongnan Diamond Co Ltd
- ILJIN DIAMOND CO LTD
- Swarovski
- New Diamond Technology
- Pure Grown Diamonds (PGD)
- Applied Diamond Inc
- Henan Huanghe Whirlwind Co Ltd
- Sumitomo Electric Industries Ltd
- Adamas One Corp
Notable Milestones in Synthetic Diamond Industry Sector
- July 2021: Element Six UK LTD partnered with the University of Warwick to develop next-generation synthetic diamond technologies.
- February 2022: Element Six UK Ltd collaborated with II-VI Inc. to produce high-quality single-crystal diamonds.
In-Depth Synthetic Diamond Industry Market Outlook
The synthetic diamond industry is poised for sustained growth, driven by technological innovation, expanding applications, and increasing consumer demand. Strategic partnerships, focus on sustainability, and exploration of new markets will be key factors determining future market potential and creating lucrative strategic opportunities for key players.
Synthetic Diamond Industry Segmentation
-
1. Type
-
1.1. Polished
- 1.1.1. Jewelry
- 1.1.2. Electronics
- 1.1.3. Healthcare
- 1.1.4. Other Polished Types
-
1.2. Rough
- 1.2.1. Construction
- 1.2.2. Mining
- 1.2.3. Oil and Gas
- 1.2.4. Other Rough Types
-
1.1. Polished
-
2. Manufacturing Process
- 2.1. High Pressure, High Temperature (HPHT)
- 2.2. Chemical Vapor Deposition (CVD)
Synthetic Diamond Industry Segmentation By Geography
-
1. Asia Pacific
- 1.1. China
- 1.2. India
- 1.3. Japan
- 1.4. ASEAN Countries
- 1.5. Rest of Asia Pacific
-
2. North America
- 2.1. United States
- 2.2. Rest of North America
-
3. Europe
- 3.1. Germany
- 3.2. France
- 3.3. United Kingdom
- 3.4. Italy
- 3.5. Spain
- 3.6. Rest of Europe
-
4. South America
- 4.1. Brazil
- 4.2. Rest of South America
-
5. Middle East and Africa
- 5.1. GCC Countries
- 5.2. South Africa
- 5.3. Rest of Middle East and Africa
Synthetic Diamond Industry Regional Market Share
Geographic Coverage of Synthetic Diamond Industry
Synthetic Diamond Industry REPORT HIGHLIGHTS
| Aspects | Details |
|---|---|
| Study Period | 2020-2034 |
| Base Year | 2025 |
| Estimated Year | 2026 |
| Forecast Period | 2026-2034 |
| Historical Period | 2020-2025 |
| Growth Rate | CAGR of 2.7% from 2020-2034 |
| Segmentation |
|
Table of Contents
- 1. Introduction
- 1.1. Research Scope
- 1.2. Market Segmentation
- 1.3. Research Objective
- 1.4. Definitions and Assumptions
- 2. Executive Summary
- 2.1. Market Snapshot
- 3. Market Dynamics
- 3.1. Market Drivers
- 3.2. Market Restrains
- 3.3. Market Trends
- 3.4. Market Opportunities
- 4. Market Factor Analysis
- 4.1. Porters Five Forces
- 4.1.1. Bargaining Power of Suppliers
- 4.1.2. Bargaining Power of Buyers
- 4.1.3. Threat of New Entrants
- 4.1.4. Threat of Substitutes
- 4.1.5. Competitive Rivalry
- 4.2. PESTEL analysis
- 4.3. BCG Analysis
- 4.3.1. Stars (High Growth, High Market Share)
- 4.3.2. Cash Cows (Low Growth, High Market Share)
- 4.3.3. Question Mark (High Growth, Low Market Share)
- 4.3.4. Dogs (Low Growth, Low Market Share)
- 4.4. Ansoff Matrix Analysis
- 4.5. Supply Chain Analysis
- 4.6. Regulatory Landscape
- 4.7. Current Market Potential and Opportunity Assessment (TAM–SAM–SOM Framework)
- 4.8. NRP Analyst Note
- 4.1. Porters Five Forces
- 5. Market Analysis, Insights and Forecast 2021-2033
- 5.1. Market Analysis, Insights and Forecast - by Type
- 5.1.1. Polished
- 5.1.1.1. Jewelry
- 5.1.1.2. Electronics
- 5.1.1.3. Healthcare
- 5.1.1.4. Other Polished Types
- 5.1.2. Rough
- 5.1.2.1. Construction
- 5.1.2.2. Mining
- 5.1.2.3. Oil and Gas
- 5.1.2.4. Other Rough Types
- 5.1.1. Polished
- 5.2. Market Analysis, Insights and Forecast - by Manufacturing Process
- 5.2.1. High Pressure, High Temperature (HPHT)
- 5.2.2. Chemical Vapor Deposition (CVD)
- 5.3. Market Analysis, Insights and Forecast - by Region
- 5.3.1. Asia Pacific
- 5.3.2. North America
- 5.3.3. Europe
- 5.3.4. South America
- 5.3.5. Middle East and Africa
- 5.1. Market Analysis, Insights and Forecast - by Type
- 6. Global Synthetic Diamond Industry Analysis, Insights and Forecast, 2021-2033
- 6.1. Market Analysis, Insights and Forecast - by Type
- 6.1.1. Polished
- 6.1.1.1. Jewelry
- 6.1.1.2. Electronics
- 6.1.1.3. Healthcare
- 6.1.1.4. Other Polished Types
- 6.1.2. Rough
- 6.1.2.1. Construction
- 6.1.2.2. Mining
- 6.1.2.3. Oil and Gas
- 6.1.2.4. Other Rough Types
- 6.1.1. Polished
- 6.2. Market Analysis, Insights and Forecast - by Manufacturing Process
- 6.2.1. High Pressure, High Temperature (HPHT)
- 6.2.2. Chemical Vapor Deposition (CVD)
- 6.1. Market Analysis, Insights and Forecast - by Type
- 7. Asia Pacific Synthetic Diamond Industry Analysis, Insights and Forecast, 2020-2032
- 7.1. Market Analysis, Insights and Forecast - by Type
- 7.1.1. Polished
- 7.1.1.1. Jewelry
- 7.1.1.2. Electronics
- 7.1.1.3. Healthcare
- 7.1.1.4. Other Polished Types
- 7.1.2. Rough
- 7.1.2.1. Construction
- 7.1.2.2. Mining
- 7.1.2.3. Oil and Gas
- 7.1.2.4. Other Rough Types
- 7.1.1. Polished
- 7.2. Market Analysis, Insights and Forecast - by Manufacturing Process
- 7.2.1. High Pressure, High Temperature (HPHT)
- 7.2.2. Chemical Vapor Deposition (CVD)
- 7.1. Market Analysis, Insights and Forecast - by Type
- 8. North America Synthetic Diamond Industry Analysis, Insights and Forecast, 2020-2032
- 8.1. Market Analysis, Insights and Forecast - by Type
- 8.1.1. Polished
- 8.1.1.1. Jewelry
- 8.1.1.2. Electronics
- 8.1.1.3. Healthcare
- 8.1.1.4. Other Polished Types
- 8.1.2. Rough
- 8.1.2.1. Construction
- 8.1.2.2. Mining
- 8.1.2.3. Oil and Gas
- 8.1.2.4. Other Rough Types
- 8.1.1. Polished
- 8.2. Market Analysis, Insights and Forecast - by Manufacturing Process
- 8.2.1. High Pressure, High Temperature (HPHT)
- 8.2.2. Chemical Vapor Deposition (CVD)
- 8.1. Market Analysis, Insights and Forecast - by Type
- 9. Europe Synthetic Diamond Industry Analysis, Insights and Forecast, 2020-2032
- 9.1. Market Analysis, Insights and Forecast - by Type
- 9.1.1. Polished
- 9.1.1.1. Jewelry
- 9.1.1.2. Electronics
- 9.1.1.3. Healthcare
- 9.1.1.4. Other Polished Types
- 9.1.2. Rough
- 9.1.2.1. Construction
- 9.1.2.2. Mining
- 9.1.2.3. Oil and Gas
- 9.1.2.4. Other Rough Types
- 9.1.1. Polished
- 9.2. Market Analysis, Insights and Forecast - by Manufacturing Process
- 9.2.1. High Pressure, High Temperature (HPHT)
- 9.2.2. Chemical Vapor Deposition (CVD)
- 9.1. Market Analysis, Insights and Forecast - by Type
- 10. South America Synthetic Diamond Industry Analysis, Insights and Forecast, 2020-2032
- 10.1. Market Analysis, Insights and Forecast - by Type
- 10.1.1. Polished
- 10.1.1.1. Jewelry
- 10.1.1.2. Electronics
- 10.1.1.3. Healthcare
- 10.1.1.4. Other Polished Types
- 10.1.2. Rough
- 10.1.2.1. Construction
- 10.1.2.2. Mining
- 10.1.2.3. Oil and Gas
- 10.1.2.4. Other Rough Types
- 10.1.1. Polished
- 10.2. Market Analysis, Insights and Forecast - by Manufacturing Process
- 10.2.1. High Pressure, High Temperature (HPHT)
- 10.2.2. Chemical Vapor Deposition (CVD)
- 10.1. Market Analysis, Insights and Forecast - by Type
- 11. Middle East and Africa Synthetic Diamond Industry Analysis, Insights and Forecast, 2020-2032
- 11.1. Market Analysis, Insights and Forecast - by Type
- 11.1.1. Polished
- 11.1.1.1. Jewelry
- 11.1.1.2. Electronics
- 11.1.1.3. Healthcare
- 11.1.1.4. Other Polished Types
- 11.1.2. Rough
- 11.1.2.1. Construction
- 11.1.2.2. Mining
- 11.1.2.3. Oil and Gas
- 11.1.2.4. Other Rough Types
- 11.1.1. Polished
- 11.2. Market Analysis, Insights and Forecast - by Manufacturing Process
- 11.2.1. High Pressure, High Temperature (HPHT)
- 11.2.2. Chemical Vapor Deposition (CVD)
- 11.1. Market Analysis, Insights and Forecast - by Type
- 12. Competitive Analysis
- 12.1. Company Profiles
- 12.1.1 Element Six UK Ltd
- 12.1.1.1. Company Overview
- 12.1.1.2. Products
- 12.1.1.3. Company Financials
- 12.1.1.4. SWOT Analysis
- 12.1.2 Zhengzhou Sino-Crystal Diamond Co Ltd
- 12.1.2.1. Company Overview
- 12.1.2.2. Products
- 12.1.2.3. Company Financials
- 12.1.2.4. SWOT Analysis
- 12.1.3 Zhongnan Diamond Co Ltd *List Not Exhaustive
- 12.1.3.1. Company Overview
- 12.1.3.2. Products
- 12.1.3.3. Company Financials
- 12.1.3.4. SWOT Analysis
- 12.1.4 ILJIN DIAMOND CO LTD
- 12.1.4.1. Company Overview
- 12.1.4.2. Products
- 12.1.4.3. Company Financials
- 12.1.4.4. SWOT Analysis
- 12.1.5 Swarovski
- 12.1.5.1. Company Overview
- 12.1.5.2. Products
- 12.1.5.3. Company Financials
- 12.1.5.4. SWOT Analysis
- 12.1.6 New Diamond Technology
- 12.1.6.1. Company Overview
- 12.1.6.2. Products
- 12.1.6.3. Company Financials
- 12.1.6.4. SWOT Analysis
- 12.1.7 Pure Grown Diamonds (PGD)
- 12.1.7.1. Company Overview
- 12.1.7.2. Products
- 12.1.7.3. Company Financials
- 12.1.7.4. SWOT Analysis
- 12.1.8 Applied Diamond Inc
- 12.1.8.1. Company Overview
- 12.1.8.2. Products
- 12.1.8.3. Company Financials
- 12.1.8.4. SWOT Analysis
- 12.1.9 Henan Huanghe Whirlwind Co Ltd
- 12.1.9.1. Company Overview
- 12.1.9.2. Products
- 12.1.9.3. Company Financials
- 12.1.9.4. SWOT Analysis
- 12.1.10 Sumitomo Electric Industries Ltd
- 12.1.10.1. Company Overview
- 12.1.10.2. Products
- 12.1.10.3. Company Financials
- 12.1.10.4. SWOT Analysis
- 12.1.11 Adamas One Corp
- 12.1.11.1. Company Overview
- 12.1.11.2. Products
- 12.1.11.3. Company Financials
- 12.1.11.4. SWOT Analysis
- 12.1.1 Element Six UK Ltd
- 12.2. Market Entropy
- 12.2.1 Company's Key Areas Served
- 12.2.2 Recent Developments
- 12.3. Company Market Share Analysis 2025
- 12.3.1 Top 5 Companies Market Share Analysis
- 12.3.2 Top 3 Companies Market Share Analysis
- 12.4. List of Potential Customers
- 13. Research Methodology
List of Figures
- Figure 1: Global Synthetic Diamond Industry Revenue Breakdown (billion, %) by Region 2025 & 2033
- Figure 2: Asia Pacific Synthetic Diamond Industry Revenue (billion), by Type 2025 & 2033
- Figure 3: Asia Pacific Synthetic Diamond Industry Revenue Share (%), by Type 2025 & 2033
- Figure 4: Asia Pacific Synthetic Diamond Industry Revenue (billion), by Manufacturing Process 2025 & 2033
- Figure 5: Asia Pacific Synthetic Diamond Industry Revenue Share (%), by Manufacturing Process 2025 & 2033
- Figure 6: Asia Pacific Synthetic Diamond Industry Revenue (billion), by Country 2025 & 2033
- Figure 7: Asia Pacific Synthetic Diamond Industry Revenue Share (%), by Country 2025 & 2033
- Figure 8: North America Synthetic Diamond Industry Revenue (billion), by Type 2025 & 2033
- Figure 9: North America Synthetic Diamond Industry Revenue Share (%), by Type 2025 & 2033
- Figure 10: North America Synthetic Diamond Industry Revenue (billion), by Manufacturing Process 2025 & 2033
- Figure 11: North America Synthetic Diamond Industry Revenue Share (%), by Manufacturing Process 2025 & 2033
- Figure 12: North America Synthetic Diamond Industry Revenue (billion), by Country 2025 & 2033
- Figure 13: North America Synthetic Diamond Industry Revenue Share (%), by Country 2025 & 2033
- Figure 14: Europe Synthetic Diamond Industry Revenue (billion), by Type 2025 & 2033
- Figure 15: Europe Synthetic Diamond Industry Revenue Share (%), by Type 2025 & 2033
- Figure 16: Europe Synthetic Diamond Industry Revenue (billion), by Manufacturing Process 2025 & 2033
- Figure 17: Europe Synthetic Diamond Industry Revenue Share (%), by Manufacturing Process 2025 & 2033
- Figure 18: Europe Synthetic Diamond Industry Revenue (billion), by Country 2025 & 2033
- Figure 19: Europe Synthetic Diamond Industry Revenue Share (%), by Country 2025 & 2033
- Figure 20: South America Synthetic Diamond Industry Revenue (billion), by Type 2025 & 2033
- Figure 21: South America Synthetic Diamond Industry Revenue Share (%), by Type 2025 & 2033
- Figure 22: South America Synthetic Diamond Industry Revenue (billion), by Manufacturing Process 2025 & 2033
- Figure 23: South America Synthetic Diamond Industry Revenue Share (%), by Manufacturing Process 2025 & 2033
- Figure 24: South America Synthetic Diamond Industry Revenue (billion), by Country 2025 & 2033
- Figure 25: South America Synthetic Diamond Industry Revenue Share (%), by Country 2025 & 2033
- Figure 26: Middle East and Africa Synthetic Diamond Industry Revenue (billion), by Type 2025 & 2033
- Figure 27: Middle East and Africa Synthetic Diamond Industry Revenue Share (%), by Type 2025 & 2033
- Figure 28: Middle East and Africa Synthetic Diamond Industry Revenue (billion), by Manufacturing Process 2025 & 2033
- Figure 29: Middle East and Africa Synthetic Diamond Industry Revenue Share (%), by Manufacturing Process 2025 & 2033
- Figure 30: Middle East and Africa Synthetic Diamond Industry Revenue (billion), by Country 2025 & 2033
- Figure 31: Middle East and Africa Synthetic Diamond Industry Revenue Share (%), by Country 2025 & 2033
List of Tables
- Table 1: Global Synthetic Diamond Industry Revenue billion Forecast, by Type 2020 & 2033
- Table 2: Global Synthetic Diamond Industry Revenue billion Forecast, by Manufacturing Process 2020 & 2033
- Table 3: Global Synthetic Diamond Industry Revenue billion Forecast, by Region 2020 & 2033
- Table 4: Global Synthetic Diamond Industry Revenue billion Forecast, by Type 2020 & 2033
- Table 5: Global Synthetic Diamond Industry Revenue billion Forecast, by Manufacturing Process 2020 & 2033
- Table 6: Global Synthetic Diamond Industry Revenue billion Forecast, by Country 2020 & 2033
- Table 7: China Synthetic Diamond Industry Revenue (billion) Forecast, by Application 2020 & 2033
- Table 8: India Synthetic Diamond Industry Revenue (billion) Forecast, by Application 2020 & 2033
- Table 9: Japan Synthetic Diamond Industry Revenue (billion) Forecast, by Application 2020 & 2033
- Table 10: ASEAN Countries Synthetic Diamond Industry Revenue (billion) Forecast, by Application 2020 & 2033
- Table 11: Rest of Asia Pacific Synthetic Diamond Industry Revenue (billion) Forecast, by Application 2020 & 2033
- Table 12: Global Synthetic Diamond Industry Revenue billion Forecast, by Type 2020 & 2033
- Table 13: Global Synthetic Diamond Industry Revenue billion Forecast, by Manufacturing Process 2020 & 2033
- Table 14: Global Synthetic Diamond Industry Revenue billion Forecast, by Country 2020 & 2033
- Table 15: United States Synthetic Diamond Industry Revenue (billion) Forecast, by Application 2020 & 2033
- Table 16: Rest of North America Synthetic Diamond Industry Revenue (billion) Forecast, by Application 2020 & 2033
- Table 17: Global Synthetic Diamond Industry Revenue billion Forecast, by Type 2020 & 2033
- Table 18: Global Synthetic Diamond Industry Revenue billion Forecast, by Manufacturing Process 2020 & 2033
- Table 19: Global Synthetic Diamond Industry Revenue billion Forecast, by Country 2020 & 2033
- Table 20: Germany Synthetic Diamond Industry Revenue (billion) Forecast, by Application 2020 & 2033
- Table 21: France Synthetic Diamond Industry Revenue (billion) Forecast, by Application 2020 & 2033
- Table 22: United Kingdom Synthetic Diamond Industry Revenue (billion) Forecast, by Application 2020 & 2033
- Table 23: Italy Synthetic Diamond Industry Revenue (billion) Forecast, by Application 2020 & 2033
- Table 24: Spain Synthetic Diamond Industry Revenue (billion) Forecast, by Application 2020 & 2033
- Table 25: Rest of Europe Synthetic Diamond Industry Revenue (billion) Forecast, by Application 2020 & 2033
- Table 26: Global Synthetic Diamond Industry Revenue billion Forecast, by Type 2020 & 2033
- Table 27: Global Synthetic Diamond Industry Revenue billion Forecast, by Manufacturing Process 2020 & 2033
- Table 28: Global Synthetic Diamond Industry Revenue billion Forecast, by Country 2020 & 2033
- Table 29: Brazil Synthetic Diamond Industry Revenue (billion) Forecast, by Application 2020 & 2033
- Table 30: Rest of South America Synthetic Diamond Industry Revenue (billion) Forecast, by Application 2020 & 2033
- Table 31: Global Synthetic Diamond Industry Revenue billion Forecast, by Type 2020 & 2033
- Table 32: Global Synthetic Diamond Industry Revenue billion Forecast, by Manufacturing Process 2020 & 2033
- Table 33: Global Synthetic Diamond Industry Revenue billion Forecast, by Country 2020 & 2033
- Table 34: GCC Countries Synthetic Diamond Industry Revenue (billion) Forecast, by Application 2020 & 2033
- Table 35: South Africa Synthetic Diamond Industry Revenue (billion) Forecast, by Application 2020 & 2033
- Table 36: Rest of Middle East and Africa Synthetic Diamond Industry Revenue (billion) Forecast, by Application 2020 & 2033
Frequently Asked Questions
1. What is the projected Compound Annual Growth Rate (CAGR) of the Synthetic Diamond Industry?
The projected CAGR is approximately 2.7%.
2. Which companies are prominent players in the Synthetic Diamond Industry?
Key companies in the market include Element Six UK Ltd, Zhengzhou Sino-Crystal Diamond Co Ltd, Zhongnan Diamond Co Ltd *List Not Exhaustive, ILJIN DIAMOND CO LTD, Swarovski, New Diamond Technology, Pure Grown Diamonds (PGD), Applied Diamond Inc, Henan Huanghe Whirlwind Co Ltd, Sumitomo Electric Industries Ltd, Adamas One Corp.
3. What are the main segments of the Synthetic Diamond Industry?
The market segments include Type, Manufacturing Process.
4. Can you provide details about the market size?
The market size is estimated to be USD 42.74 billion as of 2022.
5. What are some drivers contributing to market growth?
Increasing Demand from Electronics and Semiconductors Applications; Growing Demand for Super Abrasives.
6. What are the notable trends driving market growth?
Construction Segment to Dominate the Rough Type.
7. Are there any restraints impacting market growth?
Complex Manufacturing Process.
8. Can you provide examples of recent developments in the market?
In February 2022, Element Six UK Ltd collaborated with II-VI Inc. Through this collaboration, II-VI licenses Element Six's intellectual property and necessary equipment would produce high-quality single-crystal diamonds to expand its core competency in diamond technology.
9. What pricing options are available for accessing the report?
Pricing options include single-user, multi-user, and enterprise licenses priced at USD 4750, USD 5250, and USD 8750 respectively.
10. Is the market size provided in terms of value or volume?
The market size is provided in terms of value, measured in billion.
11. Are there any specific market keywords associated with the report?
Yes, the market keyword associated with the report is "Synthetic Diamond Industry," which aids in identifying and referencing the specific market segment covered.
12. How do I determine which pricing option suits my needs best?
The pricing options vary based on user requirements and access needs. Individual users may opt for single-user licenses, while businesses requiring broader access may choose multi-user or enterprise licenses for cost-effective access to the report.
13. Are there any additional resources or data provided in the Synthetic Diamond Industry report?
While the report offers comprehensive insights, it's advisable to review the specific contents or supplementary materials provided to ascertain if additional resources or data are available.
14. How can I stay updated on further developments or reports in the Synthetic Diamond Industry?
To stay informed about further developments, trends, and reports in the Synthetic Diamond Industry, consider subscribing to industry newsletters, following relevant companies and organizations, or regularly checking reputable industry news sources and publications.
Methodology
Step 1 - Identification of Relevant Samples Size from Population Database


Step 2 - Approaches for Defining Global Market Size (Value, Volume* & Price*)

Note*: In applicable scenarios
Step 3 - Data Sources
Primary Research
- Web Analytics
- Survey Reports
- Research Institute
- Latest Research Reports
- Opinion Leaders
Secondary Research
- Annual Reports
- White Paper
- Latest Press Release
- Industry Association
- Paid Database
- Investor Presentations

Step 4 - Data Triangulation
Involves using different sources of information in order to increase the validity of a study
These sources are likely to be stakeholders in a program - participants, other researchers, program staff, other community members, and so on.
Then we put all data in single framework & apply various statistical tools to find out the dynamic on the market.
During the analysis stage, feedback from the stakeholder groups would be compared to determine areas of agreement as well as areas of divergence