

Key Insights
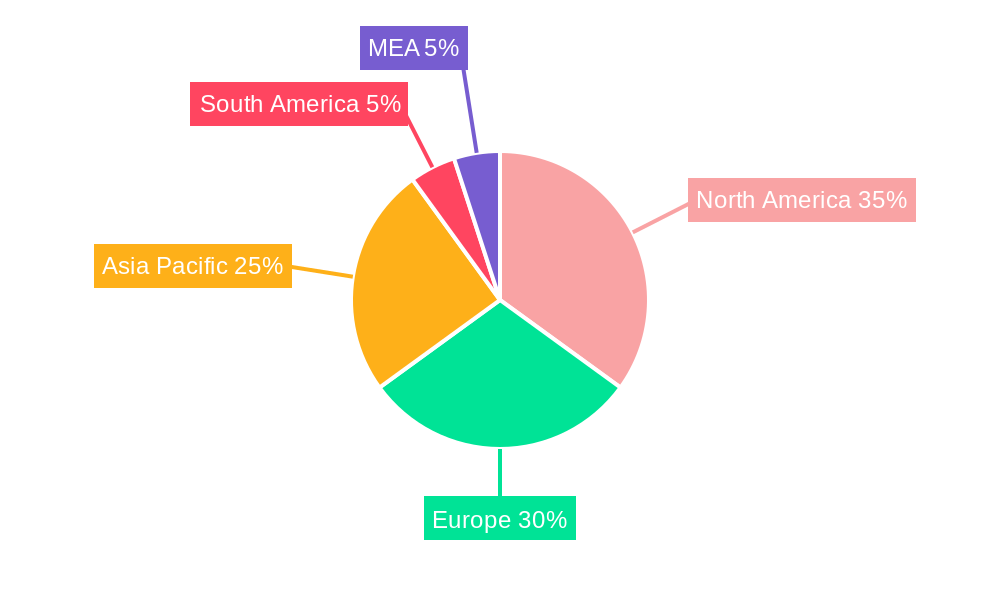
The global tank protection market is experiencing robust growth, driven by increasing demand for enhanced safety and security in various sectors, including transportation, storage, and industrial applications. The market's expansion is fueled by several key factors: stringent government regulations mandating improved tank protection measures, rising concerns over hazardous material transportation, and the growing adoption of advanced insulation materials offering superior protection against extreme temperatures and corrosion. The market is segmented by material type (PU, rockwool, fiberglass, cellular glass, and others) and application (transportation and storage), with polyurethane currently holding a significant market share due to its versatility, cost-effectiveness, and excellent insulating properties. The geographical landscape is diverse, with North America and Europe leading the market due to established infrastructure and stringent safety norms. However, the Asia-Pacific region is poised for significant growth, driven by rapid industrialization and increasing investments in infrastructure development. Competition is intense, with established players like Rockwool International, Owens Corning, and Saint-Gobain vying for market share alongside regional and specialized companies. Future growth will be influenced by technological advancements in material science leading to lighter, more durable, and energy-efficient tank protection solutions, as well as the ongoing shift towards sustainable and environmentally friendly materials.
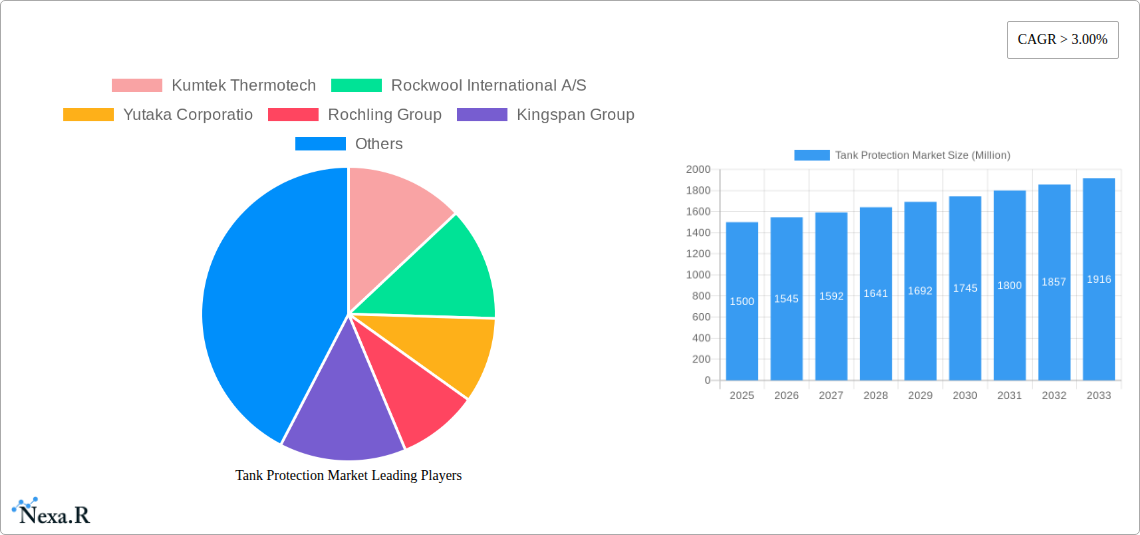
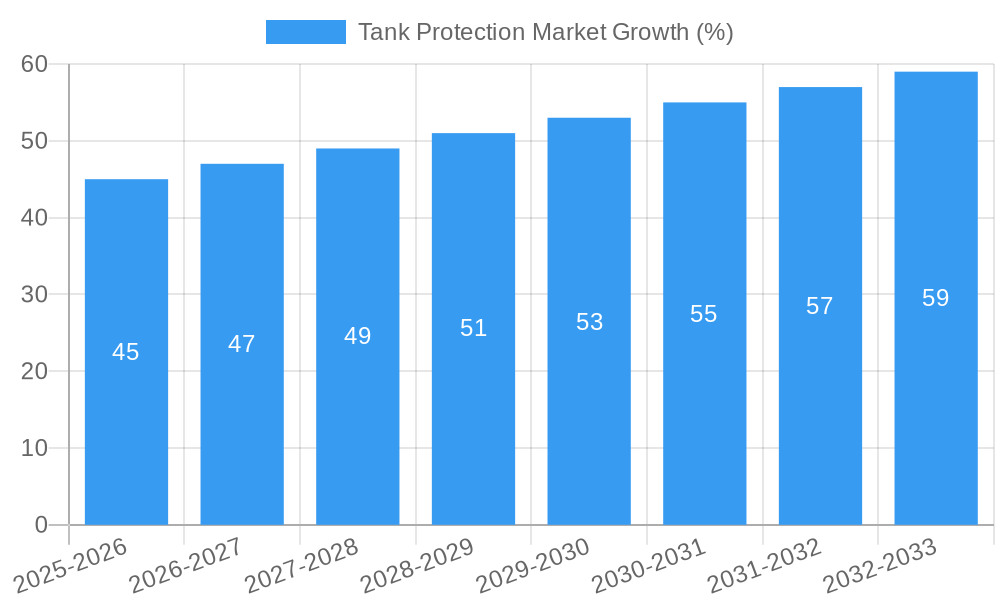
The forecast period (2025-2033) suggests a continued upward trajectory, with the CAGR exceeding 3%. This growth is expected to be propelled by several factors, including the increasing adoption of advanced materials with improved performance characteristics, the ongoing expansion of the global transportation and logistics industry, and the growing focus on enhancing operational efficiency and minimizing risks associated with hazardous material handling. While challenges such as fluctuating raw material prices and potential economic slowdowns could impact market growth, the overall outlook remains positive, indicating significant opportunities for existing players and new entrants in the tank protection market. The ongoing development of innovative solutions, such as self-healing coatings and smart monitoring systems, will further contribute to the market's expansion in the coming years.
Tank Protection Market: A Comprehensive Report (2019-2033)
This comprehensive report provides an in-depth analysis of the Tank Protection Market, encompassing market dynamics, growth trends, regional analysis, product landscape, key players, and future outlook. The report covers the period from 2019 to 2033, with 2025 serving as the base year and the forecast period extending from 2025 to 2033. The market is segmented by material (PU (Polyurethane), Rockwool, Fiberglass, Cellular Glass, Other Materials) and application (Transportation, Storage), offering granular insights into specific market niches. The total market value is projected to reach xx Million units by 2033.
Tank Protection Market Market Dynamics & Structure
The Tank Protection Market exhibits a moderately concentrated structure, with key players holding significant market share. Technological innovation, particularly in material science and application techniques, is a major growth driver. Stringent regulatory frameworks related to environmental protection and safety standards influence market practices. Competitive pressures from substitute products, primarily focusing on cost-effectiveness and longevity, impact market dynamics. End-user demographics, predominantly encompassing industrial and transportation sectors, significantly influence market demand. Mergers and acquisitions (M&A) activity has been moderate, with notable examples such as Saint Gobain’s acquisition of Rockwool India in February 2022.
- Market Concentration: Moderately concentrated, with top 5 players holding approximately xx% market share in 2025.
- Technological Innovation: Focus on developing high-performance, environmentally friendly materials and improved application methods.
- Regulatory Framework: Compliance with environmental regulations and safety standards is crucial.
- Competitive Substitutes: Coatings and other protective solutions pose competitive challenges.
- M&A Activity: Moderate level of consolidation, with strategic acquisitions driving growth. The M&A deal volume averaged xx deals per year between 2019 and 2024.
- Innovation Barriers: High R&D costs and stringent regulatory approvals hinder rapid innovation.
Tank Protection Market Growth Trends & Insights
The Tank Protection Market experienced substantial growth during the historical period (2019-2024), driven by increasing demand from various sectors. The market size witnessed a Compound Annual Growth Rate (CAGR) of xx% from 2019 to 2024. Market penetration is high in developed regions but presents significant opportunities in developing economies. Technological advancements in material science and application techniques have propelled market growth. Shifts in consumer behavior towards sustainability and cost-effectiveness are influencing product preferences. The forecast period (2025-2033) anticipates a CAGR of xx%, driven by ongoing industrialization, infrastructure development, and the growing emphasis on asset protection.
Dominant Regions, Countries, or Segments in Tank Protection Market
The North American and European regions currently dominate the Tank Protection Market, followed by Asia-Pacific. Within the material segment, PU (Polyurethane) holds the largest market share due to its versatility and cost-effectiveness. The Storage application segment is the largest, driven by the need to protect large-scale storage tanks from corrosion and environmental degradation.
- Key Drivers (North America): Stringent environmental regulations, robust industrial sector, and high infrastructure spending.
- Key Drivers (Europe): Focus on sustainability, stringent safety standards, and well-established industrial base.
- Key Drivers (Asia-Pacific): Rapid industrialization, rising infrastructure investments, and increasing energy demands.
- Material Segment: PU (Polyurethane) leads due to cost-effectiveness and performance.
- Application Segment: Storage sector dominates due to high demand for large-scale tank protection.
Tank Protection Market Product Landscape
The Tank Protection Market offers a range of products, including polyurethane-based coatings, fiberglass reinforced plastics, rockwool insulation, and cellular glass. These materials are selected based on specific application requirements, such as chemical resistance, temperature tolerance, and cost considerations. Technological advancements focus on improving material performance, reducing application time, and enhancing durability. Unique selling propositions include superior corrosion resistance, enhanced thermal insulation, and improved fire protection properties.
Key Drivers, Barriers & Challenges in Tank Protection Market
Key Drivers:
- Increasing industrialization and infrastructure development globally.
- Growing demand for enhanced corrosion and fire protection.
- Stringent environmental regulations promoting sustainable solutions.
Key Challenges:
- Fluctuations in raw material prices impacting production costs. The increase in raw material prices between 2022 and 2023 resulted in an estimated xx% increase in production costs.
- Supply chain disruptions leading to production delays and increased costs.
- Intense competition from established and emerging players.
Emerging Opportunities in Tank Protection Market
- Growing demand for specialized tank protection solutions in niche sectors (e.g., offshore oil and gas).
- Increasing adoption of sustainable and eco-friendly materials.
- Expansion into developing markets with significant growth potential.
Growth Accelerators in the Tank Protection Market Industry
Technological breakthroughs in material science and application techniques are primary growth catalysts. Strategic partnerships and collaborations are expanding market reach and driving innovation. Market expansion into new geographic regions and applications fuels ongoing growth.
Key Players Shaping the Tank Protection Market Market
- Kumtek Thermotech
- Rockwool International A/S
- Yutaka Corporatio
- Rochling Group
- Kingspan Group
- Owens Corning
- Archtech Building Systems (Nova Guard)
- Saint Gobain
- Armacell International SA
Notable Milestones in Tank Protection Market Sector
- September 2022: Northern Technologies International Corporation secured a contract with BP Exploration Limited for chemical corrosion protection services on 12 storage tanks. This demonstrates growing demand for specialized protection solutions in the energy sector.
- February 2022: Saint Gobain’s acquisition of Rockwool India expanded its insulation solutions portfolio, strengthening its market position.
In-Depth Tank Protection Market Market Outlook
The Tank Protection Market is poised for continued growth, driven by sustained infrastructure development, increasing industrial activity, and heightened focus on asset protection. Strategic investments in R&D, expansion into emerging markets, and the adoption of sustainable solutions present lucrative opportunities for market players. The market is expected to reach xx Million units by 2033, indicating a promising future for this sector.
Tank Protection Market Segmentation
-
1. Material
- 1.1. PU (Polyurethane)
- 1.2. Rockwool
- 1.3. Fiberglass
- 1.4. Cellular Glass
- 1.5. Other Materials
-
2. Application
- 2.1. Transportation
- 2.2. Storage
Tank Protection Market Segmentation By Geography
-
1. North America
- 1.1. United States
- 1.2. Canada
- 1.3. Mexico
- 1.4. Rest of North America
-
2. South America
- 2.1. Brazil
- 2.2. Venezuela
- 2.3. Rest of South America
-
3. Europe
- 3.1. Norway
- 3.2. United Kingdom
- 3.3. Russian Federation
- 3.4. Rest of Europe
-
4. Middle East and Africa
- 4.1. Saudi Arabia
- 4.2. United Arab Emirates
- 4.3. Qatar
- 4.4. Iran
- 4.5. Nigeria
- 4.6. Algeria
- 4.7. Rest of Middle East and Africa
-
5. Asia Pacific
- 5.1. China
- 5.2. India
- 5.3. Japan
- 5.4. Australia
- 5.5. Rest of Asia Pacific
Tank Protection Market REPORT HIGHLIGHTS
| Aspects | Details |
|---|---|
| Study Period | 2019-2033 |
| Base Year | 2024 |
| Estimated Year | 2025 |
| Forecast Period | 2025-2033 |
| Historical Period | 2019-2024 |
| Growth Rate | CAGR of > 3.00% from 2019-2033 |
| Segmentation |
|
Table of Contents
- 1. Introduction
- 1.1. Research Scope
- 1.2. Market Segmentation
- 1.3. Research Methodology
- 1.4. Definitions and Assumptions
- 2. Executive Summary
- 2.1. Introduction
- 3. Market Dynamics
- 3.1. Introduction
- 3.2. Market Drivers
- 3.2.1. 4.; Increasing Demand for Backup Applications in Data Centers4.; Rising Power Outages to Increase the Demand for UPS
- 3.3. Market Restrains
- 3.3.1. 4.; High Capital Cost and Operation Expenditure of UPS Systems
- 3.4. Market Trends
- 3.4.1. Polyurethane Expected to Witness Significant Growth
- 4. Market Factor Analysis
- 4.1. Porters Five Forces
- 4.2. Supply/Value Chain
- 4.3. PESTEL analysis
- 4.4. Market Entropy
- 4.5. Patent/Trademark Analysis
- 5. Global Tank Protection Market Analysis, Insights and Forecast, 2019-2031
- 5.1. Market Analysis, Insights and Forecast - by Material
- 5.1.1. PU (Polyurethane)
- 5.1.2. Rockwool
- 5.1.3. Fiberglass
- 5.1.4. Cellular Glass
- 5.1.5. Other Materials
- 5.2. Market Analysis, Insights and Forecast - by Application
- 5.2.1. Transportation
- 5.2.2. Storage
- 5.3. Market Analysis, Insights and Forecast - by Region
- 5.3.1. North America
- 5.3.2. South America
- 5.3.3. Europe
- 5.3.4. Middle East and Africa
- 5.3.5. Asia Pacific
- 5.1. Market Analysis, Insights and Forecast - by Material
- 6. North America Tank Protection Market Analysis, Insights and Forecast, 2019-2031
- 6.1. Market Analysis, Insights and Forecast - by Material
- 6.1.1. PU (Polyurethane)
- 6.1.2. Rockwool
- 6.1.3. Fiberglass
- 6.1.4. Cellular Glass
- 6.1.5. Other Materials
- 6.2. Market Analysis, Insights and Forecast - by Application
- 6.2.1. Transportation
- 6.2.2. Storage
- 6.1. Market Analysis, Insights and Forecast - by Material
- 7. South America Tank Protection Market Analysis, Insights and Forecast, 2019-2031
- 7.1. Market Analysis, Insights and Forecast - by Material
- 7.1.1. PU (Polyurethane)
- 7.1.2. Rockwool
- 7.1.3. Fiberglass
- 7.1.4. Cellular Glass
- 7.1.5. Other Materials
- 7.2. Market Analysis, Insights and Forecast - by Application
- 7.2.1. Transportation
- 7.2.2. Storage
- 7.1. Market Analysis, Insights and Forecast - by Material
- 8. Europe Tank Protection Market Analysis, Insights and Forecast, 2019-2031
- 8.1. Market Analysis, Insights and Forecast - by Material
- 8.1.1. PU (Polyurethane)
- 8.1.2. Rockwool
- 8.1.3. Fiberglass
- 8.1.4. Cellular Glass
- 8.1.5. Other Materials
- 8.2. Market Analysis, Insights and Forecast - by Application
- 8.2.1. Transportation
- 8.2.2. Storage
- 8.1. Market Analysis, Insights and Forecast - by Material
- 9. Middle East and Africa Tank Protection Market Analysis, Insights and Forecast, 2019-2031
- 9.1. Market Analysis, Insights and Forecast - by Material
- 9.1.1. PU (Polyurethane)
- 9.1.2. Rockwool
- 9.1.3. Fiberglass
- 9.1.4. Cellular Glass
- 9.1.5. Other Materials
- 9.2. Market Analysis, Insights and Forecast - by Application
- 9.2.1. Transportation
- 9.2.2. Storage
- 9.1. Market Analysis, Insights and Forecast - by Material
- 10. Asia Pacific Tank Protection Market Analysis, Insights and Forecast, 2019-2031
- 10.1. Market Analysis, Insights and Forecast - by Material
- 10.1.1. PU (Polyurethane)
- 10.1.2. Rockwool
- 10.1.3. Fiberglass
- 10.1.4. Cellular Glass
- 10.1.5. Other Materials
- 10.2. Market Analysis, Insights and Forecast - by Application
- 10.2.1. Transportation
- 10.2.2. Storage
- 10.1. Market Analysis, Insights and Forecast - by Material
- 11. North America Tank Protection Market Analysis, Insights and Forecast, 2019-2031
- 11.1. Market Analysis, Insights and Forecast - By Country/Sub-region
- 11.1.1 United States
- 11.1.2 Canada
- 11.1.3 Mexico
- 12. Europe Tank Protection Market Analysis, Insights and Forecast, 2019-2031
- 12.1. Market Analysis, Insights and Forecast - By Country/Sub-region
- 12.1.1 Germany
- 12.1.2 United Kingdom
- 12.1.3 France
- 12.1.4 Spain
- 12.1.5 Italy
- 12.1.6 Spain
- 12.1.7 Belgium
- 12.1.8 Netherland
- 12.1.9 Nordics
- 12.1.10 Rest of Europe
- 13. Asia Pacific Tank Protection Market Analysis, Insights and Forecast, 2019-2031
- 13.1. Market Analysis, Insights and Forecast - By Country/Sub-region
- 13.1.1 China
- 13.1.2 Japan
- 13.1.3 India
- 13.1.4 South Korea
- 13.1.5 Southeast Asia
- 13.1.6 Australia
- 13.1.7 Indonesia
- 13.1.8 Phillipes
- 13.1.9 Singapore
- 13.1.10 Thailandc
- 13.1.11 Rest of Asia Pacific
- 14. South America Tank Protection Market Analysis, Insights and Forecast, 2019-2031
- 14.1. Market Analysis, Insights and Forecast - By Country/Sub-region
- 14.1.1 Brazil
- 14.1.2 Argentina
- 14.1.3 Peru
- 14.1.4 Chile
- 14.1.5 Colombia
- 14.1.6 Ecuador
- 14.1.7 Venezuela
- 14.1.8 Rest of South America
- 15. MEA Tank Protection Market Analysis, Insights and Forecast, 2019-2031
- 15.1. Market Analysis, Insights and Forecast - By Country/Sub-region
- 15.1.1 United Arab Emirates
- 15.1.2 Saudi Arabia
- 15.1.3 South Africa
- 15.1.4 Rest of Middle East and Africa
- 16. Competitive Analysis
- 16.1. Global Market Share Analysis 2024
- 16.2. Company Profiles
- 16.2.1 Kumtek Thermotech
- 16.2.1.1. Overview
- 16.2.1.2. Products
- 16.2.1.3. SWOT Analysis
- 16.2.1.4. Recent Developments
- 16.2.1.5. Financials (Based on Availability)
- 16.2.2 Rockwool International A/S
- 16.2.2.1. Overview
- 16.2.2.2. Products
- 16.2.2.3. SWOT Analysis
- 16.2.2.4. Recent Developments
- 16.2.2.5. Financials (Based on Availability)
- 16.2.3 Yutaka Corporatio
- 16.2.3.1. Overview
- 16.2.3.2. Products
- 16.2.3.3. SWOT Analysis
- 16.2.3.4. Recent Developments
- 16.2.3.5. Financials (Based on Availability)
- 16.2.4 Rochling Group
- 16.2.4.1. Overview
- 16.2.4.2. Products
- 16.2.4.3. SWOT Analysis
- 16.2.4.4. Recent Developments
- 16.2.4.5. Financials (Based on Availability)
- 16.2.5 Kingspan Group
- 16.2.5.1. Overview
- 16.2.5.2. Products
- 16.2.5.3. SWOT Analysis
- 16.2.5.4. Recent Developments
- 16.2.5.5. Financials (Based on Availability)
- 16.2.6 Owens Corning
- 16.2.6.1. Overview
- 16.2.6.2. Products
- 16.2.6.3. SWOT Analysis
- 16.2.6.4. Recent Developments
- 16.2.6.5. Financials (Based on Availability)
- 16.2.7 Archtech Building Systems (Nova Guard)
- 16.2.7.1. Overview
- 16.2.7.2. Products
- 16.2.7.3. SWOT Analysis
- 16.2.7.4. Recent Developments
- 16.2.7.5. Financials (Based on Availability)
- 16.2.8 Saint Gobain
- 16.2.8.1. Overview
- 16.2.8.2. Products
- 16.2.8.3. SWOT Analysis
- 16.2.8.4. Recent Developments
- 16.2.8.5. Financials (Based on Availability)
- 16.2.9 Armacell International SA
- 16.2.9.1. Overview
- 16.2.9.2. Products
- 16.2.9.3. SWOT Analysis
- 16.2.9.4. Recent Developments
- 16.2.9.5. Financials (Based on Availability)
- 16.2.1 Kumtek Thermotech
List of Figures
- Figure 1: Global Tank Protection Market Revenue Breakdown (Million, %) by Region 2024 & 2032
- Figure 2: North America Tank Protection Market Revenue (Million), by Country 2024 & 2032
- Figure 3: North America Tank Protection Market Revenue Share (%), by Country 2024 & 2032
- Figure 4: Europe Tank Protection Market Revenue (Million), by Country 2024 & 2032
- Figure 5: Europe Tank Protection Market Revenue Share (%), by Country 2024 & 2032
- Figure 6: Asia Pacific Tank Protection Market Revenue (Million), by Country 2024 & 2032
- Figure 7: Asia Pacific Tank Protection Market Revenue Share (%), by Country 2024 & 2032
- Figure 8: South America Tank Protection Market Revenue (Million), by Country 2024 & 2032
- Figure 9: South America Tank Protection Market Revenue Share (%), by Country 2024 & 2032
- Figure 10: MEA Tank Protection Market Revenue (Million), by Country 2024 & 2032
- Figure 11: MEA Tank Protection Market Revenue Share (%), by Country 2024 & 2032
- Figure 12: North America Tank Protection Market Revenue (Million), by Material 2024 & 2032
- Figure 13: North America Tank Protection Market Revenue Share (%), by Material 2024 & 2032
- Figure 14: North America Tank Protection Market Revenue (Million), by Application 2024 & 2032
- Figure 15: North America Tank Protection Market Revenue Share (%), by Application 2024 & 2032
- Figure 16: North America Tank Protection Market Revenue (Million), by Country 2024 & 2032
- Figure 17: North America Tank Protection Market Revenue Share (%), by Country 2024 & 2032
- Figure 18: South America Tank Protection Market Revenue (Million), by Material 2024 & 2032
- Figure 19: South America Tank Protection Market Revenue Share (%), by Material 2024 & 2032
- Figure 20: South America Tank Protection Market Revenue (Million), by Application 2024 & 2032
- Figure 21: South America Tank Protection Market Revenue Share (%), by Application 2024 & 2032
- Figure 22: South America Tank Protection Market Revenue (Million), by Country 2024 & 2032
- Figure 23: South America Tank Protection Market Revenue Share (%), by Country 2024 & 2032
- Figure 24: Europe Tank Protection Market Revenue (Million), by Material 2024 & 2032
- Figure 25: Europe Tank Protection Market Revenue Share (%), by Material 2024 & 2032
- Figure 26: Europe Tank Protection Market Revenue (Million), by Application 2024 & 2032
- Figure 27: Europe Tank Protection Market Revenue Share (%), by Application 2024 & 2032
- Figure 28: Europe Tank Protection Market Revenue (Million), by Country 2024 & 2032
- Figure 29: Europe Tank Protection Market Revenue Share (%), by Country 2024 & 2032
- Figure 30: Middle East and Africa Tank Protection Market Revenue (Million), by Material 2024 & 2032
- Figure 31: Middle East and Africa Tank Protection Market Revenue Share (%), by Material 2024 & 2032
- Figure 32: Middle East and Africa Tank Protection Market Revenue (Million), by Application 2024 & 2032
- Figure 33: Middle East and Africa Tank Protection Market Revenue Share (%), by Application 2024 & 2032
- Figure 34: Middle East and Africa Tank Protection Market Revenue (Million), by Country 2024 & 2032
- Figure 35: Middle East and Africa Tank Protection Market Revenue Share (%), by Country 2024 & 2032
- Figure 36: Asia Pacific Tank Protection Market Revenue (Million), by Material 2024 & 2032
- Figure 37: Asia Pacific Tank Protection Market Revenue Share (%), by Material 2024 & 2032
- Figure 38: Asia Pacific Tank Protection Market Revenue (Million), by Application 2024 & 2032
- Figure 39: Asia Pacific Tank Protection Market Revenue Share (%), by Application 2024 & 2032
- Figure 40: Asia Pacific Tank Protection Market Revenue (Million), by Country 2024 & 2032
- Figure 41: Asia Pacific Tank Protection Market Revenue Share (%), by Country 2024 & 2032
List of Tables
- Table 1: Global Tank Protection Market Revenue Million Forecast, by Region 2019 & 2032
- Table 2: Global Tank Protection Market Revenue Million Forecast, by Material 2019 & 2032
- Table 3: Global Tank Protection Market Revenue Million Forecast, by Application 2019 & 2032
- Table 4: Global Tank Protection Market Revenue Million Forecast, by Region 2019 & 2032
- Table 5: Global Tank Protection Market Revenue Million Forecast, by Country 2019 & 2032
- Table 6: United States Tank Protection Market Revenue (Million) Forecast, by Application 2019 & 2032
- Table 7: Canada Tank Protection Market Revenue (Million) Forecast, by Application 2019 & 2032
- Table 8: Mexico Tank Protection Market Revenue (Million) Forecast, by Application 2019 & 2032
- Table 9: Global Tank Protection Market Revenue Million Forecast, by Country 2019 & 2032
- Table 10: Germany Tank Protection Market Revenue (Million) Forecast, by Application 2019 & 2032
- Table 11: United Kingdom Tank Protection Market Revenue (Million) Forecast, by Application 2019 & 2032
- Table 12: France Tank Protection Market Revenue (Million) Forecast, by Application 2019 & 2032
- Table 13: Spain Tank Protection Market Revenue (Million) Forecast, by Application 2019 & 2032
- Table 14: Italy Tank Protection Market Revenue (Million) Forecast, by Application 2019 & 2032
- Table 15: Spain Tank Protection Market Revenue (Million) Forecast, by Application 2019 & 2032
- Table 16: Belgium Tank Protection Market Revenue (Million) Forecast, by Application 2019 & 2032
- Table 17: Netherland Tank Protection Market Revenue (Million) Forecast, by Application 2019 & 2032
- Table 18: Nordics Tank Protection Market Revenue (Million) Forecast, by Application 2019 & 2032
- Table 19: Rest of Europe Tank Protection Market Revenue (Million) Forecast, by Application 2019 & 2032
- Table 20: Global Tank Protection Market Revenue Million Forecast, by Country 2019 & 2032
- Table 21: China Tank Protection Market Revenue (Million) Forecast, by Application 2019 & 2032
- Table 22: Japan Tank Protection Market Revenue (Million) Forecast, by Application 2019 & 2032
- Table 23: India Tank Protection Market Revenue (Million) Forecast, by Application 2019 & 2032
- Table 24: South Korea Tank Protection Market Revenue (Million) Forecast, by Application 2019 & 2032
- Table 25: Southeast Asia Tank Protection Market Revenue (Million) Forecast, by Application 2019 & 2032
- Table 26: Australia Tank Protection Market Revenue (Million) Forecast, by Application 2019 & 2032
- Table 27: Indonesia Tank Protection Market Revenue (Million) Forecast, by Application 2019 & 2032
- Table 28: Phillipes Tank Protection Market Revenue (Million) Forecast, by Application 2019 & 2032
- Table 29: Singapore Tank Protection Market Revenue (Million) Forecast, by Application 2019 & 2032
- Table 30: Thailandc Tank Protection Market Revenue (Million) Forecast, by Application 2019 & 2032
- Table 31: Rest of Asia Pacific Tank Protection Market Revenue (Million) Forecast, by Application 2019 & 2032
- Table 32: Global Tank Protection Market Revenue Million Forecast, by Country 2019 & 2032
- Table 33: Brazil Tank Protection Market Revenue (Million) Forecast, by Application 2019 & 2032
- Table 34: Argentina Tank Protection Market Revenue (Million) Forecast, by Application 2019 & 2032
- Table 35: Peru Tank Protection Market Revenue (Million) Forecast, by Application 2019 & 2032
- Table 36: Chile Tank Protection Market Revenue (Million) Forecast, by Application 2019 & 2032
- Table 37: Colombia Tank Protection Market Revenue (Million) Forecast, by Application 2019 & 2032
- Table 38: Ecuador Tank Protection Market Revenue (Million) Forecast, by Application 2019 & 2032
- Table 39: Venezuela Tank Protection Market Revenue (Million) Forecast, by Application 2019 & 2032
- Table 40: Rest of South America Tank Protection Market Revenue (Million) Forecast, by Application 2019 & 2032
- Table 41: Global Tank Protection Market Revenue Million Forecast, by Country 2019 & 2032
- Table 42: United Arab Emirates Tank Protection Market Revenue (Million) Forecast, by Application 2019 & 2032
- Table 43: Saudi Arabia Tank Protection Market Revenue (Million) Forecast, by Application 2019 & 2032
- Table 44: South Africa Tank Protection Market Revenue (Million) Forecast, by Application 2019 & 2032
- Table 45: Rest of Middle East and Africa Tank Protection Market Revenue (Million) Forecast, by Application 2019 & 2032
- Table 46: Global Tank Protection Market Revenue Million Forecast, by Material 2019 & 2032
- Table 47: Global Tank Protection Market Revenue Million Forecast, by Application 2019 & 2032
- Table 48: Global Tank Protection Market Revenue Million Forecast, by Country 2019 & 2032
- Table 49: United States Tank Protection Market Revenue (Million) Forecast, by Application 2019 & 2032
- Table 50: Canada Tank Protection Market Revenue (Million) Forecast, by Application 2019 & 2032
- Table 51: Mexico Tank Protection Market Revenue (Million) Forecast, by Application 2019 & 2032
- Table 52: Rest of North America Tank Protection Market Revenue (Million) Forecast, by Application 2019 & 2032
- Table 53: Global Tank Protection Market Revenue Million Forecast, by Material 2019 & 2032
- Table 54: Global Tank Protection Market Revenue Million Forecast, by Application 2019 & 2032
- Table 55: Global Tank Protection Market Revenue Million Forecast, by Country 2019 & 2032
- Table 56: Brazil Tank Protection Market Revenue (Million) Forecast, by Application 2019 & 2032
- Table 57: Venezuela Tank Protection Market Revenue (Million) Forecast, by Application 2019 & 2032
- Table 58: Rest of South America Tank Protection Market Revenue (Million) Forecast, by Application 2019 & 2032
- Table 59: Global Tank Protection Market Revenue Million Forecast, by Material 2019 & 2032
- Table 60: Global Tank Protection Market Revenue Million Forecast, by Application 2019 & 2032
- Table 61: Global Tank Protection Market Revenue Million Forecast, by Country 2019 & 2032
- Table 62: Norway Tank Protection Market Revenue (Million) Forecast, by Application 2019 & 2032
- Table 63: United Kingdom Tank Protection Market Revenue (Million) Forecast, by Application 2019 & 2032
- Table 64: Russian Federation Tank Protection Market Revenue (Million) Forecast, by Application 2019 & 2032
- Table 65: Rest of Europe Tank Protection Market Revenue (Million) Forecast, by Application 2019 & 2032
- Table 66: Global Tank Protection Market Revenue Million Forecast, by Material 2019 & 2032
- Table 67: Global Tank Protection Market Revenue Million Forecast, by Application 2019 & 2032
- Table 68: Global Tank Protection Market Revenue Million Forecast, by Country 2019 & 2032
- Table 69: Saudi Arabia Tank Protection Market Revenue (Million) Forecast, by Application 2019 & 2032
- Table 70: United Arab Emirates Tank Protection Market Revenue (Million) Forecast, by Application 2019 & 2032
- Table 71: Qatar Tank Protection Market Revenue (Million) Forecast, by Application 2019 & 2032
- Table 72: Iran Tank Protection Market Revenue (Million) Forecast, by Application 2019 & 2032
- Table 73: Nigeria Tank Protection Market Revenue (Million) Forecast, by Application 2019 & 2032
- Table 74: Algeria Tank Protection Market Revenue (Million) Forecast, by Application 2019 & 2032
- Table 75: Rest of Middle East and Africa Tank Protection Market Revenue (Million) Forecast, by Application 2019 & 2032
- Table 76: Global Tank Protection Market Revenue Million Forecast, by Material 2019 & 2032
- Table 77: Global Tank Protection Market Revenue Million Forecast, by Application 2019 & 2032
- Table 78: Global Tank Protection Market Revenue Million Forecast, by Country 2019 & 2032
- Table 79: China Tank Protection Market Revenue (Million) Forecast, by Application 2019 & 2032
- Table 80: India Tank Protection Market Revenue (Million) Forecast, by Application 2019 & 2032
- Table 81: Japan Tank Protection Market Revenue (Million) Forecast, by Application 2019 & 2032
- Table 82: Australia Tank Protection Market Revenue (Million) Forecast, by Application 2019 & 2032
- Table 83: Rest of Asia Pacific Tank Protection Market Revenue (Million) Forecast, by Application 2019 & 2032
Frequently Asked Questions
1. What is the projected Compound Annual Growth Rate (CAGR) of the Tank Protection Market?
The projected CAGR is approximately > 3.00%.
2. Which companies are prominent players in the Tank Protection Market?
Key companies in the market include Kumtek Thermotech, Rockwool International A/S, Yutaka Corporatio, Rochling Group, Kingspan Group, Owens Corning, Archtech Building Systems (Nova Guard), Saint Gobain, Armacell International SA.
3. What are the main segments of the Tank Protection Market?
The market segments include Material, Application.
4. Can you provide details about the market size?
The market size is estimated to be USD XX Million as of 2022.
5. What are some drivers contributing to market growth?
4.; Increasing Demand for Backup Applications in Data Centers4.; Rising Power Outages to Increase the Demand for UPS.
6. What are the notable trends driving market growth?
Polyurethane Expected to Witness Significant Growth.
7. Are there any restraints impacting market growth?
4.; High Capital Cost and Operation Expenditure of UPS Systems.
8. Can you provide examples of recent developments in the market?
September 2022: Northern Technologies International Corporation signed an initial contract with BP Exploration Limited p.l.c. to supply chemical corrosion protection services for 12 storage tanks till the end of 2025.
9. What pricing options are available for accessing the report?
Pricing options include single-user, multi-user, and enterprise licenses priced at USD 4750, USD 5250, and USD 8750 respectively.
10. Is the market size provided in terms of value or volume?
The market size is provided in terms of value, measured in Million.
11. Are there any specific market keywords associated with the report?
Yes, the market keyword associated with the report is "Tank Protection Market," which aids in identifying and referencing the specific market segment covered.
12. How do I determine which pricing option suits my needs best?
The pricing options vary based on user requirements and access needs. Individual users may opt for single-user licenses, while businesses requiring broader access may choose multi-user or enterprise licenses for cost-effective access to the report.
13. Are there any additional resources or data provided in the Tank Protection Market report?
While the report offers comprehensive insights, it's advisable to review the specific contents or supplementary materials provided to ascertain if additional resources or data are available.
14. How can I stay updated on further developments or reports in the Tank Protection Market?
To stay informed about further developments, trends, and reports in the Tank Protection Market, consider subscribing to industry newsletters, following relevant companies and organizations, or regularly checking reputable industry news sources and publications.
Methodology
Step 1 - Identification of Relevant Samples Size from Population Database


Step 2 - Approaches for Defining Global Market Size (Value, Volume* & Price*)

Note*: In applicable scenarios
Step 3 - Data Sources
Primary Research
- Web Analytics
- Survey Reports
- Research Institute
- Latest Research Reports
- Opinion Leaders
Secondary Research
- Annual Reports
- White Paper
- Latest Press Release
- Industry Association
- Paid Database
- Investor Presentations

Step 4 - Data Triangulation
Involves using different sources of information in order to increase the validity of a study
These sources are likely to be stakeholders in a program - participants, other researchers, program staff, other community members, and so on.
Then we put all data in single framework & apply various statistical tools to find out the dynamic on the market.
During the analysis stage, feedback from the stakeholder groups would be compared to determine areas of agreement as well as areas of divergence
