

Key Insights
The global toxicology services market is poised for substantial expansion, propelled by escalating pharmaceutical and biotechnology research and development investments, stringent regulatory mandates for drug and chemical safety, and a growing demand for preclinical evaluation. The market, valued at $5.4 billion in the base year of 2025, is projected to achieve a Compound Annual Growth Rate (CAGR) of 1.5%, reaching approximately $6.0 billion by 2033. This growth trajectory is underpinned by several critical drivers. Firstly, the increasing prevalence of chronic diseases is stimulating greater investment in drug discovery and development, thereby elevating the need for comprehensive toxicology assessments. Secondly, heightened awareness of environmental safety, coupled with corresponding regulatory pressures, is compelling organizations to significantly invest in ecotoxicology studies. Thirdly, innovations in toxicological testing methodologies, including in vitro and in silico approaches, are enhancing testing efficiency and cost-effectiveness, further contributing to market expansion. Nonetheless, significant testing expenses and the intricate nature of regulatory approvals present challenges to sustained market growth.
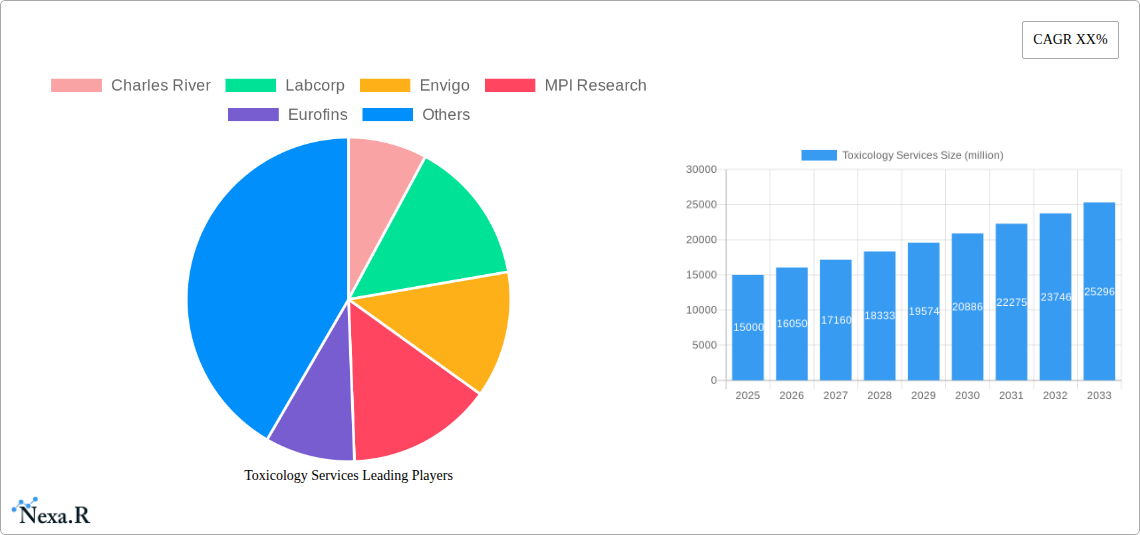
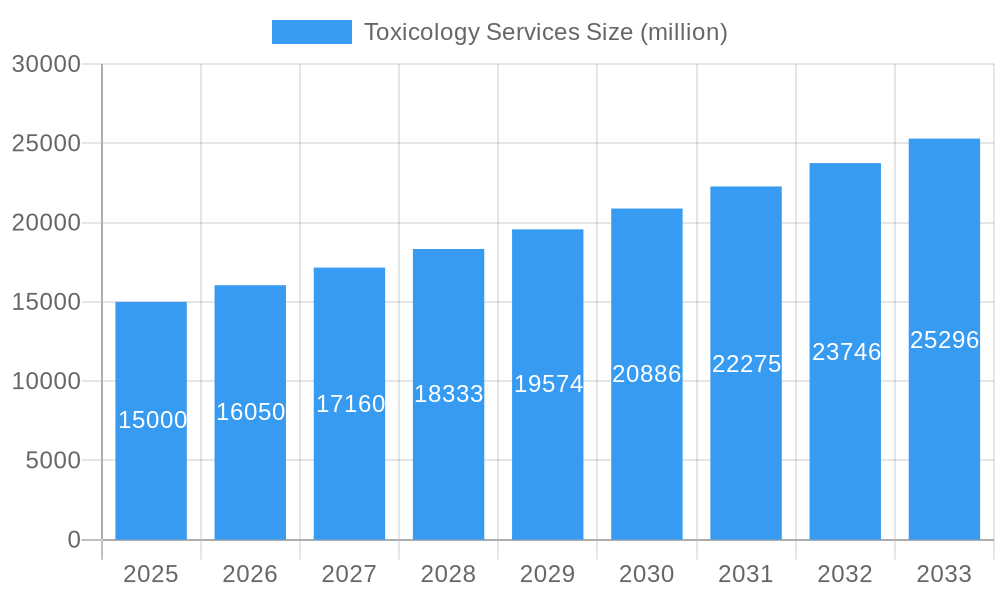
Toxicology Services Market Size (In Billion)
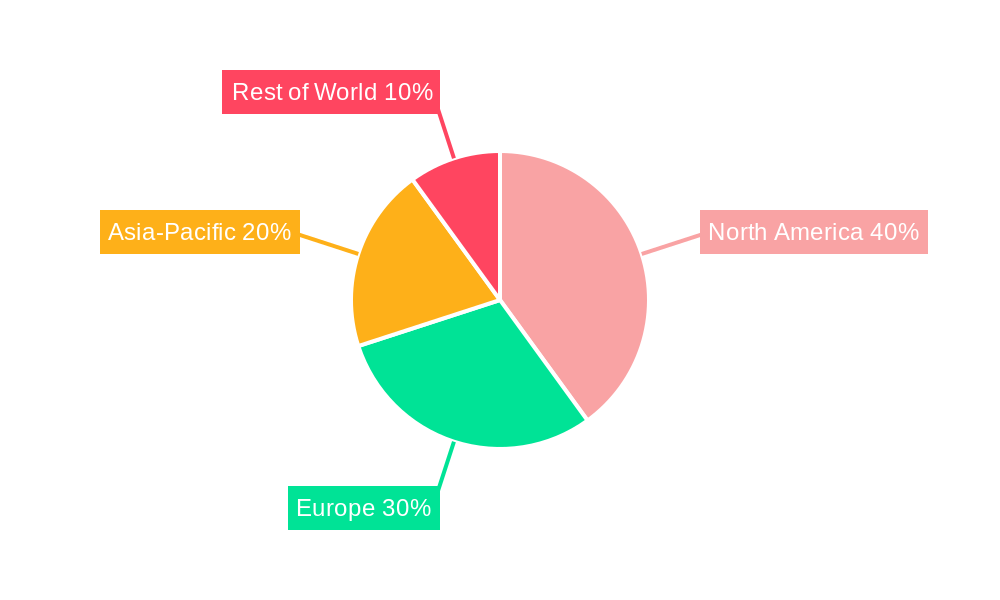
The market is segmented by service type (in vivo, in vitro, and in silico), application (pharmaceutical, agrochemical, cosmetic, and environmental), and geographic region. North America currently dominates the market landscape, attributed to its robust research infrastructure and substantial R&D expenditures. However, the Asia-Pacific region is anticipated to experience considerable growth in the upcoming years, driven by improving healthcare infrastructure and expanding pharmaceutical sectors in key economies such as China and India. Leading industry participants in the toxicology services sector include Charles River Laboratories, Labcorp, Envigo, MPI Research, Eurofins Scientific, Wuxi Apptec, SGS, Merck KGaA, Evotec SE, and Bureau Veritas. These entities are continuously investing in technological advancements and strategic collaborations to secure their competitive positions and address the escalating demand for novel toxicology solutions. The competitive environment is characterized by both organic and inorganic growth strategies, encompassing mergers, acquisitions, and alliances aimed at broadening service portfolios and expanding market reach.
Toxicology Services Company Market Share
Toxicology Services Market Report: 2019-2033
This comprehensive report provides an in-depth analysis of the global toxicology services market, offering invaluable insights for industry professionals, investors, and strategic decision-makers. With a study period spanning 2019-2033, a base year of 2025, and a forecast period of 2025-2033, this report meticulously examines market dynamics, growth trends, key players, and emerging opportunities within the parent market of contract research organizations (CROs) and the child market of pharmaceutical and biotechnology. The report leverages extensive data and expert analysis to provide a 360-degree view of this vital sector. The total market size in 2025 is estimated at $XX billion.
Toxicology Services Market Dynamics & Structure
The toxicology services market is characterized by moderate concentration, with key players such as Charles River, Labcorp, and Eurofins holding significant market share. The market's structure is influenced by technological advancements, stringent regulatory frameworks (e.g., GLP, OECD guidelines), and the increasing availability of competitive product substitutes like in silico toxicology tools. End-user demographics are primarily pharmaceutical and biotech companies, alongside chemical manufacturers and consumer goods producers. M&A activity has been significant, with an estimated xx deals in the historical period (2019-2024), driving consolidation and expansion within the sector.
- Market Concentration: Moderately concentrated, with top 5 players holding xx% market share in 2025.
- Technological Innovation: Driven by advancements in high-throughput screening, omics technologies, and AI-powered predictive modeling. Barriers include high R&D costs and the need for regulatory validation.
- Regulatory Framework: Stringent GLP compliance and evolving international guidelines shape market practices and investment strategies.
- Competitive Substitutes: In silico toxicology methods are emerging as cost-effective alternatives for certain applications, impacting market growth.
- End-User Demographics: Predominantly pharmaceutical & biotech companies (xx%), followed by chemical (xx%) and consumer goods (xx%) manufacturers.
- M&A Trends: Significant consolidation through acquisitions and mergers, with an estimated xx billion in deal value during 2019-2024.
Toxicology Services Growth Trends & Insights
The global toxicology services market exhibited a CAGR of xx% during the historical period (2019-2024), reaching an estimated $XX billion in 2025. This growth is fueled by several factors, including the increasing demand for drug discovery and development, stricter regulatory requirements leading to higher testing needs, and the growing adoption of advanced toxicology techniques. Technological disruptions, such as the integration of AI and machine learning in predictive toxicology, are accelerating market expansion. Shifting consumer preferences towards safer and more effective products are also contributing to growth. Market penetration is xx% in 2025, with significant potential for further growth in emerging markets. The forecast period (2025-2033) projects a CAGR of xx%, driven by continued technological advancements and expansion into new therapeutic areas.
Dominant Regions, Countries, or Segments in Toxicology Services
North America currently dominates the toxicology services market, accounting for xx% of global revenue in 2025, followed by Europe (xx%) and Asia Pacific (xx%). This dominance is attributed to the presence of major pharmaceutical and biotech companies, advanced research infrastructure, and robust regulatory frameworks. However, Asia Pacific is expected to experience the fastest growth during the forecast period, driven by increasing healthcare spending, a growing pharmaceutical industry, and supportive government policies.
- North America: Strong presence of major players, well-established regulatory frameworks, high R&D spending.
- Europe: Significant pharmaceutical industry, stringent regulations driving demand for high-quality services.
- Asia Pacific: Rapidly growing pharmaceutical and biotech sectors, increasing healthcare investment, significant untapped market potential.
Toxicology Services Product Landscape
The toxicology services market offers a diverse range of products and services, including in vitro and in vivo studies, GLP-compliant testing, ADME-Tox assessments, and specialized services like immunotoxicology and genotoxicity testing. Recent innovations focus on high-throughput screening platforms, advanced analytical techniques, and the integration of big data analytics for improved efficiency and accuracy. Unique selling propositions include faster turnaround times, customized solutions, and specialized expertise in niche areas. Technological advancements are continuously improving the sensitivity, specificity, and cost-effectiveness of toxicology testing.
Key Drivers, Barriers & Challenges in Toxicology Services
Key Drivers:
- Increasing demand for new drug development and approvals.
- Stringent regulatory requirements mandating comprehensive toxicology testing.
- Advancements in toxicology technologies and methodologies.
Challenges & Restraints:
- High cost of toxicology testing can limit accessibility for smaller companies.
- Regulatory hurdles and variations across different regions can complicate market entry and expansion.
- Intense competition among established players and emerging companies. Estimated xx% decrease in market growth due to price competition in 2024.
Emerging Opportunities in Toxicology Services
- Expansion into emerging markets with growing healthcare sectors.
- Development of innovative in silico and in vitro models to reduce reliance on animal testing.
- Increased demand for personalized medicine and targeted toxicology assessments.
Growth Accelerators in the Toxicology Services Industry
Long-term growth will be driven by strategic partnerships between CROs and pharmaceutical companies, technological breakthroughs in predictive toxicology, and the continued expansion into new therapeutic areas like cell and gene therapy. Furthermore, the development of standardized protocols and harmonization of regulations across different regions will facilitate market growth.
Key Players Shaping the Toxicology Services Market
- Charles River
- Labcorp
- Envigo
- MPI Research
- Eurofins
- Wuxi Apptec
- SGS
- Merck
- Evotec
- Bureau Veritas
Notable Milestones in Toxicology Services Sector
- 2020: Increased adoption of in silico toxicology methods due to pandemic-related restrictions.
- 2021: Several major mergers and acquisitions consolidate the market landscape.
- 2022: Launch of several next-generation toxicology platforms improving efficiency and reducing costs.
- 2023: Increased regulatory focus on environmental toxicology.
In-Depth Toxicology Services Market Outlook
The future of the toxicology services market is bright, driven by continuous technological advancements, increasing regulatory scrutiny, and the expanding pipeline of novel therapeutics. Strategic opportunities exist for companies focusing on innovation, personalized medicine, and expansion into emerging markets. The market is projected to reach $XX billion by 2033, presenting significant growth potential for key players and new entrants.
Toxicology Services Segmentation
-
1. Application
- 1.1. Pharmaceutical
- 1.2. Medical Devices
- 1.3. Cosmetic
- 1.4. Chemical
-
2. Types
- 2.1. Systemic Toxicology
- 2.2. Developmental & Reproductive Toxicology
Toxicology Services Segmentation By Geography
-
1. North America
- 1.1. United States
- 1.2. Canada
- 1.3. Mexico
-
2. South America
- 2.1. Brazil
- 2.2. Argentina
- 2.3. Rest of South America
-
3. Europe
- 3.1. United Kingdom
- 3.2. Germany
- 3.3. France
- 3.4. Italy
- 3.5. Spain
- 3.6. Russia
- 3.7. Benelux
- 3.8. Nordics
- 3.9. Rest of Europe
-
4. Middle East & Africa
- 4.1. Turkey
- 4.2. Israel
- 4.3. GCC
- 4.4. North Africa
- 4.5. South Africa
- 4.6. Rest of Middle East & Africa
-
5. Asia Pacific
- 5.1. China
- 5.2. India
- 5.3. Japan
- 5.4. South Korea
- 5.5. ASEAN
- 5.6. Oceania
- 5.7. Rest of Asia Pacific
Toxicology Services Regional Market Share
Geographic Coverage of Toxicology Services
Toxicology Services REPORT HIGHLIGHTS
| Aspects | Details |
|---|---|
| Study Period | 2020-2034 |
| Base Year | 2025 |
| Estimated Year | 2026 |
| Forecast Period | 2026-2034 |
| Historical Period | 2020-2025 |
| Growth Rate | CAGR of 1.5% from 2020-2034 |
| Segmentation |
|
Table of Contents
- 1. Introduction
- 1.1. Research Scope
- 1.2. Market Segmentation
- 1.3. Research Methodology
- 1.4. Definitions and Assumptions
- 2. Executive Summary
- 2.1. Introduction
- 3. Market Dynamics
- 3.1. Introduction
- 3.2. Market Drivers
- 3.3. Market Restrains
- 3.4. Market Trends
- 4. Market Factor Analysis
- 4.1. Porters Five Forces
- 4.2. Supply/Value Chain
- 4.3. PESTEL analysis
- 4.4. Market Entropy
- 4.5. Patent/Trademark Analysis
- 5. Global Toxicology Services Analysis, Insights and Forecast, 2020-2032
- 5.1. Market Analysis, Insights and Forecast - by Application
- 5.1.1. Pharmaceutical
- 5.1.2. Medical Devices
- 5.1.3. Cosmetic
- 5.1.4. Chemical
- 5.2. Market Analysis, Insights and Forecast - by Types
- 5.2.1. Systemic Toxicology
- 5.2.2. Developmental & Reproductive Toxicology
- 5.3. Market Analysis, Insights and Forecast - by Region
- 5.3.1. North America
- 5.3.2. South America
- 5.3.3. Europe
- 5.3.4. Middle East & Africa
- 5.3.5. Asia Pacific
- 5.1. Market Analysis, Insights and Forecast - by Application
- 6. North America Toxicology Services Analysis, Insights and Forecast, 2020-2032
- 6.1. Market Analysis, Insights and Forecast - by Application
- 6.1.1. Pharmaceutical
- 6.1.2. Medical Devices
- 6.1.3. Cosmetic
- 6.1.4. Chemical
- 6.2. Market Analysis, Insights and Forecast - by Types
- 6.2.1. Systemic Toxicology
- 6.2.2. Developmental & Reproductive Toxicology
- 6.1. Market Analysis, Insights and Forecast - by Application
- 7. South America Toxicology Services Analysis, Insights and Forecast, 2020-2032
- 7.1. Market Analysis, Insights and Forecast - by Application
- 7.1.1. Pharmaceutical
- 7.1.2. Medical Devices
- 7.1.3. Cosmetic
- 7.1.4. Chemical
- 7.2. Market Analysis, Insights and Forecast - by Types
- 7.2.1. Systemic Toxicology
- 7.2.2. Developmental & Reproductive Toxicology
- 7.1. Market Analysis, Insights and Forecast - by Application
- 8. Europe Toxicology Services Analysis, Insights and Forecast, 2020-2032
- 8.1. Market Analysis, Insights and Forecast - by Application
- 8.1.1. Pharmaceutical
- 8.1.2. Medical Devices
- 8.1.3. Cosmetic
- 8.1.4. Chemical
- 8.2. Market Analysis, Insights and Forecast - by Types
- 8.2.1. Systemic Toxicology
- 8.2.2. Developmental & Reproductive Toxicology
- 8.1. Market Analysis, Insights and Forecast - by Application
- 9. Middle East & Africa Toxicology Services Analysis, Insights and Forecast, 2020-2032
- 9.1. Market Analysis, Insights and Forecast - by Application
- 9.1.1. Pharmaceutical
- 9.1.2. Medical Devices
- 9.1.3. Cosmetic
- 9.1.4. Chemical
- 9.2. Market Analysis, Insights and Forecast - by Types
- 9.2.1. Systemic Toxicology
- 9.2.2. Developmental & Reproductive Toxicology
- 9.1. Market Analysis, Insights and Forecast - by Application
- 10. Asia Pacific Toxicology Services Analysis, Insights and Forecast, 2020-2032
- 10.1. Market Analysis, Insights and Forecast - by Application
- 10.1.1. Pharmaceutical
- 10.1.2. Medical Devices
- 10.1.3. Cosmetic
- 10.1.4. Chemical
- 10.2. Market Analysis, Insights and Forecast - by Types
- 10.2.1. Systemic Toxicology
- 10.2.2. Developmental & Reproductive Toxicology
- 10.1. Market Analysis, Insights and Forecast - by Application
- 11. Competitive Analysis
- 11.1. Global Market Share Analysis 2025
- 11.2. Company Profiles
- 11.2.1 Charles River
- 11.2.1.1. Overview
- 11.2.1.2. Products
- 11.2.1.3. SWOT Analysis
- 11.2.1.4. Recent Developments
- 11.2.1.5. Financials (Based on Availability)
- 11.2.2 Labcorp
- 11.2.2.1. Overview
- 11.2.2.2. Products
- 11.2.2.3. SWOT Analysis
- 11.2.2.4. Recent Developments
- 11.2.2.5. Financials (Based on Availability)
- 11.2.3 Envigo
- 11.2.3.1. Overview
- 11.2.3.2. Products
- 11.2.3.3. SWOT Analysis
- 11.2.3.4. Recent Developments
- 11.2.3.5. Financials (Based on Availability)
- 11.2.4 MPI Research
- 11.2.4.1. Overview
- 11.2.4.2. Products
- 11.2.4.3. SWOT Analysis
- 11.2.4.4. Recent Developments
- 11.2.4.5. Financials (Based on Availability)
- 11.2.5 Eurofins
- 11.2.5.1. Overview
- 11.2.5.2. Products
- 11.2.5.3. SWOT Analysis
- 11.2.5.4. Recent Developments
- 11.2.5.5. Financials (Based on Availability)
- 11.2.6 Wuxi Apptec
- 11.2.6.1. Overview
- 11.2.6.2. Products
- 11.2.6.3. SWOT Analysis
- 11.2.6.4. Recent Developments
- 11.2.6.5. Financials (Based on Availability)
- 11.2.7 SGS
- 11.2.7.1. Overview
- 11.2.7.2. Products
- 11.2.7.3. SWOT Analysis
- 11.2.7.4. Recent Developments
- 11.2.7.5. Financials (Based on Availability)
- 11.2.8 Merck
- 11.2.8.1. Overview
- 11.2.8.2. Products
- 11.2.8.3. SWOT Analysis
- 11.2.8.4. Recent Developments
- 11.2.8.5. Financials (Based on Availability)
- 11.2.9 Evotec
- 11.2.9.1. Overview
- 11.2.9.2. Products
- 11.2.9.3. SWOT Analysis
- 11.2.9.4. Recent Developments
- 11.2.9.5. Financials (Based on Availability)
- 11.2.10 Bureau Veritas
- 11.2.10.1. Overview
- 11.2.10.2. Products
- 11.2.10.3. SWOT Analysis
- 11.2.10.4. Recent Developments
- 11.2.10.5. Financials (Based on Availability)
- 11.2.1 Charles River
List of Figures
- Figure 1: Global Toxicology Services Revenue Breakdown (billion, %) by Region 2025 & 2033
- Figure 2: North America Toxicology Services Revenue (billion), by Application 2025 & 2033
- Figure 3: North America Toxicology Services Revenue Share (%), by Application 2025 & 2033
- Figure 4: North America Toxicology Services Revenue (billion), by Types 2025 & 2033
- Figure 5: North America Toxicology Services Revenue Share (%), by Types 2025 & 2033
- Figure 6: North America Toxicology Services Revenue (billion), by Country 2025 & 2033
- Figure 7: North America Toxicology Services Revenue Share (%), by Country 2025 & 2033
- Figure 8: South America Toxicology Services Revenue (billion), by Application 2025 & 2033
- Figure 9: South America Toxicology Services Revenue Share (%), by Application 2025 & 2033
- Figure 10: South America Toxicology Services Revenue (billion), by Types 2025 & 2033
- Figure 11: South America Toxicology Services Revenue Share (%), by Types 2025 & 2033
- Figure 12: South America Toxicology Services Revenue (billion), by Country 2025 & 2033
- Figure 13: South America Toxicology Services Revenue Share (%), by Country 2025 & 2033
- Figure 14: Europe Toxicology Services Revenue (billion), by Application 2025 & 2033
- Figure 15: Europe Toxicology Services Revenue Share (%), by Application 2025 & 2033
- Figure 16: Europe Toxicology Services Revenue (billion), by Types 2025 & 2033
- Figure 17: Europe Toxicology Services Revenue Share (%), by Types 2025 & 2033
- Figure 18: Europe Toxicology Services Revenue (billion), by Country 2025 & 2033
- Figure 19: Europe Toxicology Services Revenue Share (%), by Country 2025 & 2033
- Figure 20: Middle East & Africa Toxicology Services Revenue (billion), by Application 2025 & 2033
- Figure 21: Middle East & Africa Toxicology Services Revenue Share (%), by Application 2025 & 2033
- Figure 22: Middle East & Africa Toxicology Services Revenue (billion), by Types 2025 & 2033
- Figure 23: Middle East & Africa Toxicology Services Revenue Share (%), by Types 2025 & 2033
- Figure 24: Middle East & Africa Toxicology Services Revenue (billion), by Country 2025 & 2033
- Figure 25: Middle East & Africa Toxicology Services Revenue Share (%), by Country 2025 & 2033
- Figure 26: Asia Pacific Toxicology Services Revenue (billion), by Application 2025 & 2033
- Figure 27: Asia Pacific Toxicology Services Revenue Share (%), by Application 2025 & 2033
- Figure 28: Asia Pacific Toxicology Services Revenue (billion), by Types 2025 & 2033
- Figure 29: Asia Pacific Toxicology Services Revenue Share (%), by Types 2025 & 2033
- Figure 30: Asia Pacific Toxicology Services Revenue (billion), by Country 2025 & 2033
- Figure 31: Asia Pacific Toxicology Services Revenue Share (%), by Country 2025 & 2033
List of Tables
- Table 1: Global Toxicology Services Revenue billion Forecast, by Application 2020 & 2033
- Table 2: Global Toxicology Services Revenue billion Forecast, by Types 2020 & 2033
- Table 3: Global Toxicology Services Revenue billion Forecast, by Region 2020 & 2033
- Table 4: Global Toxicology Services Revenue billion Forecast, by Application 2020 & 2033
- Table 5: Global Toxicology Services Revenue billion Forecast, by Types 2020 & 2033
- Table 6: Global Toxicology Services Revenue billion Forecast, by Country 2020 & 2033
- Table 7: United States Toxicology Services Revenue (billion) Forecast, by Application 2020 & 2033
- Table 8: Canada Toxicology Services Revenue (billion) Forecast, by Application 2020 & 2033
- Table 9: Mexico Toxicology Services Revenue (billion) Forecast, by Application 2020 & 2033
- Table 10: Global Toxicology Services Revenue billion Forecast, by Application 2020 & 2033
- Table 11: Global Toxicology Services Revenue billion Forecast, by Types 2020 & 2033
- Table 12: Global Toxicology Services Revenue billion Forecast, by Country 2020 & 2033
- Table 13: Brazil Toxicology Services Revenue (billion) Forecast, by Application 2020 & 2033
- Table 14: Argentina Toxicology Services Revenue (billion) Forecast, by Application 2020 & 2033
- Table 15: Rest of South America Toxicology Services Revenue (billion) Forecast, by Application 2020 & 2033
- Table 16: Global Toxicology Services Revenue billion Forecast, by Application 2020 & 2033
- Table 17: Global Toxicology Services Revenue billion Forecast, by Types 2020 & 2033
- Table 18: Global Toxicology Services Revenue billion Forecast, by Country 2020 & 2033
- Table 19: United Kingdom Toxicology Services Revenue (billion) Forecast, by Application 2020 & 2033
- Table 20: Germany Toxicology Services Revenue (billion) Forecast, by Application 2020 & 2033
- Table 21: France Toxicology Services Revenue (billion) Forecast, by Application 2020 & 2033
- Table 22: Italy Toxicology Services Revenue (billion) Forecast, by Application 2020 & 2033
- Table 23: Spain Toxicology Services Revenue (billion) Forecast, by Application 2020 & 2033
- Table 24: Russia Toxicology Services Revenue (billion) Forecast, by Application 2020 & 2033
- Table 25: Benelux Toxicology Services Revenue (billion) Forecast, by Application 2020 & 2033
- Table 26: Nordics Toxicology Services Revenue (billion) Forecast, by Application 2020 & 2033
- Table 27: Rest of Europe Toxicology Services Revenue (billion) Forecast, by Application 2020 & 2033
- Table 28: Global Toxicology Services Revenue billion Forecast, by Application 2020 & 2033
- Table 29: Global Toxicology Services Revenue billion Forecast, by Types 2020 & 2033
- Table 30: Global Toxicology Services Revenue billion Forecast, by Country 2020 & 2033
- Table 31: Turkey Toxicology Services Revenue (billion) Forecast, by Application 2020 & 2033
- Table 32: Israel Toxicology Services Revenue (billion) Forecast, by Application 2020 & 2033
- Table 33: GCC Toxicology Services Revenue (billion) Forecast, by Application 2020 & 2033
- Table 34: North Africa Toxicology Services Revenue (billion) Forecast, by Application 2020 & 2033
- Table 35: South Africa Toxicology Services Revenue (billion) Forecast, by Application 2020 & 2033
- Table 36: Rest of Middle East & Africa Toxicology Services Revenue (billion) Forecast, by Application 2020 & 2033
- Table 37: Global Toxicology Services Revenue billion Forecast, by Application 2020 & 2033
- Table 38: Global Toxicology Services Revenue billion Forecast, by Types 2020 & 2033
- Table 39: Global Toxicology Services Revenue billion Forecast, by Country 2020 & 2033
- Table 40: China Toxicology Services Revenue (billion) Forecast, by Application 2020 & 2033
- Table 41: India Toxicology Services Revenue (billion) Forecast, by Application 2020 & 2033
- Table 42: Japan Toxicology Services Revenue (billion) Forecast, by Application 2020 & 2033
- Table 43: South Korea Toxicology Services Revenue (billion) Forecast, by Application 2020 & 2033
- Table 44: ASEAN Toxicology Services Revenue (billion) Forecast, by Application 2020 & 2033
- Table 45: Oceania Toxicology Services Revenue (billion) Forecast, by Application 2020 & 2033
- Table 46: Rest of Asia Pacific Toxicology Services Revenue (billion) Forecast, by Application 2020 & 2033
Frequently Asked Questions
1. What is the projected Compound Annual Growth Rate (CAGR) of the Toxicology Services?
The projected CAGR is approximately 1.5%.
2. Which companies are prominent players in the Toxicology Services?
Key companies in the market include Charles River, Labcorp, Envigo, MPI Research, Eurofins, Wuxi Apptec, SGS, Merck, Evotec, Bureau Veritas.
3. What are the main segments of the Toxicology Services?
The market segments include Application, Types.
4. Can you provide details about the market size?
The market size is estimated to be USD 5.4 billion as of 2022.
5. What are some drivers contributing to market growth?
N/A
6. What are the notable trends driving market growth?
N/A
7. Are there any restraints impacting market growth?
N/A
8. Can you provide examples of recent developments in the market?
N/A
9. What pricing options are available for accessing the report?
Pricing options include single-user, multi-user, and enterprise licenses priced at USD 4900.00, USD 7350.00, and USD 9800.00 respectively.
10. Is the market size provided in terms of value or volume?
The market size is provided in terms of value, measured in billion.
11. Are there any specific market keywords associated with the report?
Yes, the market keyword associated with the report is "Toxicology Services," which aids in identifying and referencing the specific market segment covered.
12. How do I determine which pricing option suits my needs best?
The pricing options vary based on user requirements and access needs. Individual users may opt for single-user licenses, while businesses requiring broader access may choose multi-user or enterprise licenses for cost-effective access to the report.
13. Are there any additional resources or data provided in the Toxicology Services report?
While the report offers comprehensive insights, it's advisable to review the specific contents or supplementary materials provided to ascertain if additional resources or data are available.
14. How can I stay updated on further developments or reports in the Toxicology Services?
To stay informed about further developments, trends, and reports in the Toxicology Services, consider subscribing to industry newsletters, following relevant companies and organizations, or regularly checking reputable industry news sources and publications.
Methodology
Step 1 - Identification of Relevant Samples Size from Population Database


Step 2 - Approaches for Defining Global Market Size (Value, Volume* & Price*)

Note*: In applicable scenarios
Step 3 - Data Sources
Primary Research
- Web Analytics
- Survey Reports
- Research Institute
- Latest Research Reports
- Opinion Leaders
Secondary Research
- Annual Reports
- White Paper
- Latest Press Release
- Industry Association
- Paid Database
- Investor Presentations

Step 4 - Data Triangulation
Involves using different sources of information in order to increase the validity of a study
These sources are likely to be stakeholders in a program - participants, other researchers, program staff, other community members, and so on.
Then we put all data in single framework & apply various statistical tools to find out the dynamic on the market.
During the analysis stage, feedback from the stakeholder groups would be compared to determine areas of agreement as well as areas of divergence