

Key Insights
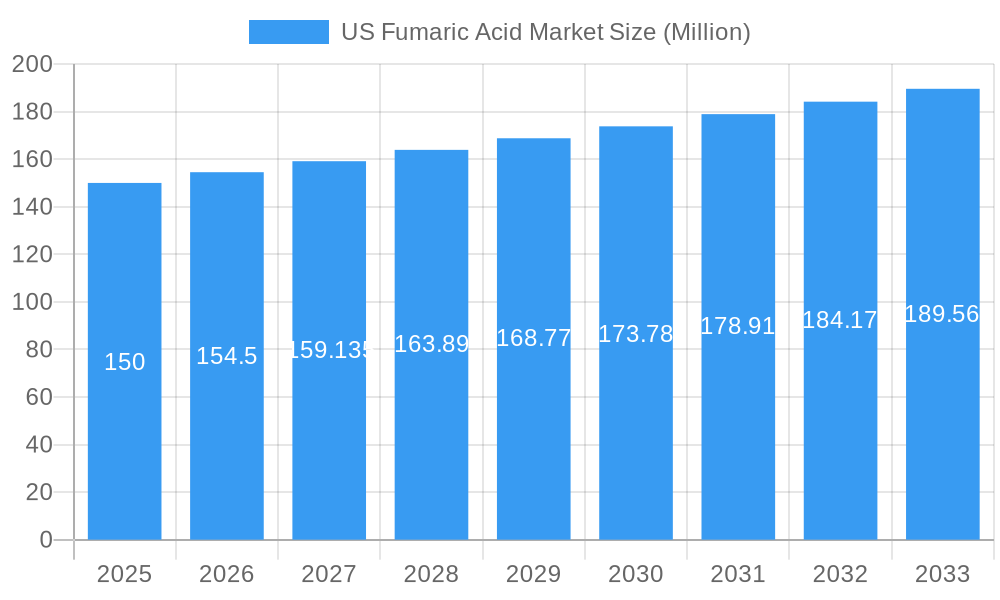
The US fumaric acid market, valued at approximately $150 million in 2025, is projected to experience robust growth, exhibiting a compound annual growth rate (CAGR) exceeding 3% from 2025 to 2033. This expansion is driven by increasing demand across diverse sectors, primarily food and beverages, where fumaric acid acts as an effective acidulant and flavor enhancer. The rising popularity of healthier food options and the growing use of fumaric acid as a preservative contribute significantly to this market segment's growth. Further expansion is fueled by the substantial application in the production of unsaturated polyester resins and alkyd resins within the chemical industry, benefiting from the increasing construction and automotive sectors. The technical grade segment holds a larger market share compared to the food grade segment, reflecting the broad industrial applications of fumaric acid. Regional growth is expected to be relatively even across the US, with the Northeast and West potentially exhibiting slightly higher growth rates due to a concentration of food processing and chemical manufacturing facilities. However, market growth may face some constraints due to the price volatility of raw materials and the availability of substitute acids. Nonetheless, the overall outlook for the US fumaric acid market remains optimistic, driven by continuous innovation in applications and rising global demand.
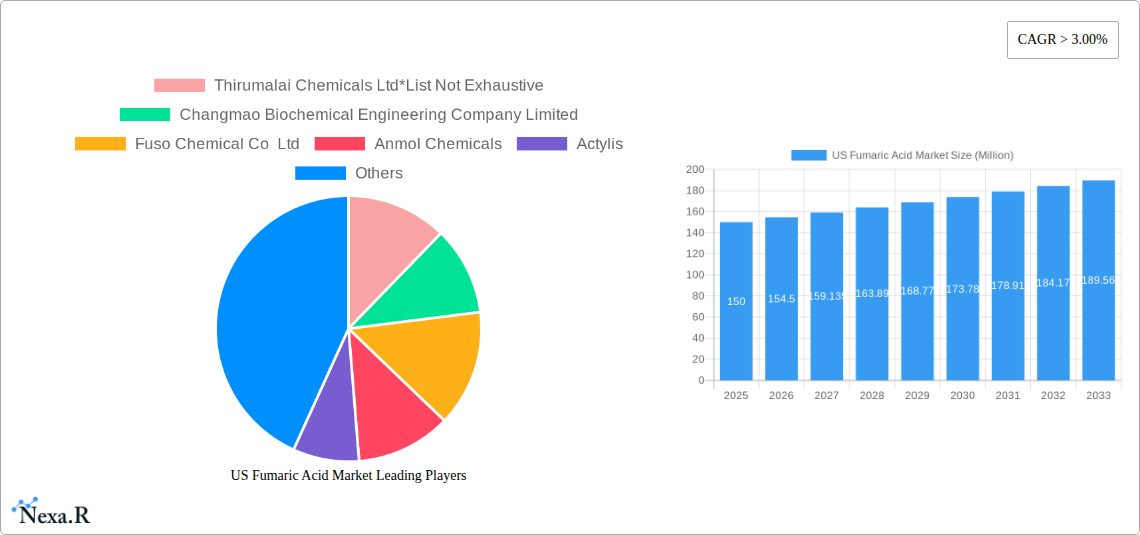
US Fumaric Acid Market Market Size (In Million)
The competitive landscape is moderately consolidated, with key players such as Thirumalai Chemicals Ltd, Changmao Biochemical Engineering Company Limited, and Merck KGaA holding significant market shares. These companies are actively engaged in expanding their production capacities and exploring new applications to maintain their market positions. The presence of both large multinational corporations and smaller specialized chemical manufacturers ensures a dynamic market with continuous innovation. Future growth will depend on technological advancements, the introduction of new applications, and the effective management of supply chain challenges. Furthermore, environmental concerns regarding the production processes of fumaric acid are becoming increasingly important, and companies are focusing on sustainable and eco-friendly production methods to cater to the growing demand for environmentally conscious products. This focus on sustainability will significantly influence the long-term growth trajectory of the US fumaric acid market.
US Fumaric Acid Market Company Market Share
US Fumaric Acid Market: A Comprehensive Market Report (2019-2033)
This comprehensive report provides a detailed analysis of the US Fumaric Acid market, offering invaluable insights for industry professionals, investors, and strategic decision-makers. It covers market dynamics, growth trends, dominant segments, key players, and future outlook, leveraging extensive data analysis and expert insights to paint a complete picture of this dynamic sector. The report analyzes the parent market of Industrial Chemicals and the child market of Organic Acids to provide a holistic understanding. The study period spans from 2019 to 2033, with 2025 serving as the base year and estimated year. The forecast period is 2025-2033, and the historical period encompasses 2019-2024. Market values are presented in million units.
US Fumaric Acid Market Market Dynamics & Structure
This section delves into the intricate dynamics shaping the US Fumaric Acid market. We analyze market concentration, revealing the market share held by major players, and assessing the level of competition. Technological innovation, including advancements in production processes and applications, is thoroughly examined. The regulatory landscape, encompassing relevant environmental and safety regulations, is explored to understand its impact on market players. The influence of competitive substitutes, such as other organic acids, and their market penetration is also discussed. We provide insights into end-user demographics, pinpointing key consumer segments and their preferences. Finally, we investigate M&A trends within the industry, quantifying deal volumes (XX deals in the last 5 years) and analyzing their impact on market consolidation and innovation.
- Market Concentration: Highly fragmented (XX%), with top 5 players holding approximately XX% market share.
- Technological Innovation: Significant advancements in fermentation technology improving yield and reducing costs. Barriers to entry are moderately high due to specialized production processes.
- Regulatory Framework: Stringent FDA regulations for food-grade fumaric acid impact production and labeling.
- Competitive Substitutes: Malic acid and citric acid pose moderate competition in specific applications.
- M&A Activity: A moderate level of consolidation observed, with XX mergers and acquisitions recorded between 2019 and 2024.
US Fumaric Acid Market Growth Trends & Insights
This section provides a comprehensive analysis of the US Fumaric Acid market's growth trajectory. Using extensive data analysis, we determine historical and projected market size, calculating the Compound Annual Growth Rate (CAGR) to illuminate growth patterns. Adoption rates across different segments are examined, revealing the market penetration of fumaric acid in various applications. Disruptive technologies impacting production and application are analyzed, alongside shifts in consumer behavior impacting demand.
- Market Size Evolution: The market size was valued at $XX million in 2024 and is projected to reach $XX million by 2033, exhibiting a CAGR of XX%.
- Adoption Rates: High adoption rates are observed in the food and beverage and unsaturated polyester resin sectors.
- Technological Disruptions: Advancements in biotechnology and process engineering are driving efficiency gains.
- Consumer Behavior Shifts: Growing demand for natural and sustainable ingredients boosts the food-grade segment.
Dominant Regions, Countries, or Segments in US Fumaric Acid Market
This section identifies the key regions, countries, and segments driving the US Fumaric Acid market's growth. Detailed analysis pinpoints the leading segments (Type: Food Grade, Technical Grade; Application: Food & Beverage Processing, Unsaturated Polyester Resin; End-user Industry: Food and Beverage, Chemical) and their market share, growth potential, and underlying drivers.
- Dominant Segment: Food Grade fumaric acid accounts for approximately XX% of the market, driven by its use as an acidulant in food and beverages.
- Key Drivers: Stringent food safety regulations driving demand for high-purity food-grade fumaric acid. Growth in the food and beverage industry fuels this segment.
- Geographic Dominance: The [Specific State/Region in the US – if data allows for such specificity; otherwise use "Eastern US"] region exhibits the highest market share due to the concentration of food processing facilities and chemical manufacturing plants.
US Fumaric Acid Market Product Landscape
The US fumaric acid market features various grades (food grade, technical grade) tailored to specific applications. Product innovation centers around enhanced purity, improved solubility, and specialized formulations for particular end-uses. Technological advancements focus on streamlining production processes to ensure cost-effectiveness and higher yields.
Key Drivers, Barriers & Challenges in US Fumaric Acid Market
Key Drivers:
- Growing demand from the food and beverage industry for natural acidulants.
- Increasing use in the unsaturated polyester resin sector for enhanced material properties.
- Technological advancements leading to improved production efficiency and lower costs.
Key Challenges & Restraints:
- Fluctuations in raw material prices affecting production costs.
- Stringent regulatory requirements impacting product development and market entry.
- Competition from substitute acids like citric and malic acid. This competition reduces profit margins by approximately XX% for some players.
Emerging Opportunities in US Fumaric Acid Market
- Expansion into niche applications within the personal care and pharmaceuticals sectors.
- Development of specialized formulations with enhanced functionality and performance characteristics.
- Exploring new markets in animal feed and agricultural chemicals.
Growth Accelerators in the US Fumaric Acid Market Industry
The market's long-term growth is fueled by technological advancements such as improved fermentation processes and the development of novel applications. Strategic partnerships between manufacturers and end-users, along with market expansion strategies focusing on emerging applications and regions, are key drivers for continued growth.
Key Players Shaping the US Fumaric Acid Market Market
- Thirumalai Chemicals Ltd
- Changmao Biochemical Engineering Company Limited
- Fuso Chemical Co Ltd
- Anmol Chemicals
- Actylis
- Merck KGaA
- NIPPON SHOKUBAI CO LTD
- Polynt SpA
Notable Milestones in US Fumaric Acid Market Sector
- 2021: Launch of a new high-purity food-grade fumaric acid by [Company Name].
- 2022: Acquisition of [Company Name] by [Company Name], leading to increased market share.
- 2023: Introduction of a novel application of fumaric acid in [specific application] by [Company Name]. (XX further notable milestones can be added here based on available information)
In-Depth US Fumaric Acid Market Market Outlook
The US Fumaric Acid market presents significant opportunities for growth in the coming years. The increasing demand from diverse applications, coupled with continuous technological advancements and strategic initiatives by key players, will drive market expansion. Strategic partnerships, investment in R&D, and focus on sustainable production practices will further enhance the market's prospects. The projected CAGR indicates a robust and promising future for the industry.
US Fumaric Acid Market Segmentation
-
1. Type
- 1.1. Food Grade
- 1.2. Technical Grade
-
2. Application
- 2.1. Food & Beverage Processing
- 2.2. Rosin Paper Sizing
- 2.3. Unsaturated Polyester Resin
- 2.4. Alkyd Resin
- 2.5. Personal Care and Cosmetics
- 2.6. Other Ap
-
3. End-user Industry
- 3.1. Food and Beverage
- 3.2. Cosmetics
- 3.3. Pharmaceutical
- 3.4. Chemical
- 3.5. Other End-user Industries (Rubber, Paint)
US Fumaric Acid Market Segmentation By Geography
-
1. North America
- 1.1. United States
- 1.2. Canada
- 1.3. Mexico
-
2. South America
- 2.1. Brazil
- 2.2. Argentina
- 2.3. Rest of South America
-
3. Europe
- 3.1. United Kingdom
- 3.2. Germany
- 3.3. France
- 3.4. Italy
- 3.5. Spain
- 3.6. Russia
- 3.7. Benelux
- 3.8. Nordics
- 3.9. Rest of Europe
-
4. Middle East & Africa
- 4.1. Turkey
- 4.2. Israel
- 4.3. GCC
- 4.4. North Africa
- 4.5. South Africa
- 4.6. Rest of Middle East & Africa
-
5. Asia Pacific
- 5.1. China
- 5.2. India
- 5.3. Japan
- 5.4. South Korea
- 5.5. ASEAN
- 5.6. Oceania
- 5.7. Rest of Asia Pacific
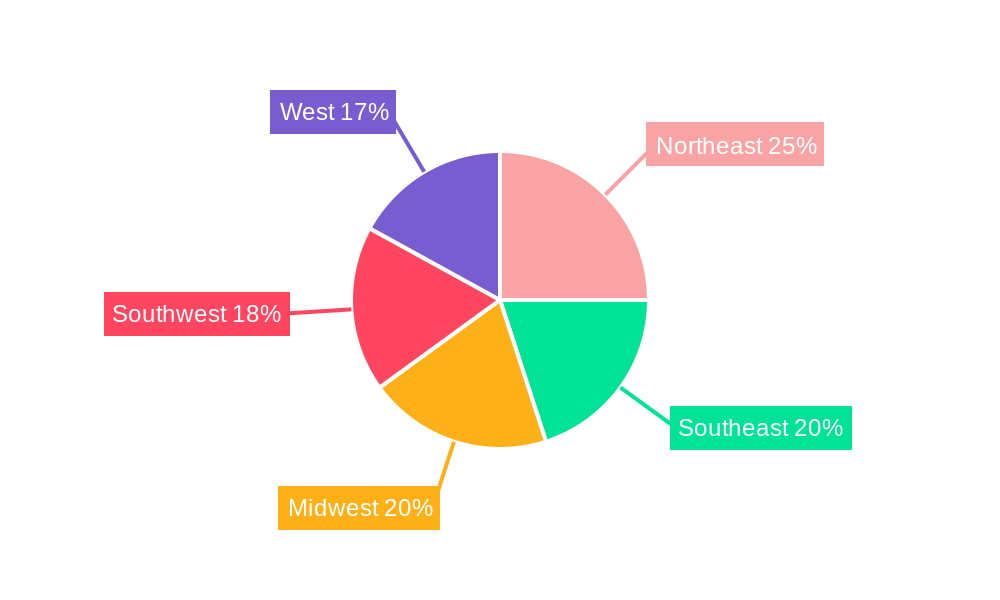
US Fumaric Acid Market Regional Market Share
Geographic Coverage of US Fumaric Acid Market
US Fumaric Acid Market REPORT HIGHLIGHTS
| Aspects | Details |
|---|---|
| Study Period | 2020-2034 |
| Base Year | 2025 |
| Estimated Year | 2026 |
| Forecast Period | 2026-2034 |
| Historical Period | 2020-2025 |
| Growth Rate | CAGR of 5.41% from 2020-2034 |
| Segmentation |
|
Table of Contents
- 1. Introduction
- 1.1. Research Scope
- 1.2. Market Segmentation
- 1.3. Research Objective
- 1.4. Definitions and Assumptions
- 2. Executive Summary
- 2.1. Market Snapshot
- 3. Market Dynamics
- 3.1. Market Drivers
- 3.2. Market Restrains
- 3.3. Market Trends
- 3.4. Market Opportunities
- 4. Market Factor Analysis
- 4.1. Porters Five Forces
- 4.1.1. Bargaining Power of Suppliers
- 4.1.2. Bargaining Power of Buyers
- 4.1.3. Threat of New Entrants
- 4.1.4. Threat of Substitutes
- 4.1.5. Competitive Rivalry
- 4.2. PESTEL analysis
- 4.3. BCG Analysis
- 4.3.1. Stars (High Growth, High Market Share)
- 4.3.2. Cash Cows (Low Growth, High Market Share)
- 4.3.3. Question Mark (High Growth, Low Market Share)
- 4.3.4. Dogs (Low Growth, Low Market Share)
- 4.4. Ansoff Matrix Analysis
- 4.5. Supply Chain Analysis
- 4.6. Regulatory Landscape
- 4.7. Current Market Potential and Opportunity Assessment (TAM–SAM–SOM Framework)
- 4.8. NRP Analyst Note
- 4.1. Porters Five Forces
- 5. Market Analysis, Insights and Forecast 2021-2033
- 5.1. Market Analysis, Insights and Forecast - by Type
- 5.1.1. Food Grade
- 5.1.2. Technical Grade
- 5.2. Market Analysis, Insights and Forecast - by Application
- 5.2.1. Food & Beverage Processing
- 5.2.2. Rosin Paper Sizing
- 5.2.3. Unsaturated Polyester Resin
- 5.2.4. Alkyd Resin
- 5.2.5. Personal Care and Cosmetics
- 5.2.6. Other Ap
- 5.3. Market Analysis, Insights and Forecast - by End-user Industry
- 5.3.1. Food and Beverage
- 5.3.2. Cosmetics
- 5.3.3. Pharmaceutical
- 5.3.4. Chemical
- 5.3.5. Other End-user Industries (Rubber, Paint)
- 5.4. Market Analysis, Insights and Forecast - by Region
- 5.4.1. North America
- 5.4.2. South America
- 5.4.3. Europe
- 5.4.4. Middle East & Africa
- 5.4.5. Asia Pacific
- 5.1. Market Analysis, Insights and Forecast - by Type
- 6. Global US Fumaric Acid Market Analysis, Insights and Forecast, 2021-2033
- 6.1. Market Analysis, Insights and Forecast - by Type
- 6.1.1. Food Grade
- 6.1.2. Technical Grade
- 6.2. Market Analysis, Insights and Forecast - by Application
- 6.2.1. Food & Beverage Processing
- 6.2.2. Rosin Paper Sizing
- 6.2.3. Unsaturated Polyester Resin
- 6.2.4. Alkyd Resin
- 6.2.5. Personal Care and Cosmetics
- 6.2.6. Other Ap
- 6.3. Market Analysis, Insights and Forecast - by End-user Industry
- 6.3.1. Food and Beverage
- 6.3.2. Cosmetics
- 6.3.3. Pharmaceutical
- 6.3.4. Chemical
- 6.3.5. Other End-user Industries (Rubber, Paint)
- 6.1. Market Analysis, Insights and Forecast - by Type
- 7. North America US Fumaric Acid Market Analysis, Insights and Forecast, 2020-2032
- 7.1. Market Analysis, Insights and Forecast - by Type
- 7.1.1. Food Grade
- 7.1.2. Technical Grade
- 7.2. Market Analysis, Insights and Forecast - by Application
- 7.2.1. Food & Beverage Processing
- 7.2.2. Rosin Paper Sizing
- 7.2.3. Unsaturated Polyester Resin
- 7.2.4. Alkyd Resin
- 7.2.5. Personal Care and Cosmetics
- 7.2.6. Other Ap
- 7.3. Market Analysis, Insights and Forecast - by End-user Industry
- 7.3.1. Food and Beverage
- 7.3.2. Cosmetics
- 7.3.3. Pharmaceutical
- 7.3.4. Chemical
- 7.3.5. Other End-user Industries (Rubber, Paint)
- 7.1. Market Analysis, Insights and Forecast - by Type
- 8. South America US Fumaric Acid Market Analysis, Insights and Forecast, 2020-2032
- 8.1. Market Analysis, Insights and Forecast - by Type
- 8.1.1. Food Grade
- 8.1.2. Technical Grade
- 8.2. Market Analysis, Insights and Forecast - by Application
- 8.2.1. Food & Beverage Processing
- 8.2.2. Rosin Paper Sizing
- 8.2.3. Unsaturated Polyester Resin
- 8.2.4. Alkyd Resin
- 8.2.5. Personal Care and Cosmetics
- 8.2.6. Other Ap
- 8.3. Market Analysis, Insights and Forecast - by End-user Industry
- 8.3.1. Food and Beverage
- 8.3.2. Cosmetics
- 8.3.3. Pharmaceutical
- 8.3.4. Chemical
- 8.3.5. Other End-user Industries (Rubber, Paint)
- 8.1. Market Analysis, Insights and Forecast - by Type
- 9. Europe US Fumaric Acid Market Analysis, Insights and Forecast, 2020-2032
- 9.1. Market Analysis, Insights and Forecast - by Type
- 9.1.1. Food Grade
- 9.1.2. Technical Grade
- 9.2. Market Analysis, Insights and Forecast - by Application
- 9.2.1. Food & Beverage Processing
- 9.2.2. Rosin Paper Sizing
- 9.2.3. Unsaturated Polyester Resin
- 9.2.4. Alkyd Resin
- 9.2.5. Personal Care and Cosmetics
- 9.2.6. Other Ap
- 9.3. Market Analysis, Insights and Forecast - by End-user Industry
- 9.3.1. Food and Beverage
- 9.3.2. Cosmetics
- 9.3.3. Pharmaceutical
- 9.3.4. Chemical
- 9.3.5. Other End-user Industries (Rubber, Paint)
- 9.1. Market Analysis, Insights and Forecast - by Type
- 10. Middle East & Africa US Fumaric Acid Market Analysis, Insights and Forecast, 2020-2032
- 10.1. Market Analysis, Insights and Forecast - by Type
- 10.1.1. Food Grade
- 10.1.2. Technical Grade
- 10.2. Market Analysis, Insights and Forecast - by Application
- 10.2.1. Food & Beverage Processing
- 10.2.2. Rosin Paper Sizing
- 10.2.3. Unsaturated Polyester Resin
- 10.2.4. Alkyd Resin
- 10.2.5. Personal Care and Cosmetics
- 10.2.6. Other Ap
- 10.3. Market Analysis, Insights and Forecast - by End-user Industry
- 10.3.1. Food and Beverage
- 10.3.2. Cosmetics
- 10.3.3. Pharmaceutical
- 10.3.4. Chemical
- 10.3.5. Other End-user Industries (Rubber, Paint)
- 10.1. Market Analysis, Insights and Forecast - by Type
- 11. Asia Pacific US Fumaric Acid Market Analysis, Insights and Forecast, 2020-2032
- 11.1. Market Analysis, Insights and Forecast - by Type
- 11.1.1. Food Grade
- 11.1.2. Technical Grade
- 11.2. Market Analysis, Insights and Forecast - by Application
- 11.2.1. Food & Beverage Processing
- 11.2.2. Rosin Paper Sizing
- 11.2.3. Unsaturated Polyester Resin
- 11.2.4. Alkyd Resin
- 11.2.5. Personal Care and Cosmetics
- 11.2.6. Other Ap
- 11.3. Market Analysis, Insights and Forecast - by End-user Industry
- 11.3.1. Food and Beverage
- 11.3.2. Cosmetics
- 11.3.3. Pharmaceutical
- 11.3.4. Chemical
- 11.3.5. Other End-user Industries (Rubber, Paint)
- 11.1. Market Analysis, Insights and Forecast - by Type
- 12. Competitive Analysis
- 12.1. Company Profiles
- 12.1.1 Thirumalai Chemicals Ltd*List Not Exhaustive
- 12.1.1.1. Company Overview
- 12.1.1.2. Products
- 12.1.1.3. Company Financials
- 12.1.1.4. SWOT Analysis
- 12.1.2 Changmao Biochemical Engineering Company Limited
- 12.1.2.1. Company Overview
- 12.1.2.2. Products
- 12.1.2.3. Company Financials
- 12.1.2.4. SWOT Analysis
- 12.1.3 Fuso Chemical Co Ltd
- 12.1.3.1. Company Overview
- 12.1.3.2. Products
- 12.1.3.3. Company Financials
- 12.1.3.4. SWOT Analysis
- 12.1.4 Anmol Chemicals
- 12.1.4.1. Company Overview
- 12.1.4.2. Products
- 12.1.4.3. Company Financials
- 12.1.4.4. SWOT Analysis
- 12.1.5 Actylis
- 12.1.5.1. Company Overview
- 12.1.5.2. Products
- 12.1.5.3. Company Financials
- 12.1.5.4. SWOT Analysis
- 12.1.6 Merck KGaA
- 12.1.6.1. Company Overview
- 12.1.6.2. Products
- 12.1.6.3. Company Financials
- 12.1.6.4. SWOT Analysis
- 12.1.7 NIPPON SHOKUBAI CO LTD
- 12.1.7.1. Company Overview
- 12.1.7.2. Products
- 12.1.7.3. Company Financials
- 12.1.7.4. SWOT Analysis
- 12.1.8 Polynt SpA
- 12.1.8.1. Company Overview
- 12.1.8.2. Products
- 12.1.8.3. Company Financials
- 12.1.8.4. SWOT Analysis
- 12.1.1 Thirumalai Chemicals Ltd*List Not Exhaustive
- 12.2. Market Entropy
- 12.2.1 Company's Key Areas Served
- 12.2.2 Recent Developments
- 12.3. Company Market Share Analysis 2025
- 12.3.1 Top 5 Companies Market Share Analysis
- 12.3.2 Top 3 Companies Market Share Analysis
- 12.4. List of Potential Customers
- 13. Research Methodology
List of Figures
- Figure 1: Global US Fumaric Acid Market Revenue Breakdown (undefined, %) by Region 2025 & 2033
- Figure 2: North America US Fumaric Acid Market Revenue (undefined), by Type 2025 & 2033
- Figure 3: North America US Fumaric Acid Market Revenue Share (%), by Type 2025 & 2033
- Figure 4: North America US Fumaric Acid Market Revenue (undefined), by Application 2025 & 2033
- Figure 5: North America US Fumaric Acid Market Revenue Share (%), by Application 2025 & 2033
- Figure 6: North America US Fumaric Acid Market Revenue (undefined), by End-user Industry 2025 & 2033
- Figure 7: North America US Fumaric Acid Market Revenue Share (%), by End-user Industry 2025 & 2033
- Figure 8: North America US Fumaric Acid Market Revenue (undefined), by Country 2025 & 2033
- Figure 9: North America US Fumaric Acid Market Revenue Share (%), by Country 2025 & 2033
- Figure 10: South America US Fumaric Acid Market Revenue (undefined), by Type 2025 & 2033
- Figure 11: South America US Fumaric Acid Market Revenue Share (%), by Type 2025 & 2033
- Figure 12: South America US Fumaric Acid Market Revenue (undefined), by Application 2025 & 2033
- Figure 13: South America US Fumaric Acid Market Revenue Share (%), by Application 2025 & 2033
- Figure 14: South America US Fumaric Acid Market Revenue (undefined), by End-user Industry 2025 & 2033
- Figure 15: South America US Fumaric Acid Market Revenue Share (%), by End-user Industry 2025 & 2033
- Figure 16: South America US Fumaric Acid Market Revenue (undefined), by Country 2025 & 2033
- Figure 17: South America US Fumaric Acid Market Revenue Share (%), by Country 2025 & 2033
- Figure 18: Europe US Fumaric Acid Market Revenue (undefined), by Type 2025 & 2033
- Figure 19: Europe US Fumaric Acid Market Revenue Share (%), by Type 2025 & 2033
- Figure 20: Europe US Fumaric Acid Market Revenue (undefined), by Application 2025 & 2033
- Figure 21: Europe US Fumaric Acid Market Revenue Share (%), by Application 2025 & 2033
- Figure 22: Europe US Fumaric Acid Market Revenue (undefined), by End-user Industry 2025 & 2033
- Figure 23: Europe US Fumaric Acid Market Revenue Share (%), by End-user Industry 2025 & 2033
- Figure 24: Europe US Fumaric Acid Market Revenue (undefined), by Country 2025 & 2033
- Figure 25: Europe US Fumaric Acid Market Revenue Share (%), by Country 2025 & 2033
- Figure 26: Middle East & Africa US Fumaric Acid Market Revenue (undefined), by Type 2025 & 2033
- Figure 27: Middle East & Africa US Fumaric Acid Market Revenue Share (%), by Type 2025 & 2033
- Figure 28: Middle East & Africa US Fumaric Acid Market Revenue (undefined), by Application 2025 & 2033
- Figure 29: Middle East & Africa US Fumaric Acid Market Revenue Share (%), by Application 2025 & 2033
- Figure 30: Middle East & Africa US Fumaric Acid Market Revenue (undefined), by End-user Industry 2025 & 2033
- Figure 31: Middle East & Africa US Fumaric Acid Market Revenue Share (%), by End-user Industry 2025 & 2033
- Figure 32: Middle East & Africa US Fumaric Acid Market Revenue (undefined), by Country 2025 & 2033
- Figure 33: Middle East & Africa US Fumaric Acid Market Revenue Share (%), by Country 2025 & 2033
- Figure 34: Asia Pacific US Fumaric Acid Market Revenue (undefined), by Type 2025 & 2033
- Figure 35: Asia Pacific US Fumaric Acid Market Revenue Share (%), by Type 2025 & 2033
- Figure 36: Asia Pacific US Fumaric Acid Market Revenue (undefined), by Application 2025 & 2033
- Figure 37: Asia Pacific US Fumaric Acid Market Revenue Share (%), by Application 2025 & 2033
- Figure 38: Asia Pacific US Fumaric Acid Market Revenue (undefined), by End-user Industry 2025 & 2033
- Figure 39: Asia Pacific US Fumaric Acid Market Revenue Share (%), by End-user Industry 2025 & 2033
- Figure 40: Asia Pacific US Fumaric Acid Market Revenue (undefined), by Country 2025 & 2033
- Figure 41: Asia Pacific US Fumaric Acid Market Revenue Share (%), by Country 2025 & 2033
List of Tables
- Table 1: Global US Fumaric Acid Market Revenue undefined Forecast, by Type 2020 & 2033
- Table 2: Global US Fumaric Acid Market Revenue undefined Forecast, by Application 2020 & 2033
- Table 3: Global US Fumaric Acid Market Revenue undefined Forecast, by End-user Industry 2020 & 2033
- Table 4: Global US Fumaric Acid Market Revenue undefined Forecast, by Region 2020 & 2033
- Table 5: Global US Fumaric Acid Market Revenue undefined Forecast, by Type 2020 & 2033
- Table 6: Global US Fumaric Acid Market Revenue undefined Forecast, by Application 2020 & 2033
- Table 7: Global US Fumaric Acid Market Revenue undefined Forecast, by End-user Industry 2020 & 2033
- Table 8: Global US Fumaric Acid Market Revenue undefined Forecast, by Country 2020 & 2033
- Table 9: United States US Fumaric Acid Market Revenue (undefined) Forecast, by Application 2020 & 2033
- Table 10: Canada US Fumaric Acid Market Revenue (undefined) Forecast, by Application 2020 & 2033
- Table 11: Mexico US Fumaric Acid Market Revenue (undefined) Forecast, by Application 2020 & 2033
- Table 12: Global US Fumaric Acid Market Revenue undefined Forecast, by Type 2020 & 2033
- Table 13: Global US Fumaric Acid Market Revenue undefined Forecast, by Application 2020 & 2033
- Table 14: Global US Fumaric Acid Market Revenue undefined Forecast, by End-user Industry 2020 & 2033
- Table 15: Global US Fumaric Acid Market Revenue undefined Forecast, by Country 2020 & 2033
- Table 16: Brazil US Fumaric Acid Market Revenue (undefined) Forecast, by Application 2020 & 2033
- Table 17: Argentina US Fumaric Acid Market Revenue (undefined) Forecast, by Application 2020 & 2033
- Table 18: Rest of South America US Fumaric Acid Market Revenue (undefined) Forecast, by Application 2020 & 2033
- Table 19: Global US Fumaric Acid Market Revenue undefined Forecast, by Type 2020 & 2033
- Table 20: Global US Fumaric Acid Market Revenue undefined Forecast, by Application 2020 & 2033
- Table 21: Global US Fumaric Acid Market Revenue undefined Forecast, by End-user Industry 2020 & 2033
- Table 22: Global US Fumaric Acid Market Revenue undefined Forecast, by Country 2020 & 2033
- Table 23: United Kingdom US Fumaric Acid Market Revenue (undefined) Forecast, by Application 2020 & 2033
- Table 24: Germany US Fumaric Acid Market Revenue (undefined) Forecast, by Application 2020 & 2033
- Table 25: France US Fumaric Acid Market Revenue (undefined) Forecast, by Application 2020 & 2033
- Table 26: Italy US Fumaric Acid Market Revenue (undefined) Forecast, by Application 2020 & 2033
- Table 27: Spain US Fumaric Acid Market Revenue (undefined) Forecast, by Application 2020 & 2033
- Table 28: Russia US Fumaric Acid Market Revenue (undefined) Forecast, by Application 2020 & 2033
- Table 29: Benelux US Fumaric Acid Market Revenue (undefined) Forecast, by Application 2020 & 2033
- Table 30: Nordics US Fumaric Acid Market Revenue (undefined) Forecast, by Application 2020 & 2033
- Table 31: Rest of Europe US Fumaric Acid Market Revenue (undefined) Forecast, by Application 2020 & 2033
- Table 32: Global US Fumaric Acid Market Revenue undefined Forecast, by Type 2020 & 2033
- Table 33: Global US Fumaric Acid Market Revenue undefined Forecast, by Application 2020 & 2033
- Table 34: Global US Fumaric Acid Market Revenue undefined Forecast, by End-user Industry 2020 & 2033
- Table 35: Global US Fumaric Acid Market Revenue undefined Forecast, by Country 2020 & 2033
- Table 36: Turkey US Fumaric Acid Market Revenue (undefined) Forecast, by Application 2020 & 2033
- Table 37: Israel US Fumaric Acid Market Revenue (undefined) Forecast, by Application 2020 & 2033
- Table 38: GCC US Fumaric Acid Market Revenue (undefined) Forecast, by Application 2020 & 2033
- Table 39: North Africa US Fumaric Acid Market Revenue (undefined) Forecast, by Application 2020 & 2033
- Table 40: South Africa US Fumaric Acid Market Revenue (undefined) Forecast, by Application 2020 & 2033
- Table 41: Rest of Middle East & Africa US Fumaric Acid Market Revenue (undefined) Forecast, by Application 2020 & 2033
- Table 42: Global US Fumaric Acid Market Revenue undefined Forecast, by Type 2020 & 2033
- Table 43: Global US Fumaric Acid Market Revenue undefined Forecast, by Application 2020 & 2033
- Table 44: Global US Fumaric Acid Market Revenue undefined Forecast, by End-user Industry 2020 & 2033
- Table 45: Global US Fumaric Acid Market Revenue undefined Forecast, by Country 2020 & 2033
- Table 46: China US Fumaric Acid Market Revenue (undefined) Forecast, by Application 2020 & 2033
- Table 47: India US Fumaric Acid Market Revenue (undefined) Forecast, by Application 2020 & 2033
- Table 48: Japan US Fumaric Acid Market Revenue (undefined) Forecast, by Application 2020 & 2033
- Table 49: South Korea US Fumaric Acid Market Revenue (undefined) Forecast, by Application 2020 & 2033
- Table 50: ASEAN US Fumaric Acid Market Revenue (undefined) Forecast, by Application 2020 & 2033
- Table 51: Oceania US Fumaric Acid Market Revenue (undefined) Forecast, by Application 2020 & 2033
- Table 52: Rest of Asia Pacific US Fumaric Acid Market Revenue (undefined) Forecast, by Application 2020 & 2033
Frequently Asked Questions
1. What is the projected Compound Annual Growth Rate (CAGR) of the US Fumaric Acid Market?
The projected CAGR is approximately 5.41%.
2. Which companies are prominent players in the US Fumaric Acid Market?
Key companies in the market include Thirumalai Chemicals Ltd*List Not Exhaustive, Changmao Biochemical Engineering Company Limited, Fuso Chemical Co Ltd, Anmol Chemicals, Actylis, Merck KGaA, NIPPON SHOKUBAI CO LTD, Polynt SpA.
3. What are the main segments of the US Fumaric Acid Market?
The market segments include Type, Application, End-user Industry.
4. Can you provide details about the market size?
The market size is estimated to be USD XXX N/A as of 2022.
5. What are some drivers contributing to market growth?
Increasing Demand from Food and Beverage Industry; Growing Application in Pharmaceutical Industry; Other Drivers.
6. What are the notable trends driving market growth?
Food and Beverage Sector to Dominate the Market.
7. Are there any restraints impacting market growth?
Health hazard Related to Fumaric Acid; Other Restraints.
8. Can you provide examples of recent developments in the market?
N/A
9. What pricing options are available for accessing the report?
Pricing options include single-user, multi-user, and enterprise licenses priced at USD 3800, USD 4500, and USD 5800 respectively.
10. Is the market size provided in terms of value or volume?
The market size is provided in terms of value, measured in N/A.
11. Are there any specific market keywords associated with the report?
Yes, the market keyword associated with the report is "US Fumaric Acid Market," which aids in identifying and referencing the specific market segment covered.
12. How do I determine which pricing option suits my needs best?
The pricing options vary based on user requirements and access needs. Individual users may opt for single-user licenses, while businesses requiring broader access may choose multi-user or enterprise licenses for cost-effective access to the report.
13. Are there any additional resources or data provided in the US Fumaric Acid Market report?
While the report offers comprehensive insights, it's advisable to review the specific contents or supplementary materials provided to ascertain if additional resources or data are available.
14. How can I stay updated on further developments or reports in the US Fumaric Acid Market?
To stay informed about further developments, trends, and reports in the US Fumaric Acid Market, consider subscribing to industry newsletters, following relevant companies and organizations, or regularly checking reputable industry news sources and publications.
Methodology
Step 1 - Identification of Relevant Samples Size from Population Database


Step 2 - Approaches for Defining Global Market Size (Value, Volume* & Price*)

Note*: In applicable scenarios
Step 3 - Data Sources
Primary Research
- Web Analytics
- Survey Reports
- Research Institute
- Latest Research Reports
- Opinion Leaders
Secondary Research
- Annual Reports
- White Paper
- Latest Press Release
- Industry Association
- Paid Database
- Investor Presentations

Step 4 - Data Triangulation
Involves using different sources of information in order to increase the validity of a study
These sources are likely to be stakeholders in a program - participants, other researchers, program staff, other community members, and so on.
Then we put all data in single framework & apply various statistical tools to find out the dynamic on the market.
During the analysis stage, feedback from the stakeholder groups would be compared to determine areas of agreement as well as areas of divergence