

Key Insights
The U.S. onshore drilling fluid market is poised for significant expansion, driven by escalating oil and gas exploration and production activities. Projected to achieve a compound annual growth rate (CAGR) of 7.5%, the market, valued at $2.7 billion in the base year 2024, is expected to witness substantial growth through 2033. Key growth drivers include sustained energy demand, technological innovations enhancing drilling efficiency and environmental performance, and supportive government policies for domestic energy production. The market is segmented by fluid type (water-based, oil-based, synthetic-based), application (conventional, directional, horizontal drilling), and geography. Future market trajectory will be shaped by the interplay of energy demand, technological advancements, and regulatory compliance, with a strong emphasis on developing sustainable and cost-effective drilling fluid solutions.
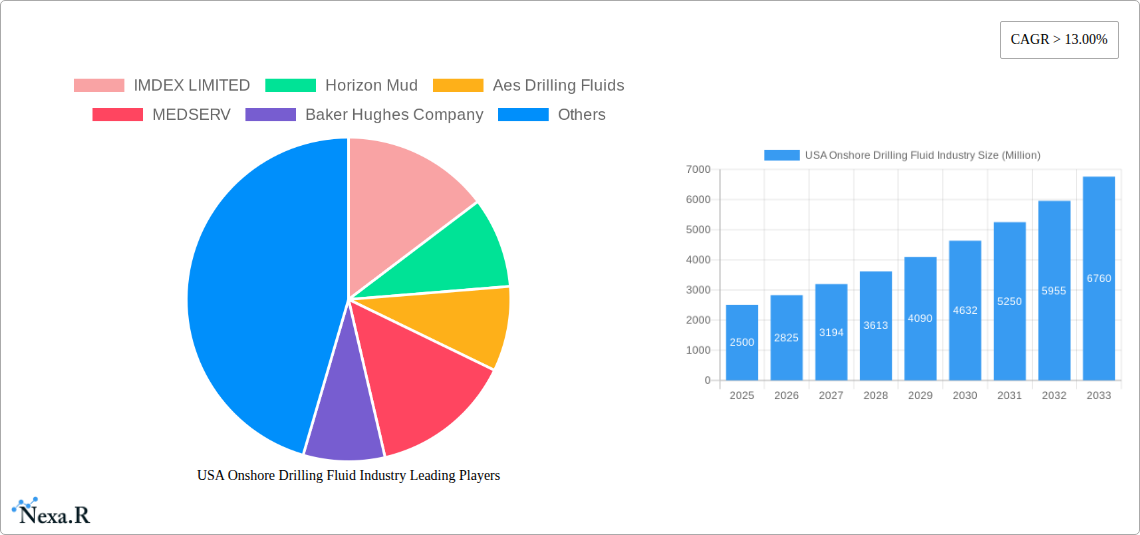
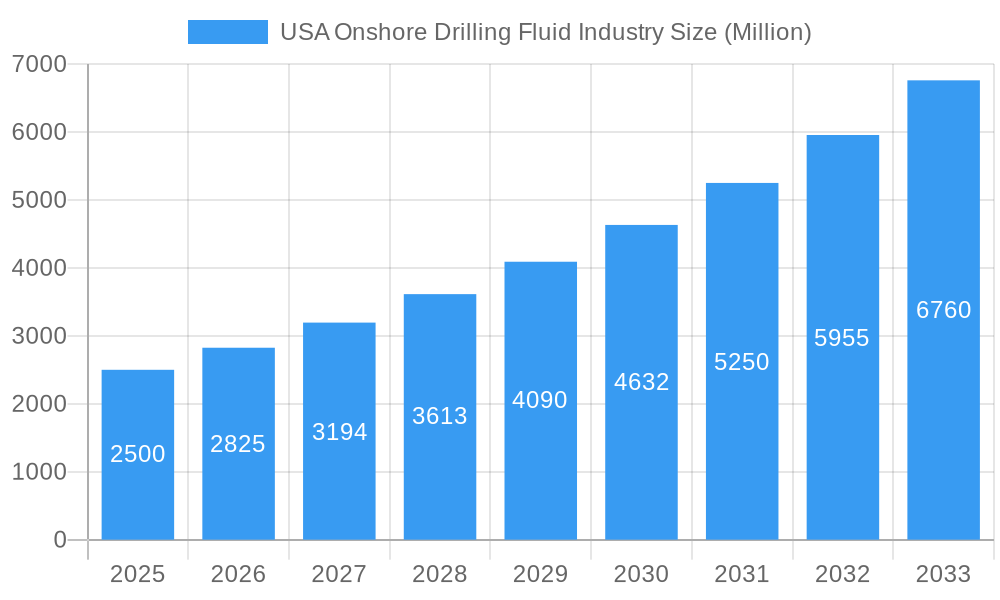
USA Onshore Drilling Fluid Industry Market Size (In Billion)
The competitive landscape features a mix of established industry leaders and agile emerging players. Major companies leverage extensive service networks and advanced technologies, while smaller firms focus on specialized and environmentally conscious drilling fluid formulations. Success in this dynamic market will depend on adapting to technological advancements like automation and data analytics, and strict adherence to environmental regulations. Potential market consolidation through mergers and acquisitions is anticipated. Regional dynamics, particularly in resource-rich areas like the Southwest and Permian Basin, significantly influence market trends.
USA Onshore Drilling Fluid Industry Company Market Share
This report offers a comprehensive analysis of the U.S. onshore drilling fluid industry, detailing market dynamics, growth trends, competitive strategies, and future projections. Covering the period from 2019 to 2033, with a base year of 2024, this analysis is an indispensable tool for industry professionals, investors, and decision-makers. The market sits within the broader Oil and Gas services sector, with a specific focus on U.S. onshore drilling fluids. Market valuations are presented in billions of USD.
USA Onshore Drilling Fluid Industry Market Dynamics & Structure
The USA onshore drilling fluid market is characterized by a moderately concentrated landscape, with several major players holding significant market share. Market concentration is estimated at xx% in 2025, with the top 5 players accounting for approximately xx% of the total revenue. Technological innovation, driven by the need for environmentally friendly and high-performance fluids, is a key driver. Stringent environmental regulations, particularly concerning wastewater disposal and fluid composition, shape industry practices. Competitive product substitutes, such as water-based and synthetic-based fluids, are constantly evolving, impacting market dynamics. The end-user demographic consists primarily of exploration and production companies operating in onshore oil and gas fields across the United States. Mergers and acquisitions (M&A) activity has been moderate in recent years, with xx major deals recorded between 2019 and 2024, valued at approximately $xx million.
- Market Concentration: xx% in 2025 (Top 5 players: xx%)
- Technological Innovation: Focus on environmentally friendly and high-performance fluids.
- Regulatory Framework: Stringent environmental regulations impacting fluid composition and disposal.
- Competitive Substitutes: Water-based and synthetic-based fluids gaining market share.
- M&A Activity: xx major deals (2019-2024), valued at approximately $xx million.
- Innovation Barriers: High R&D costs, stringent regulatory approvals.
USA Onshore Drilling Fluid Industry Growth Trends & Insights
The USA onshore drilling fluid market experienced significant fluctuations during the historical period (2019-2024), largely influenced by oil price volatility and drilling activity levels. The market size in 2024 is estimated at $xx million, exhibiting a CAGR of xx% during the historical period. However, with the projected increase in onshore drilling activities and a growing demand for efficient drilling fluids, the market is anticipated to grow at a CAGR of xx% from 2025 to 2033, reaching $xx million by 2033. Technological disruptions, particularly the adoption of automation and data analytics in fluid management, are influencing adoption rates. Shifting consumer behavior towards sustainable and environmentally responsible practices is driving the demand for eco-friendly drilling fluids. Market penetration of synthetic-based fluids is expected to increase from xx% in 2025 to xx% by 2033.
Dominant Regions, Countries, or Segments in USA Onshore Drilling Fluid Industry
The Permian Basin and Eagle Ford Shale regions dominate the USA onshore drilling fluid market, driven by extensive oil and gas exploration and production activities. These regions benefit from established infrastructure, favorable regulatory environments, and a concentration of exploration and production companies. Texas and North Dakota, due to their significant onshore drilling activity, are the leading states. The growth is largely attributed to:
- High Drilling Activity: Significant investments in exploration and production.
- Established Infrastructure: Well-developed logistics and transportation networks.
- Favorable Regulatory Environment: Supportive policies for oil and gas development.
- Technological Advancements: Adoption of advanced drilling techniques.
USA Onshore Drilling Fluid Industry Product Landscape
The product landscape encompasses various types of drilling fluids, including water-based, oil-based, and synthetic-based fluids. Recent innovations focus on enhanced performance characteristics, such as improved rheology, reduced environmental impact, and increased drilling efficiency. The unique selling propositions include improved lubricity, reduced friction, and enhanced shale stability. Technological advancements encompass the use of nanomaterials, smart fluids, and automation in fluid management systems.
Key Drivers, Barriers & Challenges in USA Onshore Drilling Fluid Industry
Key Drivers:
- Increased onshore drilling activity driven by energy demand.
- Technological advancements leading to improved fluid performance.
- Growing demand for environmentally friendly drilling fluids.
Key Challenges:
- Fluctuations in oil prices impacting drilling activity.
- Stringent environmental regulations increasing compliance costs.
- Intense competition among numerous players. (xx% market share for top 5 players illustrates competitive pressures)
- Supply chain disruptions potentially impacting raw material availability and cost.
Emerging Opportunities in USA Onshore Drilling Fluid Industry
- Growing demand for high-performance fluids in unconventional reservoirs.
- Development of innovative, eco-friendly drilling fluids.
- Expansion into emerging shale gas plays.
- Increased adoption of automation and data analytics in fluid management.
Growth Accelerators in the USA Onshore Drilling Fluid Industry Industry
Technological breakthroughs in fluid formulation, coupled with strategic partnerships between service providers and exploration companies, are expected to significantly accelerate market growth. Expansion into emerging shale gas plays and the adoption of digital technologies in fluid management will further fuel market expansion.
Key Players Shaping the USA Onshore Drilling Fluid Industry Market
- IMDEX LIMITED
- Horizon Mud
- Aes Drilling Fluids
- MEDSERV
- Baker Hughes Company
- Schlumberger Limited
- Newpark Resources Inc
- Weatherford
- National Oilwell Varco
- Francis Drilling Fluids Ltd
- Oleon Americas Inc (Avril Group)
- Q'max Solutions Inc
- Unique Drilling Fluids Inc
- Sunwest Fluids LLC
- McAda Drilling Fluids
- Geo Drilling Fluids Inc
- CES Energy Solutions Corp
Notable Milestones in USA Onshore Drilling Fluid Industry Sector
- 2020: Introduction of a new generation of environmentally friendly drilling fluid by Baker Hughes.
- 2021: Merger between two smaller drilling fluid companies, resulting in increased market share.
- 2022: Successful pilot program for a smart fluid management system by Schlumberger.
- 2023: Implementation of stricter environmental regulations impacting fluid composition.
- 2024: Significant investment in R&D for enhanced drilling fluid technology by Newpark Resources.
In-Depth USA Onshore Drilling Fluid Industry Market Outlook
The future of the USA onshore drilling fluid market is promising, driven by sustained growth in onshore drilling activity and the ongoing development of innovative drilling fluid technologies. Strategic partnerships and investments in R&D will play a crucial role in shaping the market landscape. The focus on sustainability and enhanced performance will continue to drive demand for advanced drilling fluids, creating significant opportunities for market participants.
USA Onshore Drilling Fluid Industry Segmentation
-
1. Additive Type
- 1.1. Protective Chemicals
- 1.2. Fluid Viscosifiers
- 1.3. Weighting Agents
- 1.4. Wetting Agents
- 1.5. Lost Circulation Materials
- 1.6. Thinners
- 1.7. Rheology Modifiers
- 1.8. Surfactants
- 1.9. Alkalinity and pH Control Materials
- 1.10. Shale Stabilizers
- 1.11. Other Additive Types
-
2. Product Type
- 2.1. Oil-based Drilling Fluid
- 2.2. Synthetic-based Drilling Fluid
- 2.3. Water-based Drilling Fluid
-
3. Basin
- 3.1. Permian
- 3.2. Eagle Ford
- 3.3. Niobrara
- 3.4. Bakken
- 3.5. Appalachia
- 3.6. Other Basins
USA Onshore Drilling Fluid Industry Segmentation By Geography
-
1. North America
- 1.1. United States
- 1.2. Canada
- 1.3. Mexico
-
2. South America
- 2.1. Brazil
- 2.2. Argentina
- 2.3. Rest of South America
-
3. Europe
- 3.1. United Kingdom
- 3.2. Germany
- 3.3. France
- 3.4. Italy
- 3.5. Spain
- 3.6. Russia
- 3.7. Benelux
- 3.8. Nordics
- 3.9. Rest of Europe
-
4. Middle East & Africa
- 4.1. Turkey
- 4.2. Israel
- 4.3. GCC
- 4.4. North Africa
- 4.5. South Africa
- 4.6. Rest of Middle East & Africa
-
5. Asia Pacific
- 5.1. China
- 5.2. India
- 5.3. Japan
- 5.4. South Korea
- 5.5. ASEAN
- 5.6. Oceania
- 5.7. Rest of Asia Pacific
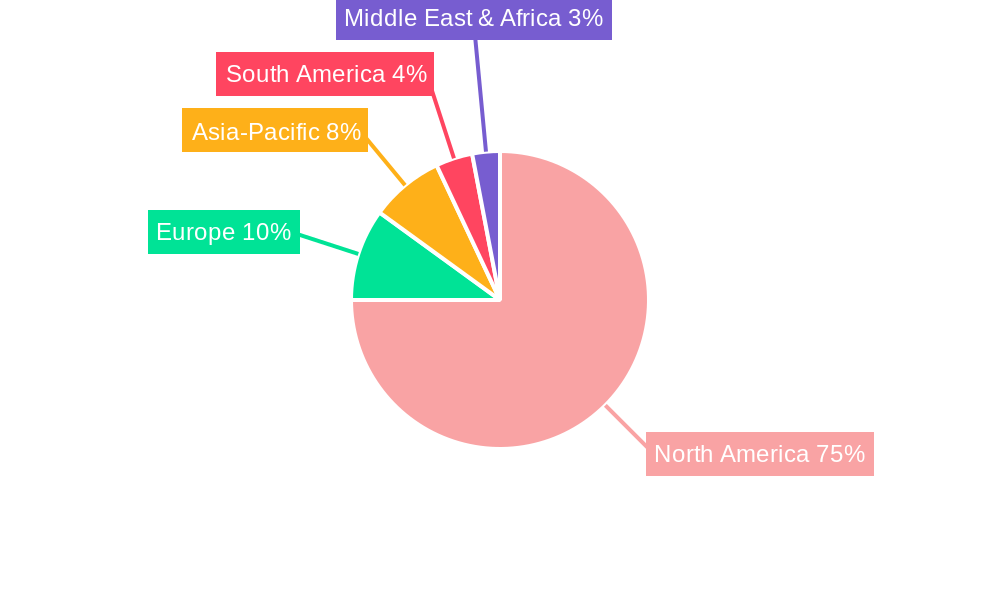
USA Onshore Drilling Fluid Industry Regional Market Share
Geographic Coverage of USA Onshore Drilling Fluid Industry
USA Onshore Drilling Fluid Industry REPORT HIGHLIGHTS
| Aspects | Details |
|---|---|
| Study Period | 2020-2034 |
| Base Year | 2025 |
| Estimated Year | 2026 |
| Forecast Period | 2026-2034 |
| Historical Period | 2020-2025 |
| Growth Rate | CAGR of 7.5% from 2020-2034 |
| Segmentation |
|
Table of Contents
- 1. Introduction
- 1.1. Research Scope
- 1.2. Market Segmentation
- 1.3. Research Objective
- 1.4. Definitions and Assumptions
- 2. Executive Summary
- 2.1. Market Snapshot
- 3. Market Dynamics
- 3.1. Market Drivers
- 3.2. Market Restrains
- 3.3. Market Trends
- 3.4. Market Opportunities
- 4. Market Factor Analysis
- 4.1. Porters Five Forces
- 4.1.1. Bargaining Power of Suppliers
- 4.1.2. Bargaining Power of Buyers
- 4.1.3. Threat of New Entrants
- 4.1.4. Threat of Substitutes
- 4.1.5. Competitive Rivalry
- 4.2. PESTEL analysis
- 4.3. BCG Analysis
- 4.3.1. Stars (High Growth, High Market Share)
- 4.3.2. Cash Cows (Low Growth, High Market Share)
- 4.3.3. Question Mark (High Growth, Low Market Share)
- 4.3.4. Dogs (Low Growth, Low Market Share)
- 4.4. Ansoff Matrix Analysis
- 4.5. Supply Chain Analysis
- 4.6. Regulatory Landscape
- 4.7. Current Market Potential and Opportunity Assessment (TAM–SAM–SOM Framework)
- 4.8. NRP Analyst Note
- 4.1. Porters Five Forces
- 5. Market Analysis, Insights and Forecast 2021-2033
- 5.1. Market Analysis, Insights and Forecast - by Additive Type
- 5.1.1. Protective Chemicals
- 5.1.2. Fluid Viscosifiers
- 5.1.3. Weighting Agents
- 5.1.4. Wetting Agents
- 5.1.5. Lost Circulation Materials
- 5.1.6. Thinners
- 5.1.7. Rheology Modifiers
- 5.1.8. Surfactants
- 5.1.9. Alkalinity and pH Control Materials
- 5.1.10. Shale Stabilizers
- 5.1.11. Other Additive Types
- 5.2. Market Analysis, Insights and Forecast - by Product Type
- 5.2.1. Oil-based Drilling Fluid
- 5.2.2. Synthetic-based Drilling Fluid
- 5.2.3. Water-based Drilling Fluid
- 5.3. Market Analysis, Insights and Forecast - by Basin
- 5.3.1. Permian
- 5.3.2. Eagle Ford
- 5.3.3. Niobrara
- 5.3.4. Bakken
- 5.3.5. Appalachia
- 5.3.6. Other Basins
- 5.4. Market Analysis, Insights and Forecast - by Region
- 5.4.1. North America
- 5.4.2. South America
- 5.4.3. Europe
- 5.4.4. Middle East & Africa
- 5.4.5. Asia Pacific
- 5.1. Market Analysis, Insights and Forecast - by Additive Type
- 6. Global USA Onshore Drilling Fluid Industry Analysis, Insights and Forecast, 2021-2033
- 6.1. Market Analysis, Insights and Forecast - by Additive Type
- 6.1.1. Protective Chemicals
- 6.1.2. Fluid Viscosifiers
- 6.1.3. Weighting Agents
- 6.1.4. Wetting Agents
- 6.1.5. Lost Circulation Materials
- 6.1.6. Thinners
- 6.1.7. Rheology Modifiers
- 6.1.8. Surfactants
- 6.1.9. Alkalinity and pH Control Materials
- 6.1.10. Shale Stabilizers
- 6.1.11. Other Additive Types
- 6.2. Market Analysis, Insights and Forecast - by Product Type
- 6.2.1. Oil-based Drilling Fluid
- 6.2.2. Synthetic-based Drilling Fluid
- 6.2.3. Water-based Drilling Fluid
- 6.3. Market Analysis, Insights and Forecast - by Basin
- 6.3.1. Permian
- 6.3.2. Eagle Ford
- 6.3.3. Niobrara
- 6.3.4. Bakken
- 6.3.5. Appalachia
- 6.3.6. Other Basins
- 6.1. Market Analysis, Insights and Forecast - by Additive Type
- 7. North America USA Onshore Drilling Fluid Industry Analysis, Insights and Forecast, 2020-2032
- 7.1. Market Analysis, Insights and Forecast - by Additive Type
- 7.1.1. Protective Chemicals
- 7.1.2. Fluid Viscosifiers
- 7.1.3. Weighting Agents
- 7.1.4. Wetting Agents
- 7.1.5. Lost Circulation Materials
- 7.1.6. Thinners
- 7.1.7. Rheology Modifiers
- 7.1.8. Surfactants
- 7.1.9. Alkalinity and pH Control Materials
- 7.1.10. Shale Stabilizers
- 7.1.11. Other Additive Types
- 7.2. Market Analysis, Insights and Forecast - by Product Type
- 7.2.1. Oil-based Drilling Fluid
- 7.2.2. Synthetic-based Drilling Fluid
- 7.2.3. Water-based Drilling Fluid
- 7.3. Market Analysis, Insights and Forecast - by Basin
- 7.3.1. Permian
- 7.3.2. Eagle Ford
- 7.3.3. Niobrara
- 7.3.4. Bakken
- 7.3.5. Appalachia
- 7.3.6. Other Basins
- 7.1. Market Analysis, Insights and Forecast - by Additive Type
- 8. South America USA Onshore Drilling Fluid Industry Analysis, Insights and Forecast, 2020-2032
- 8.1. Market Analysis, Insights and Forecast - by Additive Type
- 8.1.1. Protective Chemicals
- 8.1.2. Fluid Viscosifiers
- 8.1.3. Weighting Agents
- 8.1.4. Wetting Agents
- 8.1.5. Lost Circulation Materials
- 8.1.6. Thinners
- 8.1.7. Rheology Modifiers
- 8.1.8. Surfactants
- 8.1.9. Alkalinity and pH Control Materials
- 8.1.10. Shale Stabilizers
- 8.1.11. Other Additive Types
- 8.2. Market Analysis, Insights and Forecast - by Product Type
- 8.2.1. Oil-based Drilling Fluid
- 8.2.2. Synthetic-based Drilling Fluid
- 8.2.3. Water-based Drilling Fluid
- 8.3. Market Analysis, Insights and Forecast - by Basin
- 8.3.1. Permian
- 8.3.2. Eagle Ford
- 8.3.3. Niobrara
- 8.3.4. Bakken
- 8.3.5. Appalachia
- 8.3.6. Other Basins
- 8.1. Market Analysis, Insights and Forecast - by Additive Type
- 9. Europe USA Onshore Drilling Fluid Industry Analysis, Insights and Forecast, 2020-2032
- 9.1. Market Analysis, Insights and Forecast - by Additive Type
- 9.1.1. Protective Chemicals
- 9.1.2. Fluid Viscosifiers
- 9.1.3. Weighting Agents
- 9.1.4. Wetting Agents
- 9.1.5. Lost Circulation Materials
- 9.1.6. Thinners
- 9.1.7. Rheology Modifiers
- 9.1.8. Surfactants
- 9.1.9. Alkalinity and pH Control Materials
- 9.1.10. Shale Stabilizers
- 9.1.11. Other Additive Types
- 9.2. Market Analysis, Insights and Forecast - by Product Type
- 9.2.1. Oil-based Drilling Fluid
- 9.2.2. Synthetic-based Drilling Fluid
- 9.2.3. Water-based Drilling Fluid
- 9.3. Market Analysis, Insights and Forecast - by Basin
- 9.3.1. Permian
- 9.3.2. Eagle Ford
- 9.3.3. Niobrara
- 9.3.4. Bakken
- 9.3.5. Appalachia
- 9.3.6. Other Basins
- 9.1. Market Analysis, Insights and Forecast - by Additive Type
- 10. Middle East & Africa USA Onshore Drilling Fluid Industry Analysis, Insights and Forecast, 2020-2032
- 10.1. Market Analysis, Insights and Forecast - by Additive Type
- 10.1.1. Protective Chemicals
- 10.1.2. Fluid Viscosifiers
- 10.1.3. Weighting Agents
- 10.1.4. Wetting Agents
- 10.1.5. Lost Circulation Materials
- 10.1.6. Thinners
- 10.1.7. Rheology Modifiers
- 10.1.8. Surfactants
- 10.1.9. Alkalinity and pH Control Materials
- 10.1.10. Shale Stabilizers
- 10.1.11. Other Additive Types
- 10.2. Market Analysis, Insights and Forecast - by Product Type
- 10.2.1. Oil-based Drilling Fluid
- 10.2.2. Synthetic-based Drilling Fluid
- 10.2.3. Water-based Drilling Fluid
- 10.3. Market Analysis, Insights and Forecast - by Basin
- 10.3.1. Permian
- 10.3.2. Eagle Ford
- 10.3.3. Niobrara
- 10.3.4. Bakken
- 10.3.5. Appalachia
- 10.3.6. Other Basins
- 10.1. Market Analysis, Insights and Forecast - by Additive Type
- 11. Asia Pacific USA Onshore Drilling Fluid Industry Analysis, Insights and Forecast, 2020-2032
- 11.1. Market Analysis, Insights and Forecast - by Additive Type
- 11.1.1. Protective Chemicals
- 11.1.2. Fluid Viscosifiers
- 11.1.3. Weighting Agents
- 11.1.4. Wetting Agents
- 11.1.5. Lost Circulation Materials
- 11.1.6. Thinners
- 11.1.7. Rheology Modifiers
- 11.1.8. Surfactants
- 11.1.9. Alkalinity and pH Control Materials
- 11.1.10. Shale Stabilizers
- 11.1.11. Other Additive Types
- 11.2. Market Analysis, Insights and Forecast - by Product Type
- 11.2.1. Oil-based Drilling Fluid
- 11.2.2. Synthetic-based Drilling Fluid
- 11.2.3. Water-based Drilling Fluid
- 11.3. Market Analysis, Insights and Forecast - by Basin
- 11.3.1. Permian
- 11.3.2. Eagle Ford
- 11.3.3. Niobrara
- 11.3.4. Bakken
- 11.3.5. Appalachia
- 11.3.6. Other Basins
- 11.1. Market Analysis, Insights and Forecast - by Additive Type
- 12. Competitive Analysis
- 12.1. Company Profiles
- 12.1.1 IMDEX LIMITED
- 12.1.1.1. Company Overview
- 12.1.1.2. Products
- 12.1.1.3. Company Financials
- 12.1.1.4. SWOT Analysis
- 12.1.2 Horizon Mud
- 12.1.2.1. Company Overview
- 12.1.2.2. Products
- 12.1.2.3. Company Financials
- 12.1.2.4. SWOT Analysis
- 12.1.3 Aes Drilling Fluids
- 12.1.3.1. Company Overview
- 12.1.3.2. Products
- 12.1.3.3. Company Financials
- 12.1.3.4. SWOT Analysis
- 12.1.4 MEDSERV
- 12.1.4.1. Company Overview
- 12.1.4.2. Products
- 12.1.4.3. Company Financials
- 12.1.4.4. SWOT Analysis
- 12.1.5 Baker Hughes Company
- 12.1.5.1. Company Overview
- 12.1.5.2. Products
- 12.1.5.3. Company Financials
- 12.1.5.4. SWOT Analysis
- 12.1.6 Schlumberger Limited
- 12.1.6.1. Company Overview
- 12.1.6.2. Products
- 12.1.6.3. Company Financials
- 12.1.6.4. SWOT Analysis
- 12.1.7 Newpark Resources Inc
- 12.1.7.1. Company Overview
- 12.1.7.2. Products
- 12.1.7.3. Company Financials
- 12.1.7.4. SWOT Analysis
- 12.1.8 Weatherford
- 12.1.8.1. Company Overview
- 12.1.8.2. Products
- 12.1.8.3. Company Financials
- 12.1.8.4. SWOT Analysis
- 12.1.9 National Oilwell Varco
- 12.1.9.1. Company Overview
- 12.1.9.2. Products
- 12.1.9.3. Company Financials
- 12.1.9.4. SWOT Analysis
- 12.1.10 Francis Drilling Fluids Ltd
- 12.1.10.1. Company Overview
- 12.1.10.2. Products
- 12.1.10.3. Company Financials
- 12.1.10.4. SWOT Analysis
- 12.1.11 Oleon Americas Inc (Avril Group)
- 12.1.11.1. Company Overview
- 12.1.11.2. Products
- 12.1.11.3. Company Financials
- 12.1.11.4. SWOT Analysis
- 12.1.12 Q'max Solutions Inc
- 12.1.12.1. Company Overview
- 12.1.12.2. Products
- 12.1.12.3. Company Financials
- 12.1.12.4. SWOT Analysis
- 12.1.13 Unique Drilling Fluids Inc
- 12.1.13.1. Company Overview
- 12.1.13.2. Products
- 12.1.13.3. Company Financials
- 12.1.13.4. SWOT Analysis
- 12.1.14 Sunwest Fluids LLC
- 12.1.14.1. Company Overview
- 12.1.14.2. Products
- 12.1.14.3. Company Financials
- 12.1.14.4. SWOT Analysis
- 12.1.15 McAda Drilling Fluids
- 12.1.15.1. Company Overview
- 12.1.15.2. Products
- 12.1.15.3. Company Financials
- 12.1.15.4. SWOT Analysis
- 12.1.16 Geo Drilling Fluids Inc
- 12.1.16.1. Company Overview
- 12.1.16.2. Products
- 12.1.16.3. Company Financials
- 12.1.16.4. SWOT Analysis
- 12.1.17 CES Energy Solutions Corp *List Not Exhaustive
- 12.1.17.1. Company Overview
- 12.1.17.2. Products
- 12.1.17.3. Company Financials
- 12.1.17.4. SWOT Analysis
- 12.1.1 IMDEX LIMITED
- 12.2. Market Entropy
- 12.2.1 Company's Key Areas Served
- 12.2.2 Recent Developments
- 12.3. Company Market Share Analysis 2025
- 12.3.1 Top 5 Companies Market Share Analysis
- 12.3.2 Top 3 Companies Market Share Analysis
- 12.4. List of Potential Customers
- 13. Research Methodology
List of Figures
- Figure 1: Global USA Onshore Drilling Fluid Industry Revenue Breakdown (billion, %) by Region 2025 & 2033
- Figure 2: North America USA Onshore Drilling Fluid Industry Revenue (billion), by Additive Type 2025 & 2033
- Figure 3: North America USA Onshore Drilling Fluid Industry Revenue Share (%), by Additive Type 2025 & 2033
- Figure 4: North America USA Onshore Drilling Fluid Industry Revenue (billion), by Product Type 2025 & 2033
- Figure 5: North America USA Onshore Drilling Fluid Industry Revenue Share (%), by Product Type 2025 & 2033
- Figure 6: North America USA Onshore Drilling Fluid Industry Revenue (billion), by Basin 2025 & 2033
- Figure 7: North America USA Onshore Drilling Fluid Industry Revenue Share (%), by Basin 2025 & 2033
- Figure 8: North America USA Onshore Drilling Fluid Industry Revenue (billion), by Country 2025 & 2033
- Figure 9: North America USA Onshore Drilling Fluid Industry Revenue Share (%), by Country 2025 & 2033
- Figure 10: South America USA Onshore Drilling Fluid Industry Revenue (billion), by Additive Type 2025 & 2033
- Figure 11: South America USA Onshore Drilling Fluid Industry Revenue Share (%), by Additive Type 2025 & 2033
- Figure 12: South America USA Onshore Drilling Fluid Industry Revenue (billion), by Product Type 2025 & 2033
- Figure 13: South America USA Onshore Drilling Fluid Industry Revenue Share (%), by Product Type 2025 & 2033
- Figure 14: South America USA Onshore Drilling Fluid Industry Revenue (billion), by Basin 2025 & 2033
- Figure 15: South America USA Onshore Drilling Fluid Industry Revenue Share (%), by Basin 2025 & 2033
- Figure 16: South America USA Onshore Drilling Fluid Industry Revenue (billion), by Country 2025 & 2033
- Figure 17: South America USA Onshore Drilling Fluid Industry Revenue Share (%), by Country 2025 & 2033
- Figure 18: Europe USA Onshore Drilling Fluid Industry Revenue (billion), by Additive Type 2025 & 2033
- Figure 19: Europe USA Onshore Drilling Fluid Industry Revenue Share (%), by Additive Type 2025 & 2033
- Figure 20: Europe USA Onshore Drilling Fluid Industry Revenue (billion), by Product Type 2025 & 2033
- Figure 21: Europe USA Onshore Drilling Fluid Industry Revenue Share (%), by Product Type 2025 & 2033
- Figure 22: Europe USA Onshore Drilling Fluid Industry Revenue (billion), by Basin 2025 & 2033
- Figure 23: Europe USA Onshore Drilling Fluid Industry Revenue Share (%), by Basin 2025 & 2033
- Figure 24: Europe USA Onshore Drilling Fluid Industry Revenue (billion), by Country 2025 & 2033
- Figure 25: Europe USA Onshore Drilling Fluid Industry Revenue Share (%), by Country 2025 & 2033
- Figure 26: Middle East & Africa USA Onshore Drilling Fluid Industry Revenue (billion), by Additive Type 2025 & 2033
- Figure 27: Middle East & Africa USA Onshore Drilling Fluid Industry Revenue Share (%), by Additive Type 2025 & 2033
- Figure 28: Middle East & Africa USA Onshore Drilling Fluid Industry Revenue (billion), by Product Type 2025 & 2033
- Figure 29: Middle East & Africa USA Onshore Drilling Fluid Industry Revenue Share (%), by Product Type 2025 & 2033
- Figure 30: Middle East & Africa USA Onshore Drilling Fluid Industry Revenue (billion), by Basin 2025 & 2033
- Figure 31: Middle East & Africa USA Onshore Drilling Fluid Industry Revenue Share (%), by Basin 2025 & 2033
- Figure 32: Middle East & Africa USA Onshore Drilling Fluid Industry Revenue (billion), by Country 2025 & 2033
- Figure 33: Middle East & Africa USA Onshore Drilling Fluid Industry Revenue Share (%), by Country 2025 & 2033
- Figure 34: Asia Pacific USA Onshore Drilling Fluid Industry Revenue (billion), by Additive Type 2025 & 2033
- Figure 35: Asia Pacific USA Onshore Drilling Fluid Industry Revenue Share (%), by Additive Type 2025 & 2033
- Figure 36: Asia Pacific USA Onshore Drilling Fluid Industry Revenue (billion), by Product Type 2025 & 2033
- Figure 37: Asia Pacific USA Onshore Drilling Fluid Industry Revenue Share (%), by Product Type 2025 & 2033
- Figure 38: Asia Pacific USA Onshore Drilling Fluid Industry Revenue (billion), by Basin 2025 & 2033
- Figure 39: Asia Pacific USA Onshore Drilling Fluid Industry Revenue Share (%), by Basin 2025 & 2033
- Figure 40: Asia Pacific USA Onshore Drilling Fluid Industry Revenue (billion), by Country 2025 & 2033
- Figure 41: Asia Pacific USA Onshore Drilling Fluid Industry Revenue Share (%), by Country 2025 & 2033
List of Tables
- Table 1: Global USA Onshore Drilling Fluid Industry Revenue billion Forecast, by Additive Type 2020 & 2033
- Table 2: Global USA Onshore Drilling Fluid Industry Revenue billion Forecast, by Product Type 2020 & 2033
- Table 3: Global USA Onshore Drilling Fluid Industry Revenue billion Forecast, by Basin 2020 & 2033
- Table 4: Global USA Onshore Drilling Fluid Industry Revenue billion Forecast, by Region 2020 & 2033
- Table 5: Global USA Onshore Drilling Fluid Industry Revenue billion Forecast, by Additive Type 2020 & 2033
- Table 6: Global USA Onshore Drilling Fluid Industry Revenue billion Forecast, by Product Type 2020 & 2033
- Table 7: Global USA Onshore Drilling Fluid Industry Revenue billion Forecast, by Basin 2020 & 2033
- Table 8: Global USA Onshore Drilling Fluid Industry Revenue billion Forecast, by Country 2020 & 2033
- Table 9: United States USA Onshore Drilling Fluid Industry Revenue (billion) Forecast, by Application 2020 & 2033
- Table 10: Canada USA Onshore Drilling Fluid Industry Revenue (billion) Forecast, by Application 2020 & 2033
- Table 11: Mexico USA Onshore Drilling Fluid Industry Revenue (billion) Forecast, by Application 2020 & 2033
- Table 12: Global USA Onshore Drilling Fluid Industry Revenue billion Forecast, by Additive Type 2020 & 2033
- Table 13: Global USA Onshore Drilling Fluid Industry Revenue billion Forecast, by Product Type 2020 & 2033
- Table 14: Global USA Onshore Drilling Fluid Industry Revenue billion Forecast, by Basin 2020 & 2033
- Table 15: Global USA Onshore Drilling Fluid Industry Revenue billion Forecast, by Country 2020 & 2033
- Table 16: Brazil USA Onshore Drilling Fluid Industry Revenue (billion) Forecast, by Application 2020 & 2033
- Table 17: Argentina USA Onshore Drilling Fluid Industry Revenue (billion) Forecast, by Application 2020 & 2033
- Table 18: Rest of South America USA Onshore Drilling Fluid Industry Revenue (billion) Forecast, by Application 2020 & 2033
- Table 19: Global USA Onshore Drilling Fluid Industry Revenue billion Forecast, by Additive Type 2020 & 2033
- Table 20: Global USA Onshore Drilling Fluid Industry Revenue billion Forecast, by Product Type 2020 & 2033
- Table 21: Global USA Onshore Drilling Fluid Industry Revenue billion Forecast, by Basin 2020 & 2033
- Table 22: Global USA Onshore Drilling Fluid Industry Revenue billion Forecast, by Country 2020 & 2033
- Table 23: United Kingdom USA Onshore Drilling Fluid Industry Revenue (billion) Forecast, by Application 2020 & 2033
- Table 24: Germany USA Onshore Drilling Fluid Industry Revenue (billion) Forecast, by Application 2020 & 2033
- Table 25: France USA Onshore Drilling Fluid Industry Revenue (billion) Forecast, by Application 2020 & 2033
- Table 26: Italy USA Onshore Drilling Fluid Industry Revenue (billion) Forecast, by Application 2020 & 2033
- Table 27: Spain USA Onshore Drilling Fluid Industry Revenue (billion) Forecast, by Application 2020 & 2033
- Table 28: Russia USA Onshore Drilling Fluid Industry Revenue (billion) Forecast, by Application 2020 & 2033
- Table 29: Benelux USA Onshore Drilling Fluid Industry Revenue (billion) Forecast, by Application 2020 & 2033
- Table 30: Nordics USA Onshore Drilling Fluid Industry Revenue (billion) Forecast, by Application 2020 & 2033
- Table 31: Rest of Europe USA Onshore Drilling Fluid Industry Revenue (billion) Forecast, by Application 2020 & 2033
- Table 32: Global USA Onshore Drilling Fluid Industry Revenue billion Forecast, by Additive Type 2020 & 2033
- Table 33: Global USA Onshore Drilling Fluid Industry Revenue billion Forecast, by Product Type 2020 & 2033
- Table 34: Global USA Onshore Drilling Fluid Industry Revenue billion Forecast, by Basin 2020 & 2033
- Table 35: Global USA Onshore Drilling Fluid Industry Revenue billion Forecast, by Country 2020 & 2033
- Table 36: Turkey USA Onshore Drilling Fluid Industry Revenue (billion) Forecast, by Application 2020 & 2033
- Table 37: Israel USA Onshore Drilling Fluid Industry Revenue (billion) Forecast, by Application 2020 & 2033
- Table 38: GCC USA Onshore Drilling Fluid Industry Revenue (billion) Forecast, by Application 2020 & 2033
- Table 39: North Africa USA Onshore Drilling Fluid Industry Revenue (billion) Forecast, by Application 2020 & 2033
- Table 40: South Africa USA Onshore Drilling Fluid Industry Revenue (billion) Forecast, by Application 2020 & 2033
- Table 41: Rest of Middle East & Africa USA Onshore Drilling Fluid Industry Revenue (billion) Forecast, by Application 2020 & 2033
- Table 42: Global USA Onshore Drilling Fluid Industry Revenue billion Forecast, by Additive Type 2020 & 2033
- Table 43: Global USA Onshore Drilling Fluid Industry Revenue billion Forecast, by Product Type 2020 & 2033
- Table 44: Global USA Onshore Drilling Fluid Industry Revenue billion Forecast, by Basin 2020 & 2033
- Table 45: Global USA Onshore Drilling Fluid Industry Revenue billion Forecast, by Country 2020 & 2033
- Table 46: China USA Onshore Drilling Fluid Industry Revenue (billion) Forecast, by Application 2020 & 2033
- Table 47: India USA Onshore Drilling Fluid Industry Revenue (billion) Forecast, by Application 2020 & 2033
- Table 48: Japan USA Onshore Drilling Fluid Industry Revenue (billion) Forecast, by Application 2020 & 2033
- Table 49: South Korea USA Onshore Drilling Fluid Industry Revenue (billion) Forecast, by Application 2020 & 2033
- Table 50: ASEAN USA Onshore Drilling Fluid Industry Revenue (billion) Forecast, by Application 2020 & 2033
- Table 51: Oceania USA Onshore Drilling Fluid Industry Revenue (billion) Forecast, by Application 2020 & 2033
- Table 52: Rest of Asia Pacific USA Onshore Drilling Fluid Industry Revenue (billion) Forecast, by Application 2020 & 2033
Frequently Asked Questions
1. What is the projected Compound Annual Growth Rate (CAGR) of the USA Onshore Drilling Fluid Industry?
The projected CAGR is approximately 7.5%.
2. Which companies are prominent players in the USA Onshore Drilling Fluid Industry?
Key companies in the market include IMDEX LIMITED, Horizon Mud, Aes Drilling Fluids, MEDSERV, Baker Hughes Company, Schlumberger Limited, Newpark Resources Inc, Weatherford, National Oilwell Varco, Francis Drilling Fluids Ltd, Oleon Americas Inc (Avril Group), Q'max Solutions Inc, Unique Drilling Fluids Inc, Sunwest Fluids LLC, McAda Drilling Fluids, Geo Drilling Fluids Inc, CES Energy Solutions Corp *List Not Exhaustive.
3. What are the main segments of the USA Onshore Drilling Fluid Industry?
The market segments include Additive Type, Product Type, Basin.
4. Can you provide details about the market size?
The market size is estimated to be USD 2.7 billion as of 2022.
5. What are some drivers contributing to market growth?
; Low Breakeven Price and High Crude Oil Price; Increasing Demand for Longer Lateral Length; Continuous Growth in Demand from Permian Basin.
6. What are the notable trends driving market growth?
Continuous Growth in Demand from Permian Basin.
7. Are there any restraints impacting market growth?
; Low Breakeven Price and High Crude Oil Price; Increasing Demand for Longer Lateral Length; Continuous Growth in Demand from Permian Basin.
8. Can you provide examples of recent developments in the market?
N/A
9. What pricing options are available for accessing the report?
Pricing options include single-user, multi-user, and enterprise licenses priced at USD 3800, USD 4500, and USD 5800 respectively.
10. Is the market size provided in terms of value or volume?
The market size is provided in terms of value, measured in billion.
11. Are there any specific market keywords associated with the report?
Yes, the market keyword associated with the report is "USA Onshore Drilling Fluid Industry," which aids in identifying and referencing the specific market segment covered.
12. How do I determine which pricing option suits my needs best?
The pricing options vary based on user requirements and access needs. Individual users may opt for single-user licenses, while businesses requiring broader access may choose multi-user or enterprise licenses for cost-effective access to the report.
13. Are there any additional resources or data provided in the USA Onshore Drilling Fluid Industry report?
While the report offers comprehensive insights, it's advisable to review the specific contents or supplementary materials provided to ascertain if additional resources or data are available.
14. How can I stay updated on further developments or reports in the USA Onshore Drilling Fluid Industry?
To stay informed about further developments, trends, and reports in the USA Onshore Drilling Fluid Industry, consider subscribing to industry newsletters, following relevant companies and organizations, or regularly checking reputable industry news sources and publications.
Methodology
Step 1 - Identification of Relevant Samples Size from Population Database


Step 2 - Approaches for Defining Global Market Size (Value, Volume* & Price*)

Note*: In applicable scenarios
Step 3 - Data Sources
Primary Research
- Web Analytics
- Survey Reports
- Research Institute
- Latest Research Reports
- Opinion Leaders
Secondary Research
- Annual Reports
- White Paper
- Latest Press Release
- Industry Association
- Paid Database
- Investor Presentations

Step 4 - Data Triangulation
Involves using different sources of information in order to increase the validity of a study
These sources are likely to be stakeholders in a program - participants, other researchers, program staff, other community members, and so on.
Then we put all data in single framework & apply various statistical tools to find out the dynamic on the market.
During the analysis stage, feedback from the stakeholder groups would be compared to determine areas of agreement as well as areas of divergence